Modelling the level of adoption of analytical tools; An implementation of multi-criteria evidential reasoning
In the future, competitive advantages will be given to organisations that can extract valuable information from massive data and make better decisions. In most cases, this data comes from multiple sources. Therefore, the challenge is to aggregate the…
Authors: Igor Barahona, Judith Cavazos, Jian-Bo Yang
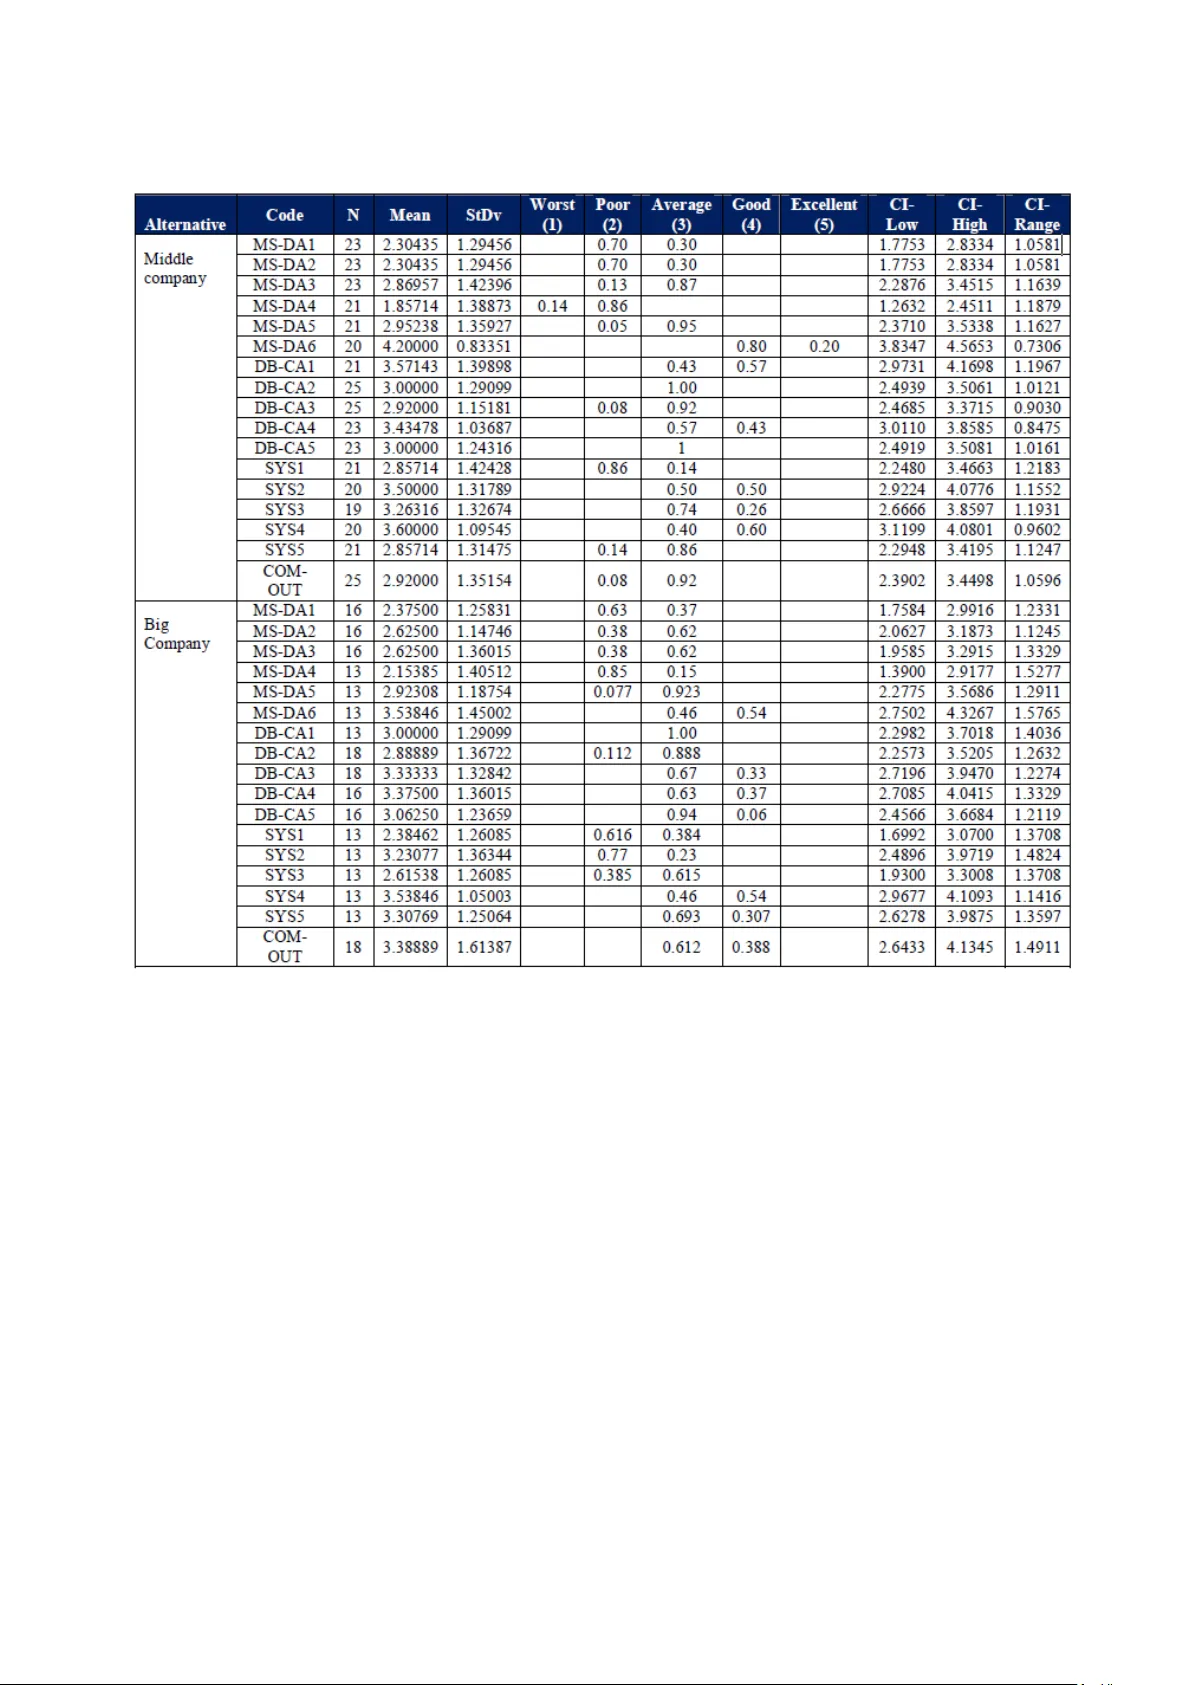
129 International Journal of Supply and Opera tions Management IJSOM August 2014, Volume 1, Issue 2, pp. 129-151 ISSN-Print: 2383-1359 ISSN-Online: 2383-2525 www.ijsom.com Modelling the le vel of adopti on of analytic al tools; An implem entation of multi-criteria e vidential re asoning Igor Barahona a* , Judith Cavazos b and Jian-Bo Yang c a Chapingo Autonomous University (UACh) - Cátedras CONACYT, México b Popular Autonomous University of Puebla State. Puebla, México c The University of Manchester. Manchester, UK Abstract In the future, competitive advant ages will be given to organisations that can ex tract valuable information from massive data and make better decisions. I n most cases, this data comes from multiple sources. Therefore, the challenge is to aggregate the m into a common framework in order to make them meaningful and useful. This paper will first review the most important multi -criteria decision anal ysis methods (MCDA) existing in current liter ature. We will offer a novel, practica l and consistent methodology based on a t y pe of MCDA, to aggrega te data from two different sources into a common fr amework. Two datasets that are different in nature but related to the same topic are aggregated to a common scale b y i mplementing a set of transformation rules. This allows us to ge nerate appropriate evidence for assessin g and finally priori tising the level of adoption of analytical tools in four type s of c ompanies. A numerical e xample is provided to clarify the form for implementing this methodology. A six -step process is offered as a guideline to assist engineers, researchers or p ractitioners interested in replicating th is methodolog y in an y situation where there is a need to aggregate and transform multiple source data . Keywords: MCDA m ethods; evidential reason ing; analytical tools; m ultiple source data . 1. Introduction The complexit y of toda y ‘s economic environment with market globalisations, the emergence of more powe rful computers, int ricate I nternet-based systems, a nd the proliferation of re al-time communication channels is transforming the wa y in which organisations make decisions. The fir st immediate result of these changes is the accumulation of massive amounts of data. According to Gantz & Reinsel (2012), data accumulated in the years 2005 to 2020 will grow by a factor of 300; * Correspondin g email address: igorbarahona@hotmail.co m Barahona, Cavazos and Yang 130 that is, from 130 ex aby tes to 40,000 exab y tes, or 40 trillion gig abytes. In terms of composition, around 68% o f all information worldwide will be cr eated and used by co nsumers in the f orm of activities such as watching di gital TV, interacting in social networks, or sending im ages and videos, among others. Private org anisations will own nearl y 80% of the da ta in the ― digital universe ‖ and will be required to deal with issues as security, privac y , copyright and regulatory compliance. In view of this exponential growth in data , it is clear that organisations will have to respond to these changes. It is a fac t that traditional decision making approaches, bas ed mostl y on intuitive judgements and past experience, are graduall y b ecoming inadequate guides for dealing with this increasingly complexity. The challenge, then, is to find new approaches for extracting re levant information from the enormous amounts of data available, and making more accurate decisions. In toda y ‘s globalised m arkets, the ability to anal yse data and create value in order to successfully response to the expectations of customers, suppli ers, staff, shareholders and soc iety will represent a competitive advanta ge. The emergence o f the concept of evidence -based manage ment (E BMgt) in 2006 made this tende ncy c lear. According t o Rousseau (2006), EBMgt is define d as the discipline of making the most accurate de cisions through the application of science and res earch- principles, which is possible only when the values are credible, the evidence is clear and findings are interpretable b y all stakeholders. A second mo vement introduced in response to the mentioned tendencies is the concept of predictive anal y tics. This basically deals with ex tracting valuable information from data in order to pre dict trends, beha viours and patter ns. The main c oncept behind predictive anal y tics relies on establishing relations between ex planatory and p redicted variables (―Predictive anal y tics‖, 2014). Here , only two movements are discussed in order to illustrate what some experts and practitioners are doing as a respons e to the need to take advantage of ― big data ‖. An ex tensive discussi on about these ch anges and tendencies can be found in Davenport, Harris & Morison (2010), Lynch (2008), Scott, A. J. (2012) and Anderson - Cook et al (2012 ). The discussion will centre in later lines on how real- world data is obt ained in order to validate what we found in our review of literature. Our research objectives will be introduced at the end of this section. The relevance of investigating how organisations can improve their analytical capabilities and obtain more ben efits from data available is clear. Barahona & R iba (2012) discussed a five-level scale to m easure the l evel of adoption of analy tical tools, which was later applied to a s ample of 255 organisations. An analy sis of this data allowed us to formulate guidelines that would help companies to improv e their a nal y tical capabilities. The research was later complement ed by interviews with managers, consultants, academics and practitioners. A total of 10 interviews were carried out, and the results allowed us to propose a three -level scale. Ba sed on these two sour ces of data with different scales, the challenge is to provide a generic f ramework that will allow us to obtain unique and relevant conclusions, while preventing a loss of information. A novel structure is required in order to deal with this problem, as stated in the following objectives: Int J Supply Oper Manage ( IJSOM) 131 Based on the principles set b y Yang et al (2011), investigate the scales from questionnaires and interviews so that these can be aggregated int o a unique framework. Apply th e evidential reasoning approa ch to c alculate the overall performance of the level of adoption of analytical tools for four types of companies. Offer a numerical example as a tool for replication to researchers and practitioners interested in tackling the problem of multiple-source data. This paper is divided into five parts. The following s ection will re view literature related to multi - criteria decision analysis methodologies. Section three gives an explanation of the methodology implemented. A numerical example is provided i n section four, with ou r conclusions presented in the last section. 2. Literature review According to Belton & Stewart (2002) the term Multi -Criteria Decision Analysis (MCDA) encompasses several quantitative approaches which ― seek to tak e explicit account of multiple criteria in helping indi viduals or groups explore decisions that matter ‖. Mendoza & Martins (2006) identify three formal dimensions that are present in all of these approaches: 1) All MCDA methods are based on a formal approach; 2) they are invariabl y formed of mul tiple criteria; and 3) decisions are made either b y individuals or groups. Pohekar & Ramachandran (2004) emphasise some features present in all MCDA methods: first, they help to improve the quality of decisions made by making them more expli cit, rational and efficient. Simil arly , t hey in crease the level of understanding of complex problems, encourage the active participation of the individuals involved, stimulate decisions made collectively a nd therefore improve team work skills. Literature contains several ways to classif y different MC DA methods. Mendoza & Martins (2006) explained a classification that makes a distinction between multi -objective decision making (MODM) and multi-attribute decision making (MADM). The main difference between these two families of methods is basicall y the number of alt ernatives. Hayashi (200 0) suggests that MADM methods are appropriate for decisions on discrete alternatives while MOD M are more suitable for tackling multi-attribute problems when infinite numbers of solutions are given b y a set of previously defined constraints. A deeper discussion about the differences between multi -objective and multi ple-attribute is provided in Malczewski (1999), Tzeng & Huan g (2011), Pukkala (2002), Belton & Stewart (2002) and Mendoza &Prabhu (2002). These are summarised in Table 1. Among the most widely used methods is the Weighted sum method (WSM). According to Belton & Stewart (2002) W SM is suitable for tackling single dimensional problems. For inst ance, consider a sc enario when the best alternative will be selected from M diffe rent alternatives and N criteria. Th e overall per formance of each alternative is equal to the su m of its products; that is : . As the complexity of the problem increases, the suitabilit y of the method decreases. Barahona, Cavazos and Yang 132 Table1. Differences b etween MODM and M ADM methods (Adapted fro m Malczewski, 1999 ) Criteria for comparison MODM MADM Now criteria are defined. Objectives Attributes How objectives are defined. Explicitly Implicitly How attributes are defined Implicitly Explicitly How constrains are defined. Explicitly Implicitly How alternatives are defined. Implicitly Explicitly Number of alternatives Infinite (Very large) Finite (Small) Decision maker‘s control Very high Limited Decision modelling paradigm. Design / Search Evaluation / Choice Another widely known MCDA method is the analytical hierarchy process (AHP) proposed by Saaty (1980). This method compares pairs of alternatives to assess their re lative importance in order to reach a given criterion. I n terms of Pohekar & Ramachandran (2004) , this is done by breaking the problem down into a hi erarchy with the goal at the top, criteria and sub-criteria at levels and sublevels, and alternative decisions at the bottom level of the hierarch y . Comparisons are made by applying verbal terms that assign weights to each alternative. I n this wa y, the final composite vector of weights is obtained, wh ich expresses the r anked a lternatives. A detailed explanation of the AHP methodology and its applications for different discipl ines can be found in Saaty (1980), Saaty (1990) and Saaty ( 1991). The ELECTRE, (ELimination Et Choix Traduisant la REalité, for the French acron y m) proposed by Roy (1968), is another MCDA method. Mousseau, Slowinski & Zielniewicz (2000) proposed a two step approach to assign alternatives to pre-defined criteria: first, the construction of an outranking relation S which characterises how alternatives compare to the limits of categories; and second, the exploi tation of the re lation S in order to assign each alternative to a specific criterion. In thi s way, alterna tive ― a ‖ is assigned as a result of the comparison of ― a ‖ with profiles defined by the limits of the categories. The criteria in this method have two distinct sets of parameters: the importance coefficients and the veto thresholds. Mousseau & Slowinski (1998) and Mousseau, Slowinski & Zielniewicz (2000) provide a detailed expl anation of how specialised software can be utilised for this application (See http://www.decision-deck.org/diviz/download.html ). The fourth approach presented here is PROMET HEE (Preference Ranking organisation Method for Enrichment Evaluations). According to Brans, Vincke & Mareschal (1986), the method is based on mutual comparisons of pairs of alternatives with respec t to each sele cted criterion. A Int J Supply Oper Manage ( IJSOM) 133 preference function is introduced in order to rank the investigated alternatives. That is, the criteria functions are used to assess alternatives a and b . For instance, if the result for the given function is , then we can sa y that alternative a is b etter than b . Based on the pairwise comparisons, the decision maker assigns a preference to e ach alternative, in a value from 0 to 1. Louviere, Hensher & Swait (2000) and Brans, Vincke & Mareschal (1986) offer a deeper discussion on this method. The TOPS I S method (Technique for Order Preference by Simil arity t o I deal S olution) was introduced by Yoon & Hwang (1995) as an alternative methodology to ELECTRE. This method is based on the premise that the selected alternat ive s hould be the shortest geometrical distance from the n egative ideal solution. One assumption used in the model is that each criterion is evenl y distributed in the geometrical space and thus the o rder of preference of the alternatives is given b y comparing Euclidean distances among alterna tives. First, a decision matrix with M alterna tives and N c riteria is formulat ed. Then the no rmalised decision matrix is calculated, giving us the ideal and non-negative solutions. Like other m ethods, it searches for the ma ximum value and the minimum values amongst the alternative cost crit eria. Fin ally, th e calculations, separations and measures are made in order to g et the r elative closeness to the ideal solution. According to Pohekar & Ramachandran (2004), the best alternative is the one that is the shortest distance to the ideal solution and the longest distance from the negative ideal solution. The evidential reasoning (ER) approach is a generic evidence-based t y pe of multi-criteria decision analysis (MCDA). According to Yang & Singh (1994), the evidential reasoning approach is different from conventional MCDA methods in that it uses evidence-based reasoning to reach a decision. One of the most important contributions of this method is its capacit y to describe a scenario b y using be lief structure s or be lief decision matrices, whic h i s used to a ssess e ach alternative through vectors of paired elements. T he ER approach a ggregates attributes through a non-linear p rocess th at is given b y the weights of criteria, and assesses the form of ea ch criterion. This characteristic, available in ER, is not available in other MCDA methods. Considering that the p reviously mentioned features of ER are not p resent in other MCDA methods, this is a suitable tool for investigating the level of adoption of anal y tical tools. The problem of aggreg ating data from different sourc es by appl y ing the ER approach is discussed in the following sections. 3. Methodology A general notion define s the concept of prioritising as assigning a higher value to som e thi ngs over other thin gs. Yang et. al (2011) define pri oritising as ranking the alternatives fo r either a given individual criteria or for the overall criterion. For example, one simple appro ach for rankin g the level of adoption of analytical tools is to quantify each value of the scale into a certain fixed value, calculate it s mean, and rank different alternatives based on their mean values. The problem is that this approach can onl y produce a narrower sense of the data, while any richer information contained on it is lost. Yang et. al (2011) propose a solution to this problem, which is to utilise a generic f ramework. This method does not require the assessment values t o be quantified to fixed Barahona, Cavazos and Yang 134 values; instead, it allows to them to take any values that sui t their qualitative definitions and meanings. The implementation of this approach is explained in following paragraphs. Figure 1 introduces a common framew ork. The leve l of adoption of analy tical tools can be assessed in one o r more ways. This assessment in this particular case is made in two ways: first, questionnaires collect information regarding four attributes; and secondl y, int erviews are related to three additional attributes. Figure1. A common framework for assessing the leve l of adoptio n of anal ytical tools. On the left side of fig ure 1 is the first attribute of Data -Based competitive advantages. This refers to practice s and actions t hat are implemented as a data analysis b y organisations in order to create competitive advantages. In the sec ond pla ce, we have s ystemic thinking which measures the degree of s ystemic visi on of the organisation. The thi rd attribute refers to the degree of management support for ana l y tical projects, and the last attribute relates to questionnaires, i.e. the degree of communication with outside actors. Against this, on the right side of figure 1, the first attribute with respect to interviews is org anisational values‘, understood as a set of beliefs that specify universal expectations and modes of b ehaviour preferr ed b y the organisation as the y relate to data anal y sis and ex ploitation (Schwartz, 1994). This is followed b y ‗tactical features‘, referring to immediate or short-term actions that are less important than organisational values, but indispensable in terms of expanding the use of anal y tical tools. Well -aligned tactical features are expected to create a li nk between operative attributes and values. The last attribute that depends on interviews is the so - called ‗operative attributes‘. These are critical; thi s is where the ― rubber hits the road ‖ in terms of expanding the level of adoption of anal ytical tools through statisti cal methods, procedures and other analytical tools. 3.1 Written questionnaire A questionnaire w as de signed to investigate th e level of adoption of anal y tical tools. Several statistical tests were run in order to guarantee its reliability and validity, among them the interclass correlation coefficient (ICC) proposed b y F leiss ( 1971) and Shrout & Fleiss (1979), a measure o f reliability on the scale proposed by Cronbach (1951) and the Kappa measure of agreement introduced b y Cohen (1 960). The results from all tests were satisfactory. A confirmatory factor Int J Supply Oper Manage ( IJSOM) 135 analysis (CFA) later pro vided a quantitative foun dation for the conceptual model. Table 2 shows the structure of the questionnaire. Table2 . Questionnaire struc ture. Section Number of items Categorical que stions 3 Data Based Com petitive Adv antage 5 Management Suppo rt Data Analy sis 6 Systemic Think ing 5 Comm unication outside the company 1 Total 20 A total of 255 companies provided us with information related to their analytica l capabilities. Questions were presented on a five-level scale, all related to data anal ysis best practices. The instrument was addresse d to the information technologies mana ger, quality manager or managing director, with a request to be redirected to the proper person when n ecessary. On the cover stated, we openl y stated ou r wil lingness to share the study conclusions with anyone who wanted them. Since the original instrument had 20 questions, onl y 17 were suitable for MCDA. Those responses, which were based on an ordinal scale with five assessment grades, are subjecti ve in nature. The scale used is represented as follows: According to the expression (1), a manager ma y choose one of the grades in order to assess the level of adoption of analytical tools in his/her organisation. Considering that K responders participated in our study and k l,n of them selected a grade H 1, n for assess ing the or ganisation in alternative A l , then the degree of belief to which an organisation assessed by the whole group of managers to the grade H 1, n on the alterna tive A l is given as follows: (2 ) The rating that evaluates an org anisation for alte rnative A l b y the whole group of managers who answered our survey is expressed as: Regarding expression (3), . In addition, and provide a measure for responders who did not ma ke an y assessment of alternative A l . That is, represents the amount of missing information or the degree of i gnorance for alternative A l . According to Yang (2001) and Yang et al (2011), expression (3) adequatel y records the Barahona, Cavazos and Yang 136 assessment information g athered and maintains the diversity of each questionnaire, and ther efore, generates suitable information for further decision analysis. Moreover, and considering that our data comes from a survey, the m ean calculated for the distributed assessment is relevant as a simpler perf ormance ind icator. If is the utility given to and there is no missing information, then , the mean for distribution (3) is given by: Formula (4) provides relevant information about the level of adoption of anal ytica l tools for alternative A l . For instance, if an organisation is given a hi gh mean for any particular alternative, then that organisation should work to maintain the achieved stren gth. On the other hand, if the organisation obtains a lo w mean on any given alternative, then th at alternative should be given a high priorit y so that the organisation can overcome this weakness. I n sho rt, expressions (1) to (4) can be applied to our data in order to collect relevant evidence regarding the level of adoption of analytical tools, including distributed assessments for each company. Comparisons can later be made between different companies on any given a ttribute. 3.2 Interviews Interviews were performed to investigate the soft and unstructured features of the level of adoption of anal ytica l to ols. Although these interviews were unstructured, the sc ript allowed us to maintain a genera l guideline during the course of each interview. The script and interviews were designed following the laddering methodology proposed by Re ynolds & Gutman (1988). Th e term ― laddering ‖ refers to a one -on-one interviewing technique which is applied to understand how individuals transform the attributes o f an y given concept or id ea into meaningful associations with respect to self b y following the Means -End theory. In this research, we focused on investigating scales, but a detailed explanation of both laddering te chnique and Means -End theor y can be found in Herrmann et al (2000), Reynolds & Gutman (1984) and Reynolds & Gutman (1988). The core idea behind the ladd ering te chnique basically involves eliciting elements in a sequential order from bottom to top. On the bottom, we find the most concre te (or least abstract) elements, while the top is composed of the most abstract elements. Three levels of abstraction were used followin g an order of ― attributes ‖ ― tactical features ― values ‖. in thi s respect, Deming (2000) emphasi ses the relevance of the values as a key e lement for expanding th e adoption of anal y tical tools. Likewise and according to Anderson-Cook et. al (2012) (,) tactical features are the link between ope rative attributes and values. Based on thi s, a three -level scale was defined as follows: Similar to the process applied to questionnaires as expressed in (3), the distributed assessment for the interviews in alternative A l , given by: Int J Supply Oper Manage ( IJSOM) 137 Where , n =1, 2, 3 is c alculated in the same way as ex pression (2). In addition, is a measure of i gnorance, and . L ikewise, is the utility assigned to . If we assume that this is a complete distribution, so that , then the mean value is given by: Expression (7) can be applied to decide if a criterion should be given high priority or to compare several or ganisations. For instance, if an or ganisation receives a hi gher accumulated d egree of belief to the top grade, ( in (6)) then this criterion should be given high priority in order to maintain the organisation‘s strengths. On the ot her hand , if an organisation receives the lowest accumulated degree of belief to the bottom grade ( in (6)), then this criterion should be given high priority in order to improve the organisation‘s wea kness. At this point, scales (1) and (5) have to be transformed into a common framew ork in order to obtain a richer assessment on the level of adoption of analytical tools. This enriche d assessment will provide more accurate information about how the adoption of analytical tools can be expanded. The following paragra phs will investigate a set of rule-based techniques to transform the original data into a common framework. 3.3 Common framework The challenge, at this point, is how to agg regate t wo sources of information and investigate them under a sin gle framework, while preventing the loss or skewing of any information. Yang et al (2011), Yang (2001) and Liu et. al (2008) demonstrated that expert judgments are routinel y used in industr y for interpreting surve y data. Belton & Stewart (2002) highlighted th e importance of the judge‘s ex pertise in enrichin g dist ribution assessments. The propo sed scale, b y ga thering evidence f rom expert knowledge, should preserve original information from questionnaires and interviews while it is understandable and e asy to use. The evidence gathered should likewise provide a set o f common sense rules that c an be used durin g the transform ation process in a flexible form. Considering the above, a five -level monotonic scale is pro vided in the following way: A complete and specific definition of the scale, including each of its five levels, w as carried out while this researc h was performed. This is part of the operative definition of variables that was Barahona, Cavazos and Yang 138 previously done in order to gather richer eviden ce. The distributed assessment of alternative including both questionnaires and interviews is g iven in expression (9). Expressions (8) and (9 ) represent th e common framework on which data from questionnaires and interviews are transformed. Moreover, the possibilit y that responders mi ght sele ct two or more assessment grades shou ld be considered in the new common f ramework. For instance, if a responder ticks onl y one grade , th en this is equivalent to assigning a b elief of 100% to that grade and 0% to all others. The evaluation rating for each criterion is stated as follows: Expression (10), represents the mean de gree of belief g iven to the assessment n on statement l -th. K is the total number of respondents and is the degree of belief provided b y the respondent j to the ass essment n . Furthermore, will be equal to 1.0 when the responder provides complete information; otherwise, this will be less than 1.0. This flexibilit y allows us to capture more accurate information and prevents a loss of significance. Table3 . Example o f the new framework for assessment grades Assessment grade Worst Poor Average Good Excellent Unknown Survey statement. ― Senior managers encourage data analysis for decision making ‖ Belief of degree As mentioned before, the respond er is not fo rced to tick onl y one grade. For instance, an individual manager may assess the statement ― senior managers encourage data analysis for better decision making ‖ as 50 %=‖ average ‖, 30%=‖ good ‖ and 20%=‖ excellent ‖. Note that three g rades were selected whose su m is equal to 1.0. With our common framewor k presented, now we must offer a set of rule-based techniques in order to transform the scales inve stigated. 3.4 Qualitative transformation for questionnaires The scale used for th e questionnaires c an be almost directly t ransformed into the new common scale. That is, conside ring that both scales have five grades with the underlying logic that ― higher is better ‖, the transformation is easier to im plement. The following equivalence of rules is proposed. Int J Supply Oper Manage ( IJSOM) 139 For pu rposes of this research, the s ymbol ‗ ‘ means ‗ is equivalent ‖ in terms of utilit y . The implementation of these rules does not impl y that there is any change in the utilities. For instance, if is de fined as the utility o f H n , then , , , and . I t is important to mention that we assume that the grades are evenl y distributed in the assessment space: H 1 has the lowest utili ty while H 5 is associated with the highest. According to thes e rules for transformation, the grades from the q uestionnaires can be transformed into the framework presented in subsection 2.3. That is, the distributed assessment presented in (3) is converted to its equivalent shown in (9). 3.5 Qualitative transformation of interviews On the other hand, data f rom interviews is based on a scale of three lev els. This ca n be expanded to five levels, representing an additional degree of complexit y . The scale for th e interviews is given the logical o rder ― higher is better ‖, and anchoring points are not required to carry out the transformation. The following rules of equivalence are proposed for interviews. 0.25 + + 0.25 The introduction of the p roposed rules impli es a c hange in th e utilities. More specifically, we see that , and . There is also an assump tion that the grades are evenly distributed. In this wa y, the dist ributed assessment presented in (6) is converted to its equivalent shown in (9). The next section gives a numerical example. 4. Numerical example A six -step process is proposed to im plement the described methodology. I t be gins with p reparing the data for the analysis and finishes with the calculations (see figur e 2). Barahona, Cavazos and Yang 140 Figure2 . Implementatio n procedure. 4.1 Data preparation To begin several tasks must be completed in order to guarantee the data‘s suitability for the analysis. Some features must be observed fo r th e dataset prior to the analysis. For instance, its format should allow it to be easil y m anipulated in order to esta blish common equivalences for data comin g from di fferent sources. Considering that poor qualit y data inevitabl y leads to incorrect conclusions, such tasks as purging a nd cleaning are our major concern on this step. 4.2 Implement the common framework Our instrument is composed of 17 items, each on a five -level scale. These items are also classified according to four dimensions or parent attributes. On the other hand, interviews are composed of 3 pare nt-attributes and 2 5 bottom -level attributes, each on a three-lev el sc ale. The challenge is to aggregate both datasets into a common framework (see fi gure 1). T ables 4 and 5 present the structures and the related grades values for both q uestionnaires and intervi ews, respectively. The utilities assigned b y us for each grade on both scales are based on the research conducted b y Tallon, Kraemer & Gurbax ani (2000), who introduced a seven-level scale to measure the value of the busi ness in a sample of 304 executives worldwide. Powell & Dent -Micallef (1997) also proposed a five-level scale to measure the degree of contribution of information technolog y to competitive advantages, and Gardner (2004) do cumented a fiv e-level scale to measure the degree of maturit y of a process. We assig ned the degree of utilit y for each o f the scales b y carefully reviewing the scales, as seen in tables 4 and 5. Table4 . Structure and grad es-values for q uestionnaires. Model summ ary Grades for que stionnaires Number of parent a ttributes: 4 u(H 1,1 ) := u ( worst ) =0.00 u(H 1,2 ) := u ( poor ) = 0.25 Number of bottom a tributes: 17 u(H 1,3 ) := u ( average ) =0 .50 Selected method for relating parent and bottom attributes: RULE-BASED APPROACH (Yang 2001) u(H 1,4 ) := u ( good ) = 0.75 u(H 1,5 ) := u ( best ) = 1.00 Implement the common frame work 4.2 Relat e father and bott om attribut es. 4.3 Assigning weights. 4.4 Assigning degree of belief . 4.5 Calculate assessments. 4.6 Conclusions Data prepar atio n. 4.1 Int J Supply Oper Manage ( IJSOM) 141 Table5 . Structure and grad es-values for interviews. Model summ ary Grades for inte rviews Number of parent a ttributes: 3 u(H 2,1 ) := u ( Minimal ) =0.00 Number of bottom a tributes: 25 u(H 2.2 ) := u ( Average ) = 0 .50 Selected method f or relatin g parent and bottom at tributes: RULE-BASED APPR OACH (Yang 2001) u(H 2,3 ) := u ( Excellen t ) =1.00 At this point, a common framew ork is proposed. The different scales, which were used to collec t data from different sour ces, have been transfo rmed to equivalent values b y implementing rules. This problem is discussed in the next subsection. 4.3 Relate father and bottom attributes According to Yang (2001), a quantitative relationship must be established between par ent and bottom attributes. For in stance, if the bottom attribute ‗Communication and trust‘ is assessed on the basis of a 3-le vel scale, then it must be related to the father attribute given to it on a 5 -level scale. This will require that we make transformations on 4 and 3 attributes for questionnaires and interviews, respectively, in order to complete the overall assessment of the model. Yang (2001) discusses two ways to convert bottom assessments to fathers, the first based on rules and the second on utilities. Due to limitations of space, we will not discuss here the properties of each transformation method. We selected the rule based method considering the advantages widely discussed b y Xu, McCarth y & Yan g (2006) and Yang (2001). The following is an illustrative example which will help to explain how this method works. Consider the case of when a particular decision maker (DM ) ticks the g rade ― minimal impact ‖ on the attribute ― communication and trust ‖. A rule is generated to relate its grade with the overall performance in the following wa y: IF ― communication and trust ‖ IS ―minimal‖ , THEN overall performance is ― analytical ignorance ‖. Similarly , IF ― communication and trust ‖ IS ― average ‖, THEN overall performance is ― Analytical aspirations ‖. The complete set o f rules for transformin g this attribute is shown in table 6. Table6. Relating COMMU NICATION AND T RUST to its father attribute. If CO MMUNICATION AND TRUST is Minima l =0.00 Then Overall Pe rformance is Analytical Ignoranc e =100% If CO MMUNICATION AND TRUST is Minima l =0.125 & Average =0.125 Then Overall Pe rformance is Analytical Focused = 100% If CO MMUNICATION AND TRUST is Average = 0.50 Then Overall Pe rformance is Analytical Aspira tions =100% If CO MMUNICATION AND TRUST is Average =0.375 & Excellent =0.375 Then Overall Pe rformance is Analytics as System =100% If CO MMUNICATION AND TRUST is Excellent =1.00 Then Overall Pe rformance is Analytics as Comp. Advan tages =100% Barahona, Cavazos and Yang 142 A total of 210 rules were sim ilarly generated in order to complete our model as shown in table 6, 85 of which were implemented for the 17 items of the questionnaire and 125 for the 25 interview attributes. Appendix A gives the complete list of bottom attributes. 4.4 Assigning weights The wei ght of an attribute is its relative importance with respect to the r est of attributes in the model. That is, different features may have different importance, and this shoul d be reflected in the model. For inst ance, a ccording to Amabile et al (1996) , if an o rganisation is willing to increase the use of analytical tools for better d ecision making, values might be more important than opera tive attributes. Consequentl y , organisational values should have a larger weight in the model. Here, we are implementing the weight assignment process proposed by Xu, McCarthy & Yang (2006). First, we calculate the frequenc y fo r each attribute b y includ ing all of its responses. The higher the frequency of a bottom-level attribute, the larger the weight it should be given in the model. Two of three types of weights were assi gned in thi s way; the last was assigned based on the conclusions of literature. The lowest levels ar e weights assi gned to the bottom -level attributes, 17 for questionnaires and 25 interviews. Fi gure3 . Normalised weights for questionnaires . Figure4 . No rmalised weights for intervie ws. Previous calculations clearl y show that the D empster rule proved to be commutative and associative – evidence that can be combined in any order. Although weights here were obtained by normalising responses from questionnaires and interviews, note that the combination of evidence can be carried out pairwise as well. 4.5 Assigning degree of belief While the mean was calculated for each questionnaire attributed as , interviews were treated differently since the y w ere given in terms of cumulative frequencies. The formula was applied to transform operative a ttributes; a nd similarl y, tactic al attributes and organisational values were transformed with and , respectively. Three of these were transformed to a three level scale (see appendix A ). At this point, both sourc es of data w ere ready for assignment o f the degree of belief, meaning their conversion to a five level scale. For instance, if the mean of the attribute ― DB -CA5 In your company, is there a work environment that encourages the use of analytical t echniques and data 22 % 25 % 29 % 23 % MS-DA DB-CA SYS COM-OUT 29 % 31 % 40 % Operative Attributes Tactical features Organizational values Int J Supply Oper Manage ( IJSOM) 143 was 2.236, then this value had to b e transformed to the vector: {‗ Worst ‘=0.0, ‗ Poor ‘=0.64, ‗ Average ‘=0.36, ‗ Good ‘=0.0, ‗ Excellent ‘=0.0}. Similarl y , if the mean value of the interview attribute ― Data online supports business decisions ‖ was 2.25, then it should be transformed to th e ve ctor: {‗ Minimal ‘=0.0, ‗ Average ‘=0.75, ‗ Excellent ‘=0.25}. A total of 42 vectors, of which 17 we re for questionnaires an d 25 for interviews, were yielded. Bellow, the general formulation that summarises the performed transformations is shown. ( i =1...5) (11) According to expression (11), is equal to 0 if . A second possi bility is = when . Finally = in the ca se . Similar expression was applied on interviews, as seen below. (j=1...3) (12) On (12) will be equal to 0 if ; and in the same way = when . Finall y = in the case . Numerical results of these on appendix A are provided. 4.6 Calculate assessments The 210 rules that were previously mentioned were implemented in order to calculate the distributed assessments. Doing this on a spr eadsheet might be difficult and time consuming due to the complexit y of the calculations. The Intelligent Decisions S y stems (IDS) package d eveloped by Yan g & Xu (2005) was used for these purposes. This software , which was desig ned based on the evidential reasoning approach, allowed us to obtain the distributed assessments for each ty pe of company (detailed information about the package can be reached on http://www.e- ids.co.uk/ ). Although a total of 168 distributed assessments were obtained on the IDS, only two of them are discussed here due to s pace limitations. Figure 5A il lustrates the assessment for the attribute ― , which also follows the structure presented in formulation (3) with a 5-level scale. Fi gure 5B presents the distribution assessment for the organisational value ― Communication and trust ‖. Note that it follows the structure presented for formulation (6) with a 3-level scale. Although these assessments were calculated for overall performance of th e model, it is feasible to obtai n a tot al of 42 distributed assessments for each type of company. This means that the complete model is composed of 168 different distributed Barahona, Cavazos and Yang 144 assessments. This allows us to preserve richer information regarding e ach t ype of company in order to rank them or provide more accura te evidence which will allow us to make more precise decisions related with the expansion on the use of analy tical tools. Figure 5A . Distrib uted assessment with 5 level scale Figure 5B . Distributed assessment with 3 level scale At this point, we have obtained the assessments; now we must full y im plement the set of rules in order to have our complete model. F or inst ance, if the distribution as sessments presented in figures 5A and 5B are on a 5 -level and 3-level scale, respectively, then they should be transformed to the common scale pre sented in for mulation (8). Finally , a unique dist ributed assessment for the common framework which fit s the structure of the equation (9) should be calculated for each type of organisation. The IDS software was applied to aggregate lo wer le vel att ributes first, and then higher level attributes. Consider the following cases as illustrative explanation: in the case of questionnaires, criteria C (1,1,1) to C (1,1,11) were aggregated in the hi gher level criterion C (1,1). In the case of the interviews, the aggregation of attributes C (2,1,1) to C (2,1,11) resulted in the higher level attribute C (2,1). The last step of the process co nsisted of aggre gating five pairs of distributi on assessments as follows: (1,1) with (2,1); (1,2) with (2,2); (1,3) with (2,3); (1,4) with (2,4); and finally (1,5) with (2,5). The distributed assess ments for the whole model were obtained as follows: Based on thes e distributed assessments, it is clear that large and medium size orga nisations a re more an alytically oriented than micro and small s ize companies. Nevertheless , it is impossible to directly ascertain which type o f organisation is t he most anal y tically oriented. Based on a sli ght difference, either large or medium siz e companies could be the most analytically oriented. In order Wor st Poo r Average Goo d Best M ana ge m en t Sup po rt on da ta Ana ly si s M ana ge m en t Sup po rt on da ta Ana ly si s Eva lu at ion gra des 0.00% 28.37% 57.54% 14.10% 0.00% G1 M inima l G2 Aver ag e G3 Exce llen t Com m unicatio n and trust Com m unicatio n and trust Eva lu at ion gra des 0.00 % 92 .00% 8.00 % Int J Supply Oper Manage ( IJSOM) 145 to more accurately prioritise the organisations inve stigated, we prepare a chart b y first quantif ying the assessments grades and then ca lculating the mean scores by including the 42 attributes of the whole model. This is done for each type of o rganisations. The next figure presents the ranking, based on their overall performance. Figure6 . Ranking o f companies accord ing th eir anal ytical capabilities. According to fi gure 6, the following ranking order for the four types of companies is obtained: Medium Large Small Micro. For purposes of this research, the s ymbol ― ― represents ― is more analytically oriented than ‖. The fore going ranking was calculated assuming that interviews have 60% of the weight and qu estionnaires the remaining 40%. This is coherent with discussions on the literature revi ewed, which sh owed that organisational values have a d eeper impact on the adoption of analytical tools. 5. Concluding remarks This pa per investigates a methodolog y that can be used to model measures for the level of adoption of analytical tool s. Here, are anal y sed two datasets that are different in natur e and collected from dist inct sources. The principal q uestion is how to inte grate data from dif ferent sources but related to the same re search topic into a common fr amework, while preve nting information from being l ost or skewed. Th e knowledge and jud gments of experts should also be systematically and consistently incorpo rated in the proposed common framework in order to y ield richer evidence for making more accurate d ecisions regarding the expansion of the adoption of analytical tools. In order to achieve the above, a set of novel and pragmatic transformation rules were investigated and later implemented in an example. When doing research, it is common to cope with information that comes from different sources but is related to the same topi c. For inst ance, consider the case where data that is received f rom surveys, research literature, interviews, web pages and other sour ces needs to be handled and integrated in order to draw unique conclusions. The richne ss and diversit y of the data should also remain unaltered and retain its original identity. Here, the challenge is to aggregate this data in a systemic, pragmatic and consistent way. The methodology explained here provides researchers Mic ro C ompany Sm all C ompan y Middle compan y Big C ompan y Th e le vel o f a d op tion of a na lytic al to ols Th e le vel o f a d op tion of a na lytic al to ols 0.59 04 0.60 42 0.62 62 0.62 34 Barahona, Cavazos and Yang 146 with a practical, flexible and consistent tool that c an be used to tackle the challenge of aggregating multiple source data. A numer ical example is provided in order to make the methodology easier to understand. Although this case investi gates the aggregation of two datasets, the met hodolog y can be replicated for thr ee or more diff erent t y pes of data, regardless of whether th e data is quantitative or qualitative. A six-step process is provided in this respect as a guideline for practitioners and researchers who are interested in tackling problems with multiple-source data. A specialised software is in troduced to assist them in coping with the comple xity of the calcul ations. In this way, an yone interested can easily desi gn their own models, aggregate multisource data and prioritize alternatives. The primar y purpose of this paper is to demonstr ate the us efulness of this methodology, discuss its most relevant features and provide a numerical example. It is evident that im portant findings related to th e adoption of anal y tical tools were n ot fully explained. Due to the ri chness and diversity of the info rmation obtained, it was not possible to provide a deep and complete discussion here. A careful investigation of the information generated in thi s model will help to identify the most important key drivers that y ield the expansion on the use of analytical tools on organisations. This investigation is subject to further re search. 6. References Amabile, T. M., Co nti, R., Coon, H ., Lazenby, J., & Herron, M. (199 6). Assessing the work environm ent for creativity . Academy of Management Journal, 39 (5), 1154- 1184. Anderson- Cook, C. M., Lu, L., Clark, G., DeHar t, S. P., Hoerl, R., Jones, B., et al. (2012).Sta tistical Engineering- Forming the Foundat ions. Quality Engine ering, 24 (2), 110- 132. Barahona, I., & Riba, A. (2012). Applied Statistics on Business at Spain: A Case of Statistical Engineering. In A. S. Association. (Ed.). In Joint Statistical Meetings [Contribu ted]. San Diego, CA:(Am erican Statistical A ssociation.). Belton, V., & Stewart, T. (200 2). Mult iple Cr iteria Decision Analysis: An Integr ated Approa ch : Springer US. Brans, J.-P., Vincke, P., & Ma reschal, B. (1986) . How to select and how to r ank proj ects: The PROMETHEE m ethod. European journal of oper ational research, 24 (2), 228-238. Cohen, J . ( 1960). A CO EFFI CIEN T OF AGREEMENT FOR NOMIN AL SCALES. Educational and Psychological Measure ment, 20 (1), 37-46. Cronbach, L. J. (1951). COEFFIC IENT ALP HA AND THE IN TERNAL STRUCTURE OF TESTS. Psychometrika, 16 (3), 297-334. Davenport, T. H., Harris, J. G., & Morison, R. (2010). Analy tics at work: smarter decisions, bet ter results . Boston, MA: Harvard Business Press. Deming , W. E. (2000). Out of t he Crisis : MIT press. Fleiss, J. L. (1971). MEASURI NG NOMINAL SCALE AGREEMENT AMONG MANY RATERS. Psychological Bulletin, 76 (5), 378-382. Int J Supply Oper Manage ( IJSOM) 147 Gantz, J., & Reinsel, D. (2012). THE DIGI TAL UNIVERSE IN 2020: Big Data, Bigger Digital Shadows, and Biggest Grow in the Far East. (EMC Corporation). Gardner, R. (2004). The Process- focused Organizat ion: A Transi tion Strategy for Success : ASQ Quality Press. Hayashi, K. (2000). Multicri teria analysis f or agricultural resource management: a critical survey and future perspect ives. European Journal of Operational Researc h, 122 (2), 486-500. Herrmann, A., Huber, F., & Braunstein, C. (2000). Market-driven product and service design: Bridging the gap between cust om er needs, qualit y m anagem ent, and customer sat isfaction. Inter national Journal of Production Economics, 66 (1), 77 - 96. Liu, X.-B., Zhou, M., Yang, J.-B., & Yang, S.-L. (2008). Assessment of strategic R&D proj ects for car manufacturers based on the evidential reasoning appr oach. International Journal of Computati onal Intelligence Sy stems, 1 (1), 24-49. Louviere, J. J., Hensher, D. A., & Swait, J. D. (2000). Stated choice methods: analys is and applications : Cambridg e University Press. Lynch, C. (2008). Big data: How do y our data grow? Nature, 455 (7209), 28-29. Malczewski, J. (1999). GIS and multicr iteria decision anal ysis : John Wiley & Sons. Mendoza, G., & Martins, H. (2006). Multi-criteria decision analysis in natural resource managem ent: a critical review of m ethods and new modelling paradigm s. Forest ecology and management, 230 (1), 1-22. Mendoza, G., & Prabhu, R. (2002). Enhancing participatory planning of community-managed forest using problem structuring models and approaches: experiences f rom a case study : Working Paper GAM – 2003 – 1. Dep. Natural Resour. Environ. Sci., University of Illinois, Champaig n. Mousseau, V., & Slowi nski, R. (19 98). I nferrin g an EL ECTRE TRI m odel fr om as sig nment examples. Journa l of global optimi zation, 12 (2), 157- 174. Mousseau, V., Slowinski, R., & Zielniewicz, P. (2000).A user -oriented implem entation of the ELECTRE- TRI method in tegrating preference elicitation su pport. Computers & operations research, 27 (7), 757-777. Pohekar, S., & Ramachandran, M. (2004).Applicatio n of m ulti-criteria decisio n mak ing to sustainable energy planning — a review. Renewab le and Sustainable Energ y Reviews, 8 (4), 36 5-381. Powell, T. C., & DentMicallef, A. (1997). I nformation technology as competitive advantage: T he role of human, business, a nd technology resources. Strategic Manag ement Journal, 18 (5), 375-405. Predictive analytics (2014). Retrieved 01 of July of 2014, 2014, from http://www .answers.com /topic/predictiv e-analytics Pukk ala, T. (2002). Multi-objective forest planning : Kluwer academ ic publishers. Reynolds, T. J., & Gutm an, J. (1984 ). Laddering: Ext ending the Rep ertory Grid Methodo logy to Construct Attribute-C onsequence-Value Hie rarchies. In in Perso nal Values and Con sumer . (Books). Reynolds, T . J., & Gut man, J. (1988). LADDERI NG THEOR Y, METHOD, AN ALYSIS, AN D INTERPRETA TION. Journal of Adve rtising Resea rch, 28 (1), 11-31. Rousseau, D. M. (2006).Is there such a thing as "evidence-based managem ent"? Academy of Management Review, 31 (2), 25 6-269. Barahona, Cavazos and Yang 148 Roy, B. (1968). Classementetcho ix en présence de points de vue multiples. RAIR O-Operation s Research- RechercheOpération nelle, 2 (V1), 57- 75. Saaty, T. L. (1990). How to mak e a deci sion : the analytic hierarchy process. European journal of operational res earch, 48 (1), 9- 26. Saaty, T. L. (1991). Rank and the Controversy About the Axioms of Utility Theory -- A Comparison of AHP and MAUT. Paper p resented at the Pr oceedings of the 2nd International Symposium of The Analy tic Hierarchy Proces s. Satty, T. L. (1980 ).The anal ytic hierarchy pro cess. (New Y ork: McGraw-Hill New York ). Scott, A. J. (2012). Moneyball: Message for Managers [Marketing paper]. Pennsylvania:(University of Pennsylvania Schol arlyCom mons ). Shrout, P. E., & Fleiss, J. L. (1979). INTRACLA SS CORRELATIONS - USES IN ASSESSING RATER RELIABI LITY. Psychological Bu lletin, 86 (2), 420- 428. Schwartz, S. H. (1994). Are there universal aspects in the structure an d con tents of human values?. Journal of social issues, 50(4), 19- 45. Tallon, P. P., Kraem er, K. L., & Gurbaxani, V. (2000). Execut ives' perceptions of the busine ss value of information technology: A process -oriented approach. Journal of Management Information Systems, 16 (4), 145-173. Tzeng, G. -H ., & Huang, J. -J. (2011). Mul tiple attribute decision making: methods and application s : CRC Press. Xu, D.- L., McCarthy, G., & Yang, J. - B. (2006) . Intelligent decision system and its application in business in novation s elf assessm ent. Decision Support Syst ems, 42 (2), 664- 673. Yang, J., & Xu, D. (2005). The IDS multi-criteria asse ssor software. Intelligen t Decision System, Cheshi re, UK . Yang, J .-B., & Singh, M. G. (1994). An ev idential reasoning approach for m ul tiple-attribute decis ion making with uncertainty. Systems, Man and C ybernet ics, IEEE Trans actions on, 24 (1), 1- 18. Yang, J. B. ( 2001). Rule and utility based ev idential reasoning approach for multiattribute dec ision analysis under un certainties . European Journal of Op erational Resea rch, 131 (1), 31- 61. Yang, J . B., Xu, D. L., X ie, X ., & Maddulapalli, A. K. (2011). Multicriteria evidential reasoning decision modelling and a nalysis-prioritizing voices of customer. Journal o f the Ope rational Research Society, 62 (9), 1638-1654. Yoon, K. P., & Hwang , C.-L. (1995). Multiple attribute decision making: an introdu ction (Vol. 104): Sage Publication s. Int J Supply Oper Manage ( IJSOM) 149 Appendix. Bottom level attributes. Interviews. Count Concept Frequency % relative mean minimal average excellent O-A 1 Data is accessible and suppo rts decisions 20.00 0.20 3.00 1.00 O-A 2 Data online supports dec isions 15.00 0.15 2.25 0.75 0.25 O-A 3 Goal setting 13.00 0.13 1.95 0.05 0.95 O-A 4 Standardized pr ocedures 11.00 0.11 1.65 0.35 0.65 O-A 5 high skilled staff 8.00 0.08 1.20 0.80 0.20 O-A 6 Enough support 7.00 0.07 1.05 0.95 0.05 O-A 7 High tech 6.00 0.06 0.90 1.00 O-A 8 Communication with c ustomers and suppliers 5.00 0.05 0.75 1.00 O-A 9 Creativity to propo se new ideas 5.00 0.05 0.75 1.00 O-A 10 Information outside the orga nization 5.00 0.05 0.75 1.00 O-A 11 Market research 5.00 0.05 0.75 1.00 T-A 1 Improving data analysis 22.00 0.22 3.00 1.00 T-A 2 Improving results 17.00 0.17 2.32 0.68 0.32 T-A 3 Financial benefits 15.00 0.15 2.05 0.95 0.05 T-A 4 Staff efficiency and motiva tion 12.00 0.12 1.64 0.36 0.64 T-A 5 Exceeding the customer expec tations 7.00 0.07 0.95 1.00 T-A 6 Improving processes 7.00 0.07 0.95 1.00 T-A 7 Knowledge of data 7.00 0.07 0.95 1.00 T-A 8 Long term relationships with actors 7.00 0.07 0.95 1.00 T-A 9 Distinctive co mpetence 6.00 0.06 0.82 1.00 O-V 1 Add value to stake holder s 13.00 0.24 3.00 1.00 O-V 2 Serving the society 12.00 0.22 2.77 0.23 0.77 O-V 3 Passion, Quality and Excelle nce 11.00 0.20 2.54 0.46 0.54 O-V 4 Being a leader 9.00 0.17 2.08 0.92 0.08 O-V 5 Communication and tr ust 9.00 0.17 2.08 0.92 0.08 O-V Organizational v alues T-A Tactical attribute s O-A Operative attribu tes Barahona, Cavazos and Yang 150 Questionnaires. Bottom level at tributes. Q uestionnaires Int J Supply Oper Manage ( IJSOM) 151
Original Paper
Loading high-quality paper...
Comments & Academic Discussion
Loading comments...
Leave a Comment