Undermining and Strengthening Social Networks through Network Modification
Social networks have well documented effects at the individual and aggregate level. Consequently it is often useful to understand how an attempt to influence a network will change its structure and consequently achieve other goals. We develop a frame…
Authors: Jonathan Mellon, Jordan Yoder, Daniel Evans
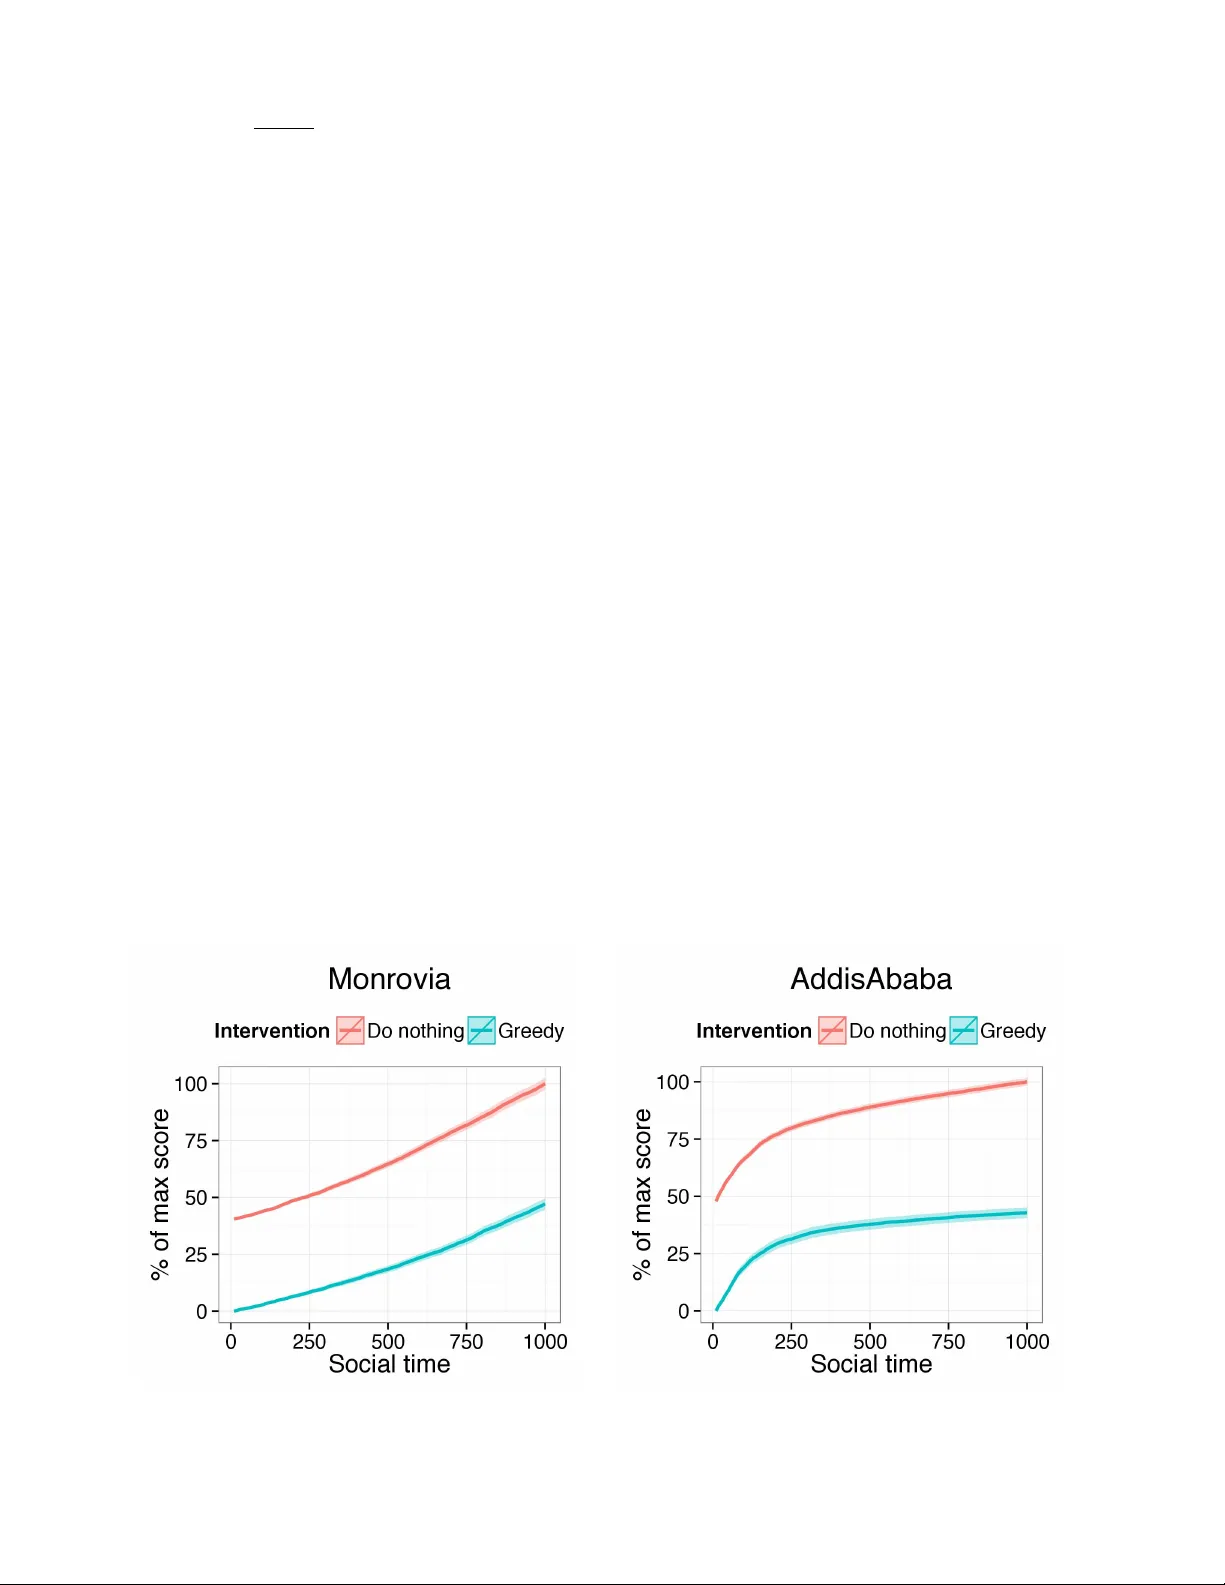
Undermining and Strengthening Social Netw orks thr ough Netw ork Modification Jonathan Mellon 1,2 , Jordan Y oder 1,3,* , and Daniel Evans 1 1 Network Science Center , United States Military Academy , W est P oint, NY 2 Nuffield College, Univ ersity of Oxf ord, Oxford, United Kingdom 3 Applied Mathematics & Statistics, The Johns Hopkins Univ ersity , Baltimore, MD * Corresponding author : jyoder6@jhu.edu ABSTRA CT Social networks have well documented effects at the individual and aggregate le vel. Consequently it is often useful to understand ho w an attempt to influence a network will change its structure and consequently achie ve other goals . W e de velop a frame work for network modification that allows for arbitrary objective functions, types of modification (e.g. edge weight addition, edge weight remov al, node remov al, and cov ariate value change), and reco very mechanisms (i.e. how a network responds to inter v entions). The framework outlined in this paper helps both to situate the existing w ork on network inter ventions b ut also opens up many new possibilities f or inter v ening in networks. In par ticular use two case studies to highlight the potential impact of empirically calibrating the objective function and network reco very mechanisms as well as showing ho w inter v entions bey ond node remov al can be optimised. First, we simulate an optimal remo val of nodes from the Noordin terrorist network in order to reduce the expected number of attacks (based on empirically predicting the terrorist collaboration network from multiple types of network ties). Second, we simulate optimally strengthening ties within entrepreneurial ecosystems in six dev eloping countries. In both cases we estimate ERGM models to simulate ho w a network will endogenously ev olve after intervention. 1 Intr oduction An e ver increasing number of studies ha ve documented ho w individuals’ beha vior is influenced by their social context. Network structure has been linked to individual and collective outcomes in contexts including criminal networks, 1 – 3 workplaces, 4 – 7 classrooms 8 – 10 and industries. 11 – 13 Giv en the effect that netw ork structures have on outcomes, it is often useful to understand how attempting to externally influence a network is lik ely to change its structure and whether an attempted intervention will achiev e its goals. Most of the work on intervening in netw orks has focused on two v ersions of the key player problem: 1) which nodes to remov e in order to minimize network cohesion (KPP-NEG) and 2) which nodes to use as seeds to maximize diffusion in a network (KPP-POS). 14 While these problems ha ve important applications, we ar gue that they are part of a more general class of network interv ention problems that can be cate gorized according to their outcome metric, intervention strategy and the response of the network to the intervention. W e outline a general frame work for network modification that allo ws for arbitrary objecti ve functions, types of modification (e.g. edge weight addition, edge weight remov al, node remov al, and co variate v alue change), and reco very mechanisms (i.e. how the netw ork responds to interventions). W e show ho w existing work fits into this framew ork and how variations within the framew ork can lead to new applications for these techniques and alternate solutions to e xisting applications. Many problems in this wider frame work ha ve not been deeply studied. In particular , strategies that in v olve modifying ties rather than nodes of a network hav e receiv ed relativ ely little attention. This is despite the fact that many potential interv entions in a network hav e effects at the tie level (e.g. assigning people to work together or signing agreements) rather than the node le vel. Similarly , most studies hav e not focused on ho w a network will respond to an interv ention. This is a potentially important ov ersight given that a recent study suggested that network response to interventions would render most interv entions ineffecti ve. 15 Finally , there has been little work on defining outcome metrics empirically in terms of how the y affect ultimate objectiv es such as terrorist attacks, lev el of drug supply , or student outcomes. In this paper , we seek to org anize the various strategies for network modification in a singular framework. Then, we demonstrate the use of this frame work in tw o case studies on real world data to model ho w objectiv e function and recov ery mechanisms can be empirically deri ved from the problem–rather than being posited on theoretical grounds–and sho w an applied example of optimizing edge weight additions. First, we look at the case of the Noordin terrorist group. Rather than defining the metric function a-priori, we empirically calibrate it by using the observed network to predict a terrorist collaboration network using a multiple regression quadratic assignment procedure model (MRQAP). The predictions from this model then form the basis of the metric function that we try to reduce. W e also show how the network is likely to ev olve in response to such an intervention using an exponential random graph model fitted to the initial network as a network reco very algorithm. Second, we look at networks of roles in the entrepreneurial ecosystems across six cities in dev eloping countries. W e use this case study to demonstrate how the frame work can be applied to interventions in volving strengthening ties, where the aim is to make the network perform more effecti vely . In this case, we look at what ties we would try to strengthen in the poorly performing ecosystems to make them more similar to the best performing ecosystem (of the six studied): Accra in Ghana. Finally , we conclude with a discussion of further possible applications and modifications to the framew ork in the paper . 2 Methods The network modification framework has four components: an outcome metric, a strategy , an optimization approach, and a network e volution mechanism. The outcome metric, strategy , and e volution mechanism constitute the problem, while the optimization approach is the solution. The methodology can be summarized as: 1. Begin with an initial network (weighted or binary adjacency matrix) and a metric function to be minimized as determined by the goal of the modification 2. Propose changes of a selected type (e.g. node remov al) to the initial network. 3. Optimize choices of changes (within specified constraints such as a budget) according to an optimization method 4. Assess the extent to which network interv entions will persist by simulating endogenous ev olution of the network 2.1 Choosing a metric function Generally , one who desires a network to change has a preferred outcome. Graph metric functions (which are not necessarily mathematical metric distance functions) are objectives that seek to capture this preferred outcome in quantitative terms. In this paper , we call a network a pair of sets G = ( V , E ) , where G is the network, V is a set of nodes, and E is a set of edges. W e define a graph metric function to a be function f : G → R , where G is the set of all networks. Lower v alues of the function f are more desirable.Choosing a metric function is a task that should be specific to the actual application. Some pre vious work on network modification has focused on network features (such as centrality or brok erage statistics) themselves with the implicit assumption that these will further an ultimate goal. 16 In other work, a link to an ultimate goal is made more explicit. For instance, the KPP-NEG approach aims to leav e the network with the least possible cohesion. 14 Another explicit optimization criteria was set forth in, 17 where they use information theory to formulate an objecti ve function. Also, Duijin et al. 15 use a custom ef ficiency measure. Ho wev er , in this case, the measure is problematic as it typically attains worse v alues when members of a network are removed, e ven in the absence of a network recovery mechanism. In fact, the measure will be worst when there are no members of the network remaining. It is therefore implausible that this statistic is a useful measure of a criminal netw ork’ s ef fectiv eness. This strange beha vior (removing nodes impro ves the ef ficiency of the network) will likely not hold in practice. Due to this discrepancy , improving the chosen graph metric could end up giving v ery suboptimal results. One approach that has not been pre viously taken is to empirically tie the objecti ve function to an ultimate objecti ve. For example, ”the predicted cocaine production of the network” is a quantitati ve measure of the ef ficiency of the network that we might wish to disrupt. W e suggest calibrating the metric against that outcome empirically . For instance, we could look at what network structures predict an outcome such as total drugs produced by a criminal network, overall student attainment in a high school, or total sales in a department. By empirically predicting an ultimate outcome, we can simultaneously combine multiple network statistics or e ven networks themselv es into a quantitativ e measure demonstrably associated with the desired outcome. 2.2 Choosing Allowable T ypes of Chang es There are many dif ferent types of interventions that it is possible to make to a network. Howe ver , these can be summarized into fiv e categories: node removal, node addition, tie weight addition, tie weight remo val, and node co variate change. The most common type of interv ention in the literature has been node remo val, particularly in terms of disrupting either the network itself 14 , 15 , 17 or contagion through a netw ork 18 ). After this, the ne xt most common form of intervention is node cov ariate change. The KPP-POS problem can be formulated in terms of optimizing co v ariate change. From this perspectiv e, we optimize a metric of “reachability from tagged nodes” through the strategy of choosing which nodes to tag (i.e. changing a 2/ 13 node’ s co variate v alue of being tagged). Howe ver , co variate change could be optimized in many other w ays. For instance, if a network has a tendenc y to form homophilous ties, changing a co variate v alue could be an ef fecti ve way of reorganizing the network structure itself. After node remov al, edge modification is the next natural choice. Howe v er , it has been studied much less thoroughly . Edge deletion has been a focus of previous research in this area. 19 set forth a method in which edges are deleted, then a network property is recalculated in order to assess a particular edge’ s importance to the network. 20 used a similar idea more recently to study bridging measures. There has been little work so far considering the problem of how to optimize str engthening edges or adding nodes into a network. T able 1 shows ho w various forms of network interventions could work in applied contexts. Although moving a child to a dif ferent classroom, firing an employee, and arresting a criminal appear to be v ery different substantiv ely , the y are fundamentally the same from a network perspecti ve. The potential applications are almost limitless but could include making strategic hires in academic departments based on citation networks, decreasing segre gation in classrooms and making alliance decisions to maximize trade. As well as defining what types of changes to the network will be considered, we also need to define the constraints on what changes can be made. The simplest case of this is a b udget that limits the number of changes that can be made. Howe ver , a more complex set of constraints is also possible (e.g. add a maximum of 50 total edge weight, with no more than 10 going to a single edge). In this case it would also be possible to assign dif ferent costs to different changes (e.g. removing node v 1 from the network costs 5 but node v 2 only costs 2 to remove). The examples in this paper only consider the case of a simple budget of X changes of a single type. This b udget can be viewed in terms of time, money or simply the social limits of ho w much change can be achiev ed by an intervener . 2.3 Optimization Method Consider the problem min G ∈ G f ( G ) subject to zero or more constraints. For most graph metric functions, this discrete problem will be quite challenging. General purpose discrete optimization strategies generally re volv e around approximation guarantees or heuristics. W e use tw o optimization strate gies in this paper . The simplest strate gy is e xhaustiv e search, where all possible combinations of node remov als are considered and rated. This method is guaranteed to reach the optimal solution for a discrete optimization problem because ev ery solution is considered. For the same reason, it is completely impossible to implement on graphs of large size. The other methodology we focus on in this paper is greedy optimization. Greedy algorithms are designed around the greedy heuristic, where the locally optimal choice is made at each step. Sometimes, this will lead to poor results. Other times, it works well enough. In both cases, using a greedy heuristic can be a massiv e speedup ov er brute force techniques such as exhaustiv e search or dynamic programming. Due to the inherent hardness of discrete optimization on graphs in general, it is no surprise that the greedy heuristic has been used recently for graph modification purposes. 14 , 17 , 20 There are classes of problems (greediods) for which a greedy algorithm is prov ably optimal, 21 , 22 ho wev er e ven the relati vely simple outcome measure in this paper is not one of these problems. Figure 1 sho ws an example of a network where the greedy algorithm will choose to remove nodes i and j rather than the optimal set of j and k . Such counterexamples can be generated using linear programming to find edge weight combinations that will mislead a greedy algorithm. Nev ertheless, greedy optimization will find a good or ev en optimal solution in many real network modification e xamples. 2.4 Simulating endogenous network c hange The final step of the framework is to consider how the network will respond to an intervention. Most studies omit this step entirely, 14 , 23 implicitly assuming that the network will not change in response to the change. Howe ver , a few studies have included this e xtra step. Recently , Duijin et al. 15 conducted a detailed reco very study by specifying se veral possible mechanisms through which a network might recover . Unfortunately , their recov ery mechanisms are somewhat unrealistic as they essentially in volv e adding random ties into the netw ork and ignore the existing structure and what mechanisms were lik ely present that generated it originally . In, 24 they use game theoretic considerations for reco very mechanisms. Rather than specifying a netw ork reco very algorithm a priori , we empirically calculate a mechanism by using an e xponential random graph model (ERGM) to calibrate an underlying generati ve process within the network. This means that we assume that there is an underlying process that creates the structure within a network and that this mechanism will continue after an intervention takes place. This assumes that an intervention is able to affect the strength of ties in a netw ork but does not directly change the underlying social processes within the network. Because we use weighted networks, it may be useful to revisit the notations of ERGMs to account for this. For a more rigorous construction, see. 25 Consider the adjacency matrix of a netw ork as a random v ariable Y , where Y i , j is a non-negati ve random v ariable representing the weight of the tie between v ertices i and j . T ies are hypothesized to depend on one or more statistics of a giv en configuration of the networks: s ( A ) , where A is a realization of Y and s is possibly vector v alued. There is a 3/ 13 Figure 1. An example of a network where greedy optimization will not find the optimal solution. Note that all ties can be remov ed if j and k are remov ed but that i has the most edge weight in the first round. parameter , θ , which is also possibly vector valued that is estimated as part of the fitting process. Finally , we specify a reference measure h ( A ) which can loosely be interpreted to giv e the prior probability of a giv en configuration A . Putting it all together , P ( Y = y ) = h ( y ) exp θ T s ( y ) ∑ A h ( A ) exp ( θ T s ( A )) . 3 Case Study 1: Noordin T o demonstrate empirically calibrating an objecti ve function we apply our framew ork to a dataset of relationships in the Indonesian Noordin terrorist group. The Noordin dataset was constructed 16 based on a 2006 International Crisis Group report on Noordin Mohammed T op’ s terrorist network in Indonesia. 26 Noordin was in v olved in the 2002 Bali bombing and the 2003 bombing of the Marriot hotel in Jakarta, as well as sev eral later attacks. The dataset contains extensi ve information about 79 terrorists and their connections to each other both in terms of one-mode networks (communication and friendship) and two-mode netw orks (joint membership of a mosque or terrorist organization). Importantly , the dataset also includes information on which terrorists were directly inv olved in each attack. This allows us to create a collaboration network of terrorists that shows whether the y are jointly in volv ed in an attack. The Noordin dataset has pre viously been used to examine netw ork disruption. Howe ver , pre vious analyses ha ve tak en a heuristic approach to disruption by comparing the implications of adopting kinetic and non-kinetic disruption strategies 16 and examining the network’ s topography. 23 3.1 Noordin: Graph Metric Disruption of a terrorist network is conducted primarily for the purpose of reducing the effecti veness of a terrorist network. W e therefore choose an outcome measure that is directly related to this. W e define a terrorist network’ s effecti veness in terms of the number of attacks that terrorists collaborate on. Six terrorist attacks in the Noordin dataset inv olve multiple terrorists. W e can therefore create a terrorist attack collaboration netw ork that shows which terrori sts were co-in volv ed in different attacks. W e normalize this network so that each attack contributes a total of 1 edge weight. Since, we would like to disrupt a network prior to attacks taking place, we aim to reduce the number of expected attacks from a network. W e therefore use the other ways in which terrorist are related: communication ties, organizational ties and educational ties to predict which terrorists are most likely to collaborate with each other . W e therefore aim to optimize the total predicted edge weight of the terrorist collaboration network based on a MRQAP model using communication, or ganizational and educational ties. Because of the normalization of edges, this metric corresponds to the expected number of attacks by the network. The MRQAP metric also has an another appealing property: because all the coefficients are positi ve, remo ving a terrorist will never increase the expected number of terrorist collaborations (in the absence of network recov ery). W e use a quasi-likelihood method with a log-link using the glm() function in R and the quasipoisson family . That is, we model log ( µ ) = β 0 + β 1 x 1 + · · · + β q x q , for some scalars to be fit β i and independent variables x i . Further , if Y is our response variable, we assume E [ Y ] = µ . The “quasipoisson” family assumes that Var ( Y ) = φ µ for some scaling parameter φ , which is not necessarily unity . Note that nothing 4/ 13 about these assumptions implies that the response v ariable need be discrete. The parameters are fitted using quasi-maximum likelihood (QMLE). The usual calculations for standard errors are biased because of autocorrelation within rows and columns of an adjacenc y matrix. The MRQAP approach calculates p-values through a permutation test that uses the dataset to assess how often the estimated t-statistic would hav e been greater than the observed t-statistic under a simulated null hypothesis. In order to account for the dependency within ro ws and columns, the permutations simultaneously permute the labels for rows and columns. This maintains the same dependenc y structure within individuals in the dataset b ut still giv es us an estimate of the natural v ariance in the data. W e use the double semi-partialling approach. 27 This has been sho wn to be the permutation approach that most reliably approximates the correct type I error rate, while retaining good power . The results from a MRQAP model are read like a GLM table, with the parameters showing ho w a one unit change in the independent variable changes the log of the expectation of the dependent variable, and the p-v alue showing us how often we would e xpect to see a parameter of this magnitude under the null hypothesis. W e find that three factors are strong predictors of terrorist coll aboration in the Noordin network: communication, educational ties and organizational ties. While the variance e xplained in the MRQAP model is moderate (mostly due to the sparsity of the collaboration network), b ut it still represents a substantial impro vement o ver pre vious network metrics, which ha ve not been demonstrated to be correlated with important outcomes at all. All three netw orks are positi vely related to terrorist collaborations, but only the communication and education netw orks reach significance as we can see in table 4 . W ith the regressions complete, we formulate the objective function. For a given node set that has been selected for remov al, say R , our metric function is (up to a constant), f ( R ) = ∑ i , j : i < j E [ Y i , j ] χ { i , j 6∈ R } , where χ A : = ( 1 if A 0 else is the indicator function for ev ent A. 3.2 Noordin: Allowable Changes As with most pre vious analyses of dark networks, we focus on node remov al. While other modifications may be possible (sowing dissent between factions or introducing undercov er agents for instance), node removal is the most realistic intervention that outsiders can make to a terrorist network by arresting members of the group. While our model assumes that the intervener has some ability to affect the network structure, we assume that this ability is not limitless. As a result, we reflect their options through an intervention b udget of changes they can mak e. For this paper , we assume that one b udget unit corresponds to the ability to remove one node from the network. For the e xperiments in this paper we use an intervention budget of 5 and 15. This constitutes a modest intervention in the network, which contains a total of 79 nodes. 3.3 Noordin: Optimization strategies As pre viously mentioned, we focus on greedy optimization, where 1 node is considered at a time for remov al. The node reducing the graph metric the most is remov ed. Then, all remaining nodes are considered again for removal. This is considerably faster than the exhausti ve search, which looks at all subsets of nodes of size no more than the budget. For a b udget of 5 remov als, this is plausible to run, but for 15 remov als, we estimate that the algorithm would take around 3.2 years to run. Further work on the algorithm and distrib uting the computation would substantially reduce this time, but the general observ ation that exhausti ve search becomes rapidly intractable with larger numbers of decisions undoubtedly remains. 3.4 Noordin: Endog eneous Network Change mechanism W e fit a simple ERGM using the co variates a v ailable. W e model the communication network as a function of the number of edges, number of isolates, geometrically weighted edge wise shared partner distribution, and as dependent on other networks. That is, we consider the organizational and educational networks as exogenous within the timeframe we are examining. Future work could look at co-e v olution models which w ould allow both communication and org anizational networks to ev olve together . Howe ver , this is beyond the scope of this paper . T o model the dependency of the Noordin communication network on other networks between these individuals, we include the sum of each of the following co variate v alues in the network in the ERGM: organizational co-af filiation, shared educational background, friendship, kin and religious co-af filiation (for instance sharing a mosque). A separate statistic is included in the ERGM equation for each of these dyadic cov ariate networks. The statistic for each is the sum of the cov ariate v alues across dyads that hav e a communication tie present. In addition to these networks, we also model the communication endogenously 5/ 13 with se veral structural ef fects. The simplest of these is simply the netw ork’ s ties, which we sum across the whole network in the edges statistic. Additionally , we include the number of isolates as a statistic in the ERGM equation. W e also model triadic closure by including the geometrically weighted edgewise shared partner (GWESP) distrib ution, defined as: w = e α n − 2 ∑ i = 1 { 1 − ( 1 − e − α ) i } p i , (1) where p i is the number of pairs of actors who are connected with a tie and are tied to exactly i of the same actors, n is the total number of actors in the netw ork and α is a constant that controls ho w much more weight pairs of actors with man y acquaintances in common are giv en in the statistic. For instance, when α = 0 . 5 a pair of actors with one acquaintance in common recei ve a weight of 0.61 and a pair of actors with tw o acquaintances in common receiv e a weight of 0.85 and a pair with 5 joint acquaintances receiv es 0.99. When α = 0 . 25 , these weights are 0.78, 0.95, and 1. When α = 0 , these pairs are all giv en the same weight of 1. Follo wing, 28 we set α = 0 . 25. The ERGM results in table 2 sho w that the terrorist communication network can be modeled as arising from the or ga- nizational co-affiliation, friendship, kin and religion networks. Interestingly , the shared education network doesn’t predict communication ties after accounting for these other networks. As expected, the GWESP statistics sho w that the communication network has a strong tendency to wards closing triads. 3.5 Noordin: Experiment results T o summarize the previous sections, we estimate the total number of attacks as the sum of the upper triangular of matrix E [ Y ] (since all cov ariate networks are and will be symmetric, we can cut e verything b ut the upper triangle). W e will allow remo val of nodes. Here, we maintain the size of the networks by zeroing all covariates to indicate that an inexperienced, unconnected replacement has been found. This is slightly generous tow ards the terrorists, as it implies that their recruitment team is very responsiv e to forced downsizing. These inexperienced terrorists contrib ute a mere 1 . 33 e − 3 attacks in expectation each. W e run our greedy algorithm with a budget of 15 remov als considered one at a time. For comparison, we performed an exhausti ve search for 5 remo vals. W e compare the results from the greedy algorithm to the natural heuristic of removing the most influential actors (as determined by degree), which has been used in pre vious studies of network disruption. 15 , 16 W e use the fitted ERGM to simulate ho w the metric will degrade (reco ver) o ver time after performing remo val using the greedy and heuristic strategies at either 5 or 15 remov als (cf. Figure 2 ). The heuristic algorithm improv es the metric, but lags behind the greedy algorithm after the first few remov als. Because the run-time of the greedy algorithm was less than two seconds, we do not consider this a large consideration when choosing between algorithms. Using the trained ERGM, we simulate the ev olution of the modified networks resulting from the removals of nodes as suggested by each strategy . W e observ e that the greedy method performs the best both initially and across the full 100 steps of social time that the ERGM runs (on a verage across 1000 sampled paths) (cf. Figure 3 ). This shows that greedy optimization both outperforms the heuristic approach and maintains that performance after the network endogenously recov ers. 4 Case Study 2: Strengthening Economic Networks in the EntrepEco Dataset In a recent technical report, 29 introduces the EntrepEco (Entrepreneurial Ecosystems) Dataset. Six cities with burgeoning economic networks were studied (Addis Ababa, Dar es Salaam, Monrovia, Lusaka, Accra, and Kampala). Entrepreneurs were surve yed through snowball sampling about which of 13 types of resources they would ask for help gi ven a particular problem (self, gov ernment representativ e, government business de velopment, incubator , NGO, in v estor , family , religious, social network, bank, professional, military , and education). Then, a bipartite network for each city is created with links between entrepreneurs and the resources. W e use a modified version of the EntrepEco Dataset in which we excluded responses that in volv ed “self, ” as self has a dif ferent meaning depending on the conte xt, which would complicate the next step if not accounted for . Thus, our bipartite graphs included 12 roles. This bipartite network was then forced into a weighted unimodal network by connecting resources with a common entrepreneur . W e identified Accra as the most vibrant network of all the cities studied. This is based on our experience, and sev eral articles corroborate this (cf. 30 , 31 ). Thus, we now attempt to modify the netw orks of the other cities to be more like Accra’ s. 4.1 EntrepEco: Graph Metric Because Accra was identified as the strongest entrepreneurial network, we want to maximize the similarity to that network. W e can capture that desire in a graph metric function: if A ( j ) is the adjacency matrix for the j t h city , we used the neg ative cosine similarity between A ( j ) and A ( Accra ) : f ( A ( j ) ; A ( Accra ) ) = 1 − ∑ i , k A ( j ) i , k ∗ A ( Accra ) i , k k A ( j ) k F k A ( Accra ) F , 6/ 13 0 5 10 15 4.5 5.0 5.5 6.0 change Expected number of attacks Greedy Heuristic Figure 2. The number of expected attacks as a function of total remo vals allo wed for the greedy and a heuristic algorithm. 20 40 60 80 100 3.5 4.0 4.5 5.0 5.5 6.0 6.5 Social Time vs. Expected Number of Attacks Social Time Expected Number of Attacks 20 40 60 80 100 3.5 4.0 4.5 5.0 5.5 6.0 6.5 Social Time vs. Expected Number of Attacks Social Time Expected Number of Attacks 20 40 60 80 100 3.5 4.0 4.5 5.0 5.5 6.0 6.5 Social Time vs. Expected Number of Attacks Social Time Expected Number of Attacks 20 40 60 80 100 3.5 4.0 4.5 5.0 5.5 6.0 6.5 Social Time vs. Expected Number of Attacks Social Time Expected Number of Attacks 20 40 60 80 100 3.5 4.0 4.5 5.0 5.5 6.0 6.5 Social Time vs. Expected Number of Attacks Social Time Expected Number of Attacks nothing greedy 5 greedy 15 heuristic 5 heuristic 15 Figure 3. The simulated number of expected attacks as a function of social time. Lower is better . Observe that the greedy strategy consistently outperforms the heuristic strate gy . 7/ 13 where k A k F = q ∑ i , k A 2 i , k is the Frobenius norm of A . 4.2 EntrepEco: Allowable Changes Unlike the Noordin case study , removing nodes is not a practical form of intervention when considering roles in an en- trepreneurial ecosystem. Ho wev er , it may be within the po wer of a decision mak er to strengthen links between certain roles, for instance through subsidizing joint inv estments or facilitating meetings. For the experiments in this section we use an intervention b udget of 50. This constitutes a substantial intervention in these cities (around a quarter of the existing total edge weight for each of these cases). 4.3 EntrepEco: Optimization Method As with the first case study , we use greedy optimization to try to find the set of changes to edges that minimizes the distance between the starting network and the tar get network of Accra. 4.4 EntrepEco: Endogenous Evolution Mechanism As with the first case study , we use ERGM models to simulate the network recov ery process. W e fit separate weighted ERGMs to each city , to model the underlying processes generating its network structure. W e include ef fects for non-zero edges, the sum of edge weights, total edges and the transitiv e weights which captures triadic closure. 4.5 EntrepEco: Experimental Results T able 3 shows the distribution of edge weights that the algorithm gi ves to each edge for the other five entrepreneurial netw orks. In the two cities that were pre viously identified as most different from Accra, Addis Ababa and Monrovia, the algorithm spends its entire intervention b udget on boosting the social network/professional/incubator role triad. In the other cases, the algorithm tends to focus on ties in v olving incubators, in vestors, social networks and professionals (with the one exception of Kampala where a small amount of edge weight is assigned to increasing the strength of the gov ernment representativ e-social network tie). In Figure 4 , we present a line plot of the av erage ev olution of the v alues of the graph metric functions across 1000 Monte Carlo replicates using the fitted ERGM models to simulate the evolution of the Monrovia and Addis Ababa networks after intervention. Recall that lower v alues are preferred. Greedy selection greatly improves the network interv ention effecti veness compared with doing nothing or picking the best random dra w . The performance of all strategies degrades with time, as the endogenous network processes mov e the network a way from the modified network. For comparison, we included doing nothing as an alternati ve strategy . W e scaled the y-axis so they would alw ays be on a 0-1 scale. Lower is better . Error shading is ± 2 standard deviations on the 0-1 scale, computing across Monte Carlo replicates. W e did not include the other cities, as the plots look very similar . Figure 4. A verage optimization score for Monrovia (a) and Addis Ababa (b) across 1000 Monte Carlo Replicates for the ev olution of the random metric of the proposed network originating from two methods: blue is do nothing and red is greedy . 8/ 13 In Figure 5 , we see how the percentage impro vement of the greedy strate gy as compared to doing nothing changes ov er time for all fi ve cities. Error shading is ± 2 standard de viations as computed in a two-sample z-test with dif ferent population variances. It is interesting to note that some cities hav e increasing relati ve improv ement over time and others hav e decreasing relativ e improv ement over time. This indicates that the endogenous change mechanism, which is calibrated to each city , can rew ard specific changes more than others over time. Figure 5. A verage percentage improv ement (in terms of similarity to Accra) over doing nothing as simulated through the ev olution of 1000 draws from an ERGM model track ed through 1000 units of social time. 4.6 EntrepEco: Interpretation If policy makers are interested in making the network of connections in entrepreneurial systems more like Accra’ s, the key finding from this study is that they should boost the connections between professionals, entrepreneur’ s personal networks, and startup incubators and in some cases also increasing the links between these actors and in vestors. There are many possible policy approaches that could be taken to achie ve this. Perhaps one of the most effecti ve approaches would simply be to disseminate these findings to startup incubators. Since startup incubators benefit directly from a vibrant entrepreneurial ecosystem, it would be in their self interest to promote entrepreneur’ s connections with professionals and the entrepreneur’ s social networks. Gov ernment could also take more direct action by using tax incentives to encourage startup incubators to focus on startups that hav e the help of professionals and are supported by an entrepreneur’ s social network. Refining these types of policy proposals will require further data collection. In future work with more cases , we will empirically calibrate combinations of metrics by using them to predict ecosystem le vel outcomes (e.g. % of companies surviving past 1 year , total firms in market, market capitalization, rate of gro wth etc). This is an important additional step, as the structure of Accra’ s netw orks is not necessarily the cause of its success as an ecosystem. 5 Discussion The framew ork outlined in this paper helps both to situate the existing work on netw ork interventions but also opens up man y new possibilities for interv ening in networks. Through the tools of optimization, a network can potentially be changed in order to promote any goal that has a connection to the structure of a network. Our applied examples show that this approach can improv e on previous approaches to disrupting networks b ut also that it can be used to help understand interventions that could improv e networks such as to guide policy in de veloping markets. 9/ 13 While this frame work takes account of more f actors than previous netw ork intervention methods, it will only perform as well as its components. For instance, if data on the network structure is incorrect or if the netw ork recovery mechanism does not include important parameters, then the algorithm is likely to suggest suboptimal interventions. It is therefore important for future research to focus on careful data collection and careful empirical study of how netw orks respond to interventions. In addition to the v ariants we hav e discussed in the paper , there are se veral other things future work should consider . W e currently only consider a single strategy at a time (e.g. just removing nodes or just adding edge weight), howe ver , the approach can be extended to a mixed strategy by assigning relativ e costs to each action within an overall budget or ha ving separate budgets for each type of action. This approach is likely to be most useful in cases where multiple types of action are plausible (for instance in work environments where a manager could assign employees to work together , fire an employee or change an employee’ s job title). Similarly , dif ferent actions could be assigned separates costs if, for instance, Noordin T op is hard to remov e than one of his foot soldiers. Future work should also continue to e xpand on empirically calibrating metrics to the ultimate outcomes we are interested in. MRQAP models are one tool for this, but an y model that can link network structure to ov erall outcomes could be used. References 1. Morselli, C. Crime and Networks (Routledge, 2014). 2. Scott, J. & Carrington, P . J. The SA GE Handbook of Social Network Analysis (SA GE publications, 2011). 3. Pyrooz, D., Sweeten, G. & Piquero, A. Continuity and change in gang membership and gang embeddedness. J ournal of Resear ch in Crime and Delinquency 50 , 239–271 (2013). 4. Tsang, S.-S., Chen, T .-Y ., W ang, S.-F . & T ai, H.-L. Nursing work stress: the impacts of social network structure and organizational citizenship beha vior . J ournal of Nursing Resear ch 20 , 9–18 (2012). 5. Jokisaari, M. The role of leader–member and social network relations in newcomers’ role performance. Journal of V ocational Behavior 82 , 96–104 (2013). 6. Zou, X. & Ingram, P . Bonds and boundaries: Network structure, organizational boundaries, and job performance. Or ganizational behavior and human decision pr ocesses 120 , 98–109 (2013). 7. V enkataramani, V ., Labianca, G. J. & Grosser , T . Positive and negati ve w orkplace relationships, social satisfaction, and organizational attachment. J ournal of applied psychology 98 , 1028 (2013). 8. Russo, T . C. & K oesten, J. Prestige, centrality , and learning: A social network analysis of an online class. Communication Education 54 , 254–261 (2005). 9. Huitsing, G., V eenstra, R., Sainio, M. & Salmi valli, C. “it must be me” or “it could be them?”: The impact of the social network position of b ullies and victims on victims’ adjustment. Social Networks 34 , 379–386 (2012). 10. Lomi, A., Snijders, T . A., Ste glich, C. E. & T orl ´ o, V . J. Why are some more peer than others? evidence from a longitudinal study of social networks and indi vidual academic performance. Social Science Researc h 40 , 1506–1520 (2011). 11. McEvily , B., Jaffee, J. & T ortoriello, M. Not all bridging ties are equal: Network imprinting and firm growth in the nashville legal industry , 1933–1978. Organization science 23 , 547–563 (2012). 12. Lavie, D. Alliance portfolios and firm performance: A study of value creation and appropriation in the us software industry . Strate gic Manag ement Journal 28 , 1187–1212 (2007). 13. K oka, B. R. & Prescott, J. E. Designing alliance networks: the influence of network position, en vironmental change, and strategy on firm performance. Strate gic Manag ement Journal 29 , 639–661 (2008). 14. Borgatti, S. Identifying sets of key players in a social network. Computational and Mathematical Or ganization Theory 12 , 21–34 (2006). 15. Duijn, P . A., Kashirin, V . & Sloot, P . M. The relati ve inef fectiv eness of criminal network disruption. Scientific r eports 4 (2014). 16. Roberts, N. & Everton, S. F . Strategies for combating dark networks. Journal of Social Structur e 12 (2011). 17. Ortiz-Arroyo, D. & Hussain, D. A. An information theory approach to identify sets of k ey players. In Intelligence and Security Informatics , 15–26 (Springer , 2008). 18. Arulselv an, A., Commander , C. W ., Elefteriadou, L. & Pardalos, P . M. Detecting critical nodes in sparse graphs. Computers & Operations Resear c h 36 , 2193–2200 (2009). 10/ 13 19. Girvan, M. & Newman, M. E. J. Community structure in social and biological networks. Proceedings of the National Academy of Sciences 99 , 7821–7826 (2002). 20. V alente, T . W . & Fujimoto, K. Bridging: locating critical connectors in a network. Social Networks 32 , 212–220 (2010). 21. Oxley , J. G. Matr oid Theory , vol. 3 (Oxford uni versity press, 2006). 22. Helman, P ., Moret, B. M. & Shapiro, H. D. An exact characterization of greedy structures. SIAM Journal on Discr ete Mathematics 6 , 274–283 (1993). 23. Everton, S. Network topography , key players and terrorist networks. Connections 32 , 12–19 (2006). 24. Liu, X., Patacchini, E., Zenou, Y . & Lee, L.-F . Criminal networks: Who is the key player? CEPR Discussion P aper , No. 8772 (2012). 25. Krivitsk y , P . N. Exponential-family random graph models for v alued networks. Electr onic J ournal of Statistics 6 , 1100 (2012). 26. ICG. T errorism in indonesia: Noordin’ s networks. Asia Report 114, International Crisis Group (2006). 27. Dekker , D., Krackhardt, D. & Snijders, T . A. Sensiti vity of mrqap tests to collinearity and autocorrelation conditions. Psychometrika 72 , 563–581 (2007). 28. Goodreau, S., Kitts, J. & Morris, M. Birds of a feather , or friend of a friend? using exponential random graph models to in vestigate adolescent social netw ork. Demogr aphy 46 , 103–125 (2009). 29. Daniel, E. A methodology to de velop entrepreneurial networks: The tech ecosystem of six african cities. T ech. Rep., DTIC Document (2014). 30. Baird, R. In vestor insights: Startups in ghana are not just locally , but globally rele vant. A vailable at: https://vc4africa.biz/blog/2015/07/29/in vestor-insights-startups-in-ghana-are-not-just-locally-b ut-globally-relev ant- africa/. (Accessed: 19th January , 2016) (2015). 31. Kpodo, S. The great tech transformation. A v ailable at: http://newafricanmagazine.com/the-great-tech-transformation/. (Accessed: 19th January , 2016) (2015). Ackno wledgements This research was funded in part by the U.S. Army Studies Program and the U.S. Army Research Of fice. The authors are participants in the Scientific Services Program administered by the Battelle Memorial Institute. A uthor contributions statement All the authors contributed materially to the manuscript. J.M. and J.Y . contributed equally by performing the experiments, writing the manuscript, and conducting analyses of the data. D.E. produced the dataset and served as a subject matter expert on entrepreneurial networks in bour geoning ecosystems. All authors revie wed the manuscript. Additional inf ormation Competing financial interests None. T ables 11/ 13 Network Intervention Classrooms In vestment community W orkplace Criminal network Strengthening and creat- ing ties Assigning children to work on a joint project Facilitating a joint venture between two stakeholders Assigning partners Having an informant introduce two crim- inals W eakening and breaking ties Separating two children in a classroom Removing support for a co-venture Changing the command structure to av oid communication between certain positions in an organization Sowing distrust between two criminals Removing nodes Moving a child to a different classroom Shutting down a particular b usiness Firing or transferring an employee Arresting a criminal Adding nodes Introducing a child from an- other classroom Encouraging a new stakeholder to enter the community Hiring a new employee Having an informant infiltrate the net- work Changing covariate val- ues Giving a child a rank in the class Giving a grant to a stakeholder Promoting an employee Put on most wanted list Aims of intervention Increasing educational attainment Increasing in vestment returns Increasing employee retention Decreasing number of violent crimes Decreasing social segregation Increasing new b usiness formation Increasing team output Decreasing drug production T able 1. Applied Examples of network interventions 12/ 13 Estimate Std. Error Edge Covariates Organization co-af filiation 0.433 0.193 * Shared education 0.424 0.283 Friendship 4.504 0.345 *** Kin 4.171 0.670 *** Shared religious institution 3.654 0.776 *** Structural parameters Edges -5.744 0.327 *** Isolates -1.111 0.580 . GWESP ( α = 0 . 25) 2.006 0.241 *** Signif. codes: 0 “***” 0.001 “**” 0.01 “*” 0.05 “. ” 0.1 T able 2. ERGM model of Noordin terrorist network communications Node A Node B Addis Ababa Dar es Salaam Kampala Lusaka Monrovia Govt. Rep Social Network 0 0 3 0 0 Incubator Social Network 9 0 29 24 16 Incubator Professional 8 0 18 26 10 In vestor Social Network 0 26 0 0 0 In vestor Professional 0 13 0 0 0 Social Network Professional 33 11 0 0 24 T able 3. Edge weights for all entrepreneurial ecosystems in the EntrepEco dataset. Estimate Pr( ≥ b ) Intercept -6.6235 – – Communication 1.3219 0.035 * Education 1.0567 0.065 . Organization 0.3727 0.147 Signif. codes: 0 “***” 0.001 “**” 0.01 “*” 0.05 “. ” 0.1 T able 4. MRQAP table predicting the terrorist collaboration network 13/ 13
Original Paper
Loading high-quality paper...
Comments & Academic Discussion
Loading comments...
Leave a Comment