Semantic Scan: Detecting Subtle, Spatially Localized Events in Text Streams
Early detection and precise characterization of emerging topics in text streams can be highly useful in applications such as timely and targeted public health interventions and discovering evolving regional business trends. Many methods have been pro…
Authors: Abhinav Maurya, Kenton Murray, Y
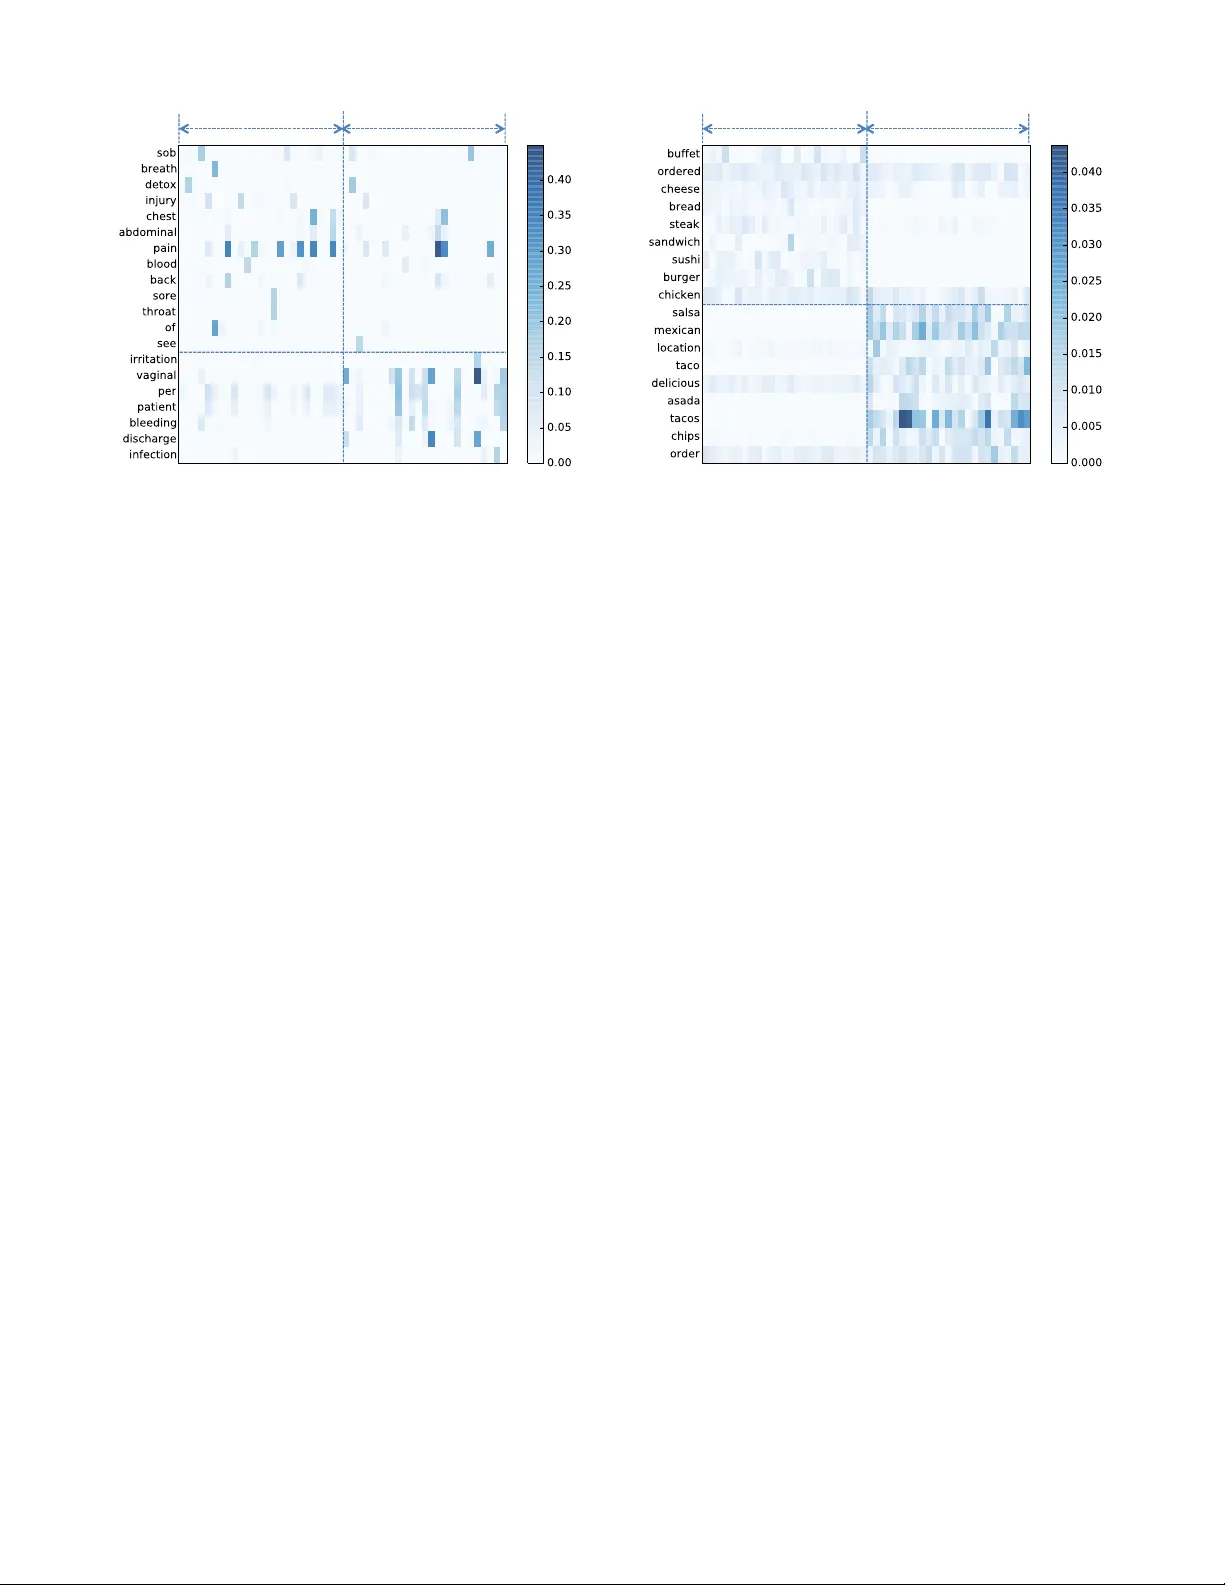
Semantic Scan: Detecting Subtle, Spatially Localized Events in T e xt Streams Abhinav Maur ya ∗ H. J . Heinz III College Carnegie Mellon University Pittsburgh, P A 15213 ahmaur ya@cm u.edu K enton Murra y ∗ Computer Science & Engineering University of Notre Dame Notre Dame, IN 46556 kmurra y4@nd.edu Y andong Liu ∗ Uber Inc San F rancisco , CA 94103 yandongl@cs .cmu.edu Chris Dyer Language T echnologies Institute Carnegie Mellon University Pittsburgh, P A 15213 cdyer@cs .cmu.edu William W . Cohen Machine Learning Depar tment Carnegie Mellon University Pittsburgh, P A 15213 wcohen@cs.cm u.edu Daniel B. Neill † ∗ H. J . Heinz III College Carnegie Mellon University Pittsburgh, P A 15213 neill@cs.cm u.edu ABSTRA CT Early detection and precise characterization of emerging topics in text streams can b e highly useful in applications suc h as timely and targeted public health interv entions and disco v ering evol ving regional business trends. Man y meth- ods ha ve been proposed for d etecting emerging even ts in text streams using top ic modeling. How ever, these methods ha v e n umerous shortcomings that mak e them unsuitable for rapid detection of lo cally emerging even ts o n massive text streams. In this paper, we describe Seman tic Scan (SS) that has been dev eloped sp ecifically to o vercome these shortcomings in de- tecting new spatially compact even ts in text streams. Seman tic Scan integrates nov el con trastiv e topic mo deling with online document assignment and principled likelihood ratio-based spatial scanning to identify emerging ev en ts with unexpected patterns o f k eywords hidden in text streams. This enables more timely and ac curate detection and charac- terization of anomalous, spatially lo calized emerging even ts. Seman tic Scan do es not require manual interv ention or la- beled training data, and is robust to noise in real-world text data since it ident ifies anomalous text patterns that occur in a cluster of new documents rather than an anomaly in a single new do cument. W e compare Semantic Scan to alternative state-of-the-art methods such as T opics o ver Time, Online LD A, and La- beled LDA on t wo real-world tasks: (i) a disease surv eil- ∗ W ork performed while at E ven t and P attern Detection La b- oratory , Carnegie Mellon Univ ersit y . † Corresponding Author Permission to make digital or hard copies of all or part of this work for personal or classroom use is granted without fee provided that copies are not made or distributed for profit or commercial advantage and that copies bear this notice and the full cita- tion on the first page. Copyrights for components of this work owned by others than A CM must be honored. Abstracting with credit is permitted. T o cop y otherwise, or re- publish, to post on servers or to redistribute to lists, requires prior specific permission and /or a fee. Request permissions from permissions@acm.org. c 2016 A CM. ISBN 978-1-4503-2138-9. DOI: 10.1145/1235 lance task monitoring free-text Emergency Department c hief complain ts in Alleghen y Coun ty , and (ii) an emerging busi- ness trend detection task based on Y elp reviews. On b oth tasks, we find that Semantic Scan pro vides significantly bet- ter ev en t detection and c haracterization accuracy than com- peting approaches, while pro viding up to an order of mag- nitude speedup. Categories and Subject Descriptors H.2.8 [ Database Ma nagemen t ]: Database Application s— Data Mining K eywords T opic Mo deling, Anomalous Pattern Detection, Spatial Scan 1. INTR ODUCTION T ext streams are ub iquitous in data processing and kno wl- edge discov ery workflo ws. Their analysis and summarization is difficult b ecause of their unstructured nature, sparsity of the canonical bag-of-w ords representa tion, the massive scale of web-scal e text streams like Twitter and Y elp Reviews, and the noise present due to word v ariations from missp ellings, dialects, and slang. T opic modeling is a mixed-membership mo del used to summarize a corpus of text documents using a set of la- ten t topics, where eac h topic is a sparse distribution on w ords. Ho w ever, traditional topic mo deling methods like Laten t Dirichlet Allocation (LD A) are too slo w for analyzing w eb-scale text streams, and also assume that there is no con- cept drift in the topics being learned ov er time. V ariations lik e Online LD A [1], Dynamic T opic Mo dels [2], and T opics over Time [3] relax the assumption that there is no concept drift in the learned topics with time, but make strong as- sumptions ab out the smo oth evolution of topics with time, making them po or mo dels of the “bursty” dynamics that are often observ ed as new topics app ear [4]. In this paper, we prop ose Semantic Sc an (SS) which was dev eloped to ov ercome these shortcomings in the scalable de- tection of spatially lo calized emerging topics in text streams. SS is a no vel framew ork for detecting anomalous patterns in spatio-temp oral free text data. It in tegrates contrastiv e topic mo deling with online document assignment and prin- cipled lik eliho o d ratio-based spatial scanning to iden tify emerging even ts with unexp ected patterns of keyw ords hid- den in text streams, th us enabling more timely and accurate detection and characterization of anomalous, spatially com- pact outbreaks. There is no need for man ual interv ention, labeled training data, or exp ensiv e data preprocessing, as SS robustly handles noisy data complete with uncommon phrases, misspellings, and incorrect en tries. W e compare our method with three state-of- the-art meth- ods - T opics over Time [3], Online LD A [1], and La b ele d LDA [5] - to pro ve the effectiveness and efficiency of our methods. W e carry out the comparison on t wo real-world detection tasks. The first is a disease surv eillance task based on monitoring free-text Emergency Departmen t chief com- plain ts in Allegheny Count y . The second is the task of de- tecting emerging business trends based on Y elp reviews. On both tasks, SS enables significan t improv ement in detection time and the p ercen tage of even ts detected while incurring a fraction of running time compared to comp eting metho ds. Stak eholders using an algorithm need not only the abilit y to detect an even t but also precisely characterize the nature and scope of the even t. W e test the abilit y of SS to charac- terize the emerging even t using three metrics: (i) Hellinger distance betw een the detected emerging topic and the empir- ical distribution of w ords in the do cumen ts known to contain the emerging topic, (ii) Spatial Overla p - the Jaccard sim- ilarit y b etw een the set of truly affected lo cations and the set of locations that were detected to be affected, and (iii) Document Ov erlap - the Jaccard similarit y b et ween the set of documents containi ng the true emerging topic and the set of do cumen ts that were detected to contain the detected emerging topic. W e find that SS performs b etter than com- peting approaches in even t charact erization, and therefore serv es as a useful tool in the ev en t detection and character- ization toolkit. 2. B A CKGROUND AND RELA TED WORK Both spatial scan statistics and topic models are p opular mac hine learning metho ds for identifying structure in data. Spatial scan aims to discern anomalous patterns within spa- tially and temporally located data, determining if portions of the dataset cannot be explained by an underlying, base- line process and therefore ma y b e of p oten tial in terest. T opic models attempt to discov er latent mixtures of topics (where eac h topic is a probability distribution o v er words) that de- scribe a corpus of unstructured text data. While exten- sions to topic mo dels hav e incorp orated spatial and temp o- ral information, no work has been done to detect anomalous spatio-temporal regions using topic mo dels. Likewise, spa- tial scan statistics hav e been extended to a v ariet y of data t yp es, but hav e not previously been able to deal with un- structured free text data. Finally , as compared to previous dynamic and online LD A approaches, which assume that topics ev olve smo othly o ver time, our con trastive to pic mod- eling approach is m uc h more effective for detecting newly emerging topics and their corresponding, spatially lo calized ev en ts. 2.1 Spatial Scan Statistics The spatial scan statistic [6] is a pow erful method for spa- tial even t surveillance which detects anomalous spatial or space-time clusters that are not well explained by a baseline process. An extension of scan statistics [7], which attempt to determine if a point process is random, spatial scan statistics are frequently used by the public health commu nit y for de- tecting spatial clusters of diseases suc h as breast cancer [8], leuk emia [9], and W est Nile virus [10]. They ha v e also b een broadly applied to other structured space-time dat a in tasks suc h as crime detection [11]. Kulldorff ’s spatial scan [6, 12] searc hes o ver geographic areas consisting of circles of v arying radii centered at eac h of the monitored spatial lo cations. Ov er this set of regions, it maximizes a likelihoo d ratio statistic that compares the observ ed coun t to the expected cou nt i.e. the baseline, where baselines are estimated from population data or from time series analysis of historical data [13]. This approach has been extended to other spatial areas such as rectangles [14], ellipses [15], and irregularly shap ed regions [16, 17, 18], and has b een generalized to “subset scan” , which enables the efficien t identification of anomalous subsets in more general datasets with spatial, temp oral, or graph constraints [19]. Spatial scan statistics typically monitor a set of kno wn spatial lo cations, { s 1 . . . s N } , where each lo cation s i has a time series of observed coun ts c t i and a time series of ex- pected counts b t i . They scan ov er the set of space-time regions S consisting of spatially constrained subsets of lo- cations S spatial ⊆ { s 1 . . . s N } for time durations W ∈ { 1 . . . W max } , and maximize a lik elihoo d ratio statistic F ( S ), where: F ( S ) = log Pr(Data | H 1 ( S )) Pr(Data | H 0 ) (1) In this equation, the alternativ e h ypothesis H 1 ( S ) typi- cally assumes a multiplicativ e increase in counts c t i for the giv en spac e-time regi on S , while the n ull h yp othesis assumes that all counts c t i are generated from some distribution with means prop ortional to b t i . Here w e use the expectation-based P oisson scan statistic [13], commonly used to mo del count data, which assumes that c t i ∼ Poisson( b t i ) under H 0 , while under H 1 ( S ), we hav e c t i ∼ Poisson( qb t i ) for s i ∈ S for some constan t q > 1. Assuming the maxim um lik elihoo d estimate of q , the log-likelihoo d ratio simplifies to: F ( S ) = ( C log C B + B − C ; C > B 0; C ≤ B (2) where C and B are resp ectiv ely the aggregate coun t P c t i and aggregate baseline P b t i for space-time region S . While this formulation focuses on detecting regions with higher than expected cou nt s, man y other v arian ts exist for iden tify- ing decreased counts, higher counts inside the region versus outside [6], or incorp orating other parametric models suc h as Gaussian or exp onential counts [19]. 2.2 T opic Modeling T opic modeling is a p opular set of metho ds for dealing with unstructured data and free text. In general, topic mod- eling algorithms attempt to fit a laten t mixture of thematic topics to each individual do cument in a corpus. Each topic is a distribution ov er w ords in the corpus, and each do cu- men t is represented as a mixture of these topics. Given a corpus of documents with only observ ed w ords, topic mod- eling algorithms attempt to learn the posterior distribution o ve r w ords for eac h topic and o ver topics for each do cumen t. One of the most w ell-kno wn topic models, Laten t Dirichlet Allocation (LD A), has b ecome commonly used for unsuper- vised text corpus mo deling [20]. T opic mo dels enhance text classification b y allowi ng multiple topics to exist within a document, and by allo wing w ords to hav e a probabilistically assigned likelihoo d of b eing generated from a sp ecific topic. LD A models a corpus of documents d = 1 . . . D , eac h with a potentially differen t num ber of words N d , from a v o cabu- lary V . The mo del as sumes a generativ e process for a corpus where each do cumen t d has a mixture of topics, represented as a m ultinomial distribution θ d . Eac h word i in the docu- men t has an individual topic assignment z di = k , and then a word w di is drawn from the vocabulary V using the multi- nomial distribution ov er words φ k for the selected topic. A ttempting to mo dify LDA to accoun t for topic shift ov er time is an activ e area of researc h. Dynamic T opic Models [2] allo w the Dirichlet hyperparameters α and β , for θ and φ respectively , to v ary ov er time using a Marko v assumpti on with Gaussian noise. This allows the topics at eac h time t to “smo othly” ev olv e from the previous topics at time t − 1. Con tin uous time dynamic topic mo dels [21] remov e the as- sumption of discrete time steps by using Brownia n motion. The evolution of the h yp erparameters allows the same topi cs to evolv e ov er time; this differs from our approach described below, as we do not let topics evolv e, but instead iden tify newly emerging topic s. In con trast to the previous me thods, T opics Over Time [3] is a metho d where the topics are fixed but the topics’ relative o ccurrences and correlations c hange o ver time. Similarly , [22] mo difies the basic LD A mo del to allo w topic mixtures, θ , to v ary ov er time according to a Mark o v assumption, but keeps φ , α , and β constan t ov er time. Again these metho ds differ from ours as they do not allo w for new topics, the k ey asp ect of our anomalous pat- tern detection framework. SA TM [23] extends topic mo dels to use a temp oral ordering of topics b y learning a random topic initialization at t 0 and then allowing each time step to be based upon the previous slice similar to [2]. Finally , the m ultiscale dynamic topic model [24] allows φ , the distribu- tion of w ords in a topic, to v ary o ver ti me slic es. Here, topic s are influenced through the Diric hlet hyperparameter whic h is adapted from a w eighted sum of the empirical distribu- tions of words at different time scales. The unifying factor in time v arian t topic mo dels is that topics gradually change o ver time and smo othly ev olve. Little work has b een done on detecting newly emerging topics, which is the primary focus of our nov el topic mo deling approac h. Labeled LDA [5] is a closely related sup ervised topic model which can be adapted to the task of emerging topic detection by enforcing the constraint that bac kground doc- umen ts can contain only a subset of all topics known as bac kground topics, while the foreground do cuments are al- lo w ed to con tain backgroun d as w ell as foreground topics. Labeled LD A do es not attempt to learn foreground topics that con trast with the bac kground topics. Our exp erimen- tal results b elow demonstrate that our prop osed contrastiv e topic mo deling approach muc h more accurately captures an emerging topic of interest as compared to Lab eled LDA. Our work is also related to the “burst” modeling approac h in [25]. Ho wev er, mo deling term bursts cannot effectiv ely detect a new even t when it appears as a new co-occurrence of already p opular terms affecting a small set of lo cations. T opic models hav e also b een extended to incorp orate geo- graphical information, and th ese methods hav e b een applied to so cial media data for t wo primary purposes: 1) inv estigat- ing regional v ariations in trending topics, language use, etc., and 2) predicting geographic locations of do cuments. Eisen- stein et al. [26] extend topic mo dels by introducing a latent “region” v ariable into the graphical mo del so that K topics are learned for each region. Yin et al. [27] fo cus on ho w to compare the identified topics across different regions, and Hong et al. [28] show a computationally efficien t wa y to rep- resen t b oth users and geographical areas using sparse mo del- ing tec hniques. In general, these metho ds fo cus on training predictiv e models that are specific to individual areas but do not change ov er time, as opp osed to our work which fo cuses on detecting emerging changes in an area. W e note that the subset of lo cations affected b y an emerging even t ma y not correspond w ell to the partitions learned from bac kground data when no even ts are o ccurring, and thus the latent re- gion v ariable ma y not effectively capture even ts of interest. 3. METHODOLOGY Seman tic Scan (SS) integrates a no v el con trastive LDA model with spatial scan statistics to incorporate unstruc- tured text data in to a spatial even t detection framework. The key assumption in doing so is that a nov el even t of in- terest will generate text do cuments whic h are similar to each other, y et differen t from the remainder of the corpus, in their co-occurrences of terms; note that the individual terms may appear elsewhere in the corpus in other contexts. This can be though t of as a noisy-channel mo del where the true data stream of in terest (consisting of all and only those do cu- men ts corresp onding to the no vel ev en t) has been obfuscated through the use of natural language such that it no longer exhibits an explicit, observ able, expert label. How ever, un- der the assumption abov e, the labels can be appro ximately reco v ered through the use of a no v el contrastiv e topic mo d- eling approach, which we describ e shortly . F or example, in disease surveillance, each topic represents a class of diseases with similar symptoms. Each disease case is describ ed b y a patient to a health care pro vider and transcribed, intro- ducing errors, abbreviations, and other v ariabilit y , but the patterns of keyw ords in these descriptions can be used to group cases and th us provid e useful structure for detection of anomalous trends. Once the data is structured, spatial scan metho ds represent the state-of-the-art in terms of in- corporating spatial and temp oral data to identify emerging space-time patterns, which is imp ortant since we exp ect the ev en t of in terest to be lo calized in space and time as well as generating text data which forms a nov el and coherent topic. Th us our general Semantic Scan framework consists of three main steps: (i) Two sets of topics - background topics φ k , k ∈ { 1 . . . K } , and foreground topics φ 0 k 0 , k 0 ∈ { 1 . . . K 0 } , are learned from the data. Each topic represen ts a sparse probabilit y distribution ov er words in the v o cabulary . (ii) W e p erform online assignmen t of eac h individual do cument to the most lik ely topic, using a robust assignmen t method similar to exp ectation maximization (EM). (iii) W e p erform spatial scanning, identifying spatial regions that hav e a sig- nifican tly higher than expected n um ber of recent cases as- signed to some foreground topic. W e no w provide details on the con trastive topic model used to learn topics within the Seman tic Scan framew ork, and then describ e our methods for online topic assignment and spatial scanning. 3.1 Contrastive T opic Model W e no w describ e our nov el contrastiv e topic mo del, which builds on Laten t Diric hlet Allo cation [20] but is sp ecifically designed to detect anomalous, newly emerging topics. W e note that while the last step of the Semantic Scan frame- w ork, spatial scanning, incorporates both spatial and temp o- ral information, the initial topic modeling step do es not use the spatial information, fitting the topic mo del using do cu- men ts from all locations for a given time frame. Given that it is unknown whether an ev ent is o ccurring, and that the subset of locations affected is uncertain, incorp orating spa- tial information is difficult in this setting. Learning individ- ual topic mo dels for eac h spatial lo cation suffers from b oth increased computation time and data sparsit y issues, o ver- fitting topics to underlying noise using a very small num ber of do cumen ts. Similarly , learning topic mo dels for each po- ten tially affected subset is computationally infeasible, th us motiv ating our prop osed approach. Also, since exact infer- ence in the LD A mo del is in tractable, our LD A implemen ta- tion uses a collapsed Gibbs sampler to p erform approxima te inference as in [29]. In addition to computational efficiency , this approach extendes more easily to the con trastiv e topic model describ ed b elow, as compared to alternatives such as v ariational inference. Con trastiv e T opic Mo deling consists of three steps: (i) In the bac kground phase, it first learns a set of K background topics using the corpus of historical training data. Once learned, these topics can b e reused across many days of de- tection until a new emerging ev en t is detected. (ii) In the first step of detection phase, it considers a mo ving window of X da ys ( X = 3 in our implementations) and learns a sep- arate set of K 0 foreground topics using only documents from the moving windo w, using a standard LD A topic model. (iii) In the second step of detection phase, it no w considers the com bined set of all ( K + K 0 ) topics and refits the mo del as sho wn in the bottom panel of Figure 1. When the K 0 top- ics are first learned, they can o v erlap significantly with the K backg round topics, b ecause the foreground do cumen ts in the movi ng windo w conta in b oth bac kground topics φ and foreground topics φ 0 . By refitting the mo del φ 0 after in tro- ducing the fixed background topics φ , the foreground topics φ 0 are forced to align wi th emerging topics in th e foreground documents. This is because the bac kground componen t of foreground do cumen ts is explained by and attributed to the bac kground topics in the modified Gibbs sampling procedure (Algorithm 1). The key difference is that the K backg round topics are treated as fixed for this inference step, and th us the distribu- tion ov er w ords φ k for each backgrou nd topic is treated as an observ ed v ariable in the graphical model. The distribution o ve r words φ 0 k 0 for eac h of the K 0 foreground topics is allo w ed to v ary , as is the distribution θ d o ver the K + K 0 topics for eac h foreground document d . This has the effect of pushing the foreground topics tow ard capturing distributions ov er w ords in the current data that are not well mo deled by the fixed, backgroun d topics, thus allowing the con trastive topic model to learn a new set of topics that better model nov el emerging even ts. While some of the re-fitted foreground topics ma y capture noise or other irrelev ant patterns in the data, we exp ect that no vel patterns of interest will also b e captured, and then the spatial scanning step will distinguish “signal” fro m “noise” topics. Our exp erimen tal results, dis- cussed in detail b elow, sho w that this approach pro duces D N K θ φ β α w z D' N' K' θ ' φ ' β ' α ' w ' z ' φ K Historic Data Current Data Figure 1: Seman tic Scan T opic Model. A set of K topics are learned using historical data and K 0 topics are learned using curren t data. Semantic Scan then re-fits the K 0 foreground topics using the com bined set of K + K 0 topics, where φ k are fixed for all bac k- ground topics, treating these as observ ed v ariables. topics whic h muc h more precisely capture no v el ev ents, in- creasing signal strength and therefore detection pow er, as compared to state-of-the-art comp eting approac hes, which also include irrelev ant terms and documents in the learned topics. W e note that the contrastiv e topic mo del with b oth back- ground and foreground topics is no longer equiv alent to LD A, as it contai ns fixed observ able distributions of topics whic h impact the p osterior inference. This required mo difi- cation of the collapsed Gibbs sampler (Algorithm 1). First, the Gibbs sampler is initialized by assigning a topic z di = k to each word w di of each do cumen t d . Instead of dra wing these initial topic assignments uniformly at random, w e use the distributions ov er words φ k that were learned for the K bac kground and K 0 foreground topics in the first tw o steps of the contrastiv e topic mo deling method described before. W e assign w ord w di to topic k with probabilit y prop ortional to φ ( w di ) k , the component of topic k ’s distribution ov er words for the giv en word w di . Based on this initial assignment of w ords to topics, w e up date the foreground topics, comput- ing new v alues of φ ( w ) k , the probabilit y of eac h word in the v o cabulary given topic k : φ ( w ) k = n ( w ) k + β n ( . ) k + | V | β , (3) where n ( w ) k is the num ber of assignments of term w to topic k , n ( . ) k is the num b er of assignmen ts of all terms to topic k , β is the Diric hlet hyperparameter for φ , and | V | is vo- cabulary size. Similarly , we compute new v alues of θ ( k ) d , the probabilit y of each (bac kground or foreground) topic given document d : θ ( k ) d = n ( k ) d + α n ( . ) d + ( K + K 0 ) α , (4) where n ( k ) d is the num b er of assignments of word s in do c- umen t d to topic k , n ( . ) d is the num b er of assignments of Algorithm 1: Mo dified Gibbs Sampler for e ach do cument d do for e ach wor d w di in do cument d do Assign topic z di = k with probability prop ortional to φ ( w di ) k from initial static and dynamic mo dels. Compute θ d using equation (4); for e ach for e gr ound topic k do Re-compute φ k using equation (3); while not Conver ge d do for e ach do cument d do for e ach wor d w di in do cument d do Remo v e curren t topic assignment, z di = k ; Update θ d ; if foreground topic, also up date φ k ; for e ach topic k do Compute: Pr( z di = k ) ∝ φ ( w di ) k θ ( k ) d ; Sample a new topic assignment, z di = k ; Update θ d ; if foreground topic, also up date φ k ; w ords in do cument d to all topics, α is the Diric hlet h y- perparameter for θ , and K + K 0 is the num ber of topics. Sampling proceeds as usual, except that the φ k distribu- tions for all background topics remain fixed throughout the inference pro cess, and are not c hanged when sampling the topic assignmen ts. W e note that the contrast ive topic model is desig ned to b e v ery differen t than other topic modeling methods with time- v arying topics: our metho d biases the emerging foreground topics to b e con trastiv ely differen t from existing topics, un- der the assumption that suc h topics will be most useful for no v el ev en t detection. As discussed before, previous meth- ods instead aim for a smooth evolution of topics ov er time, capturing trends in the current set of topics rather than iden tifying en tirely new topics. 3.2 Online T opic Assignment Online inference for new do cumen ts in topic mo dels is a non-trivial problem, and is of increased importance in the spatial ev ent detection framework as the signal of in terest can b e lost due to p o orly chosen topic assignmen ts. F rom a surveillance p erspective, the most in teresting aspects of a dataset can hav e a v ery low probabilit y of o ccurrence, and th us dimensionalit y reduction techn iques suc h as LD A can drown out the subtle, spatially lo calized signal. W e discuss ab ov e ho w the ov erall LD A pro cedure can b e mo d- ified to fo cus on infrequen t, newly emerging patterns, but ev en once the set of topics is learned, this problem reo ccurs when assigning documents to topics. W e note that the cor- pus of foreground do cuments on which the topic mo dels are learned do es not include all cases needed to compute counts and baselines for spatial scanning, so we cannot just use the θ d distributions learned while p erforming topic mo deling. W e examined common online assignmen t methods suc h as Gibbs sampling, but found that the com bination of low term frequencies (for the nov el terms of particular interest) and short do cument lengths caused the initial random as- signmen ts of words to topics to hav e a profound impact. In particular, for short do cuments, Gibbs sampling may assign iden tical or nearly identic al documents to differen t topics rather than grouping all of these in to the same topic, re- sulting in a diluted signal and low er detection p o w er. Other common methods, suc h as summing the probabilities for a giv en topic o v er all w ords in the document, and then tak- ing the maxim um o v er topics, also did not p erform well. Summing probabilities tends to emphasize commonly o c- curring words (whic h ma y ha ve high probabilities for m ul- tiple topics) even when these are not esp ecially relev an t. On the other hand, multiplying probabilities tends to em- phasize very rare words with small probabilities, and tends to b e unduly influenced b y missp ellings and other rare but irrelev ant words. Th us we dev eloped a metho d inspired b y exp ectation-maximization (Algorithm 2), and used this method to compute the assignmen t of do cuments to topics. Algorithm 2: Online Do cumen t Assignment θ (1) d = . . . = θ ( K ) d = 1 K ; while not Conver ge d do for e ach wor d w di in do cument d do for e ach topic k do Compute: Pr( z di = k ) ∝ φ ( w di ) k θ ( k ) d ; Normalize: P k Pr( z di = k ) = 1; for e ach topic k do Compute: θ ( k ) d ∝ α + P i Pr( z di = k ); Normalize: P k θ ( k ) d = 1; Assign document d to topic k = arg max k θ ( k ) d ; Giv en the distributions o ver words φ k for each topic k , this algorithm assigns entire documents to topics, and can be performed indep endently for eac h do cumen t. In Algo- rithm 2, φ ( w di ) k represen ts the probabilit y of the i th w ord of document d under topic k , and θ ( k ) d is the proportion of topic k in the topic mixture for do cument d . θ d is initial- ized uniformly for each do cumen t since that do cument may not hav e b een seen previously and no prior knowledge is as- sumed. Also, w e note that this assignmen t of documents to topics is performed after we hav e learned the distribu- tion o ver words φ k for eac h topic k . Unlik e other online algorithms, we do not allo w the topics to v ary during the assignmen t phase: metho ds that allow topics to v ary hav e a smo othing effect which can drown out the signal that we are trying to find. Also, topic assignmen t is deterministic for eac h document, rather than dependent on random ini- tializations, so identical do cuments will alw a ys b e assigned to the same topic. This is important to a v oid diluting the signal of interest in the spatial scan step b elo w. W e use this online do cument assignmen t approac h to classify all do cu- men ts in the moving detection window ( W max = 3 days for our exp eriment s) and the preceding 30 days, which are used to estimate the exp ected coun ts used in the spatial scanning step below. W e note that each do cumen t is assigned to ei- ther a foreground or background topic, but we p erform the spatial scan o ve r foreground topics only , th us ignoring an y document assigned to a background topic. 3.3 Spatial Scanning Once eac h do cumen t has b een assigned to one of the K + K 0 topics, w e can perform a spatial scan by first comput- ing the aggregate count (num b er of documents assigned to that topic) c t i,k for eac h spatial location (zip code) s i for eac h foreground topic k for eac h day t . W e then compute the ex- pected coun ts i.e. baselines b t i,k for each location, foreground topic, and da y , using a 30-day mo ving av erage. Finally , for eac h foreground topic k , we scan ov er all spatio-temp oral regions S = S spatial × S temporal , where S spatial is a circu- lar spatial region consisting of some cen ter location s i and its n -nearest neigh b ors in Euclidean distance (for all loca- tions s i and all n ∈ { 1 . . . n max } ), and S temporal is a tem- poral windo w consisting of the most recent W days (for all W ∈ { 1 . . . W max } ). F or each such spatio-temporal region S , with corresponding aggregate count C ( S ) and aggregate baseline B ( S ), we compute the log-likelihoo d ratio F ( S ) us- ing the expectation-based P oisson scan statistic defined in equation (2). W e ev aluate all com binations of space-time region and topic, and return the highest scoring space-time region S with its asso ciated score F ( S ) and topic k . There are N · n max circular spatial regions to consider, where N is the num b er of locations and n max is the maxim um neigh b or- hoo d size. F or each spatial region, w e must consider W max time durations and K 0 foreground topics, for a total com- plexit y of O ( N · n max · W max · K 0 ) for the spatial scan step. In our ED exp erimen ts and Y elp experiments below, we had N = 97 and N = 58 locations respectively , and w e used K = 25 backgro und topics and K 0 = 25 foreground topics for both experiments. Randomization testing can be used to test for statistically significan t clusters, correctly adjusting for m ultiple hypothesis testing, as in [6]. 4. EXPERIMENTS W e compared Seman tic Scan to three alternative state-of- the-art methods suc h as T opics ov er Time, Online LD A, and Labeled LD A on t w o real-world tasks: (i) a disease surv eil- lance task monitoring free-text Emergency Department c hief complain ts in Alleghen y Coun ty , and (ii) an emerging busi- ness trend detection task based on Y elp reviews. The four methods we compared are as follows: • Semantic Scan (SS) : W e used a 3 da y mo ving win- do w for detection, K = 25 bac kground topics, and K 0 = 25 foreground topics. Typical hyperparameter v alues α = 1 K + K 0 and β = 1 | V | w ere used, where | V | is the v ocabulary size. • T opics ov er Time (T oT) [3] : Since SS learns 50 total topics ( K = 25 , K 0 = 25), detects even ts with a 3-da y moving window and uses the past 30 days to calculate exp ected counts for spatial scanning, we ran a comparable detection with T oT b y using a mo ving windo w of 33 days and learning 50 topics in each win- do w, using hyperparameters as describ ed in [3]. • Online LD A (OLD A) [1] : W e ran OLDA with a similar detection windo w of 33 da ys, learning 50 topics in each window. W e set the OLDA h yperparameter κ , whic h con trols the rate at which topics b eing learned in an online fashion are up dated, to 0.9. • Lab eled LD A (LLD A) [5] : In order to pro- vide appropriate supervision to Labeled LDA, w e as- signed lab els 1 , 2 . . . , K to background documents and 1 , 2 . . . , K + K 0 to foreground documen ts. This implies that we constrained backg round do cumen ts to contain only the K = 25 background topics, and allow ed fore- ground documents to contain b oth the K = 25 bac k- ground as well as the K 0 = 25 foreground topics. W e implemented SS, T oT, and Lab eled LD A in Python, and used the publicly av ailable Python implementation of OLD A in our comparisons. After the topics are learned, the online do cumen t as- signmen t and spatial scanning steps for the comp eting ap- proac hes are iden tical to SS. The first 30 da ys of the windo w w ere used for calculating exp ected coun ts, while the last 3 da ys were used for eve nt detection. W e note that a circu- lar spatial scan [6], using a 30-da y mo ving av erage to es- timate exp ected coun ts and a maxim um neigh borho o d size n max = 30, w as used for all metho ds. W e expect th e c ircular scan to hav e high detection p o w er for compact spatial clus- ters, while alternative approaches such as the fast subset scan [19] w ould ha ve higher pow er to detect highly elon- gated or irregular clusters. Similarly , more complex time series analysis methods could b e incorp orated to accoun t for seasonal and da y of w eek trends, time-v arying cov ari- ates, etc. These alternative scan approac hes and time series analysis metho ds could b e easily plugged in to the seman tic scan framew ork. 4.1 ED Dataset The first dataset we use is a de-identified spatio-temp oral dataset of hospital Emergency Departmen t (ED) data col- lected from ten Allegheny Count y , P ennsylv ania hospitals from Jan uary 1, 2003 to Decem ber 31, 2005. The dataset consisted of ∼ 340K records of individual ED visits, each of which con tained four attributes: admission date, home zipco de, chief complaint, and Internation al Classification of Diseases-9th Edition (ICD-9) co de. They appear similar to the records given in T able 1. The first three attributes are populated up on a patien t’s admittance to the ED, while ICD-9 code is generally not p opulated un til the patien t’s disc harge. W e use this attributes for ev aluation and com- parison purposes only . T able 1: Example Case F ormats Date Location Chief Complaint ICD-9 01.01.2004 15213 COUGH/NA USEA 789 02.03.2004 15232 BLEEDING 556.3 07.04.2005 15232 ETOH 421 The “Chief Complaint” field of the dataset is a free-text field recorded by a triage nurse upon a patient’s admittance to the ED. Chief complaints are generally short (a few w ords or a phrase, suc h as “pain in rt arm” ), hav e little grammatical structure and minimal standardization across records, and are very noisy , with frequen t missp ellings and inconsisten t use of terms and abbreviations. The en tries in the “ICD-9” field of the dataset are standardized co des used to manual ly classify diseases and ailments into sp ecific groups. They are primarily used for billing purposes in the United States; we use these for our leav e-one-out ev aluation strategy . W e split the dataset into the background documents from 2003 which are used to learn bac kground topics, and fore- ground documents from 2004-2005 which are used for the detection. W e created 10 even t outbreak s for each of the 10 most frequent ICD-9 codes, i.e. 100 ev ents in all. In order to create an outbreak corresp onding to a given ICD- 9 code, all complaints with that ICD-9 co de were remov ed from the backg round and foreground do cuments, thus sim- ulating the occurrence of a nov el, previously unseen out- break in the data. W e then used the Bay esian Aerosol Re- lease Detector (BARD), a publicly a v ailable outbreak sim- ulator [30], to inject a disease outbreak into the foreground documents. The BARD sim ulator is a highly realistic model ! ! ! 0! 2000! 4000! 6000! 8000! 10000! 12000! 14000! TOT! OLDA! LABELED!LDA! SS! !"#$%&'()%#(*'+,#-./( 0'$1,-( ! ! 0.4! 0.5! 0.6! 0.7! 0.8! 0.9! 1! 1! 4! 7! 10! 13! 16! 19! 22! >57+$%,#(6'$'+$'-( ?"&9'5(,@(>73.'(A,.%$%<'.(='5(B'75( TOT! OLDA! LLDA! SS! ! 2! 3! 4! 5! 6! 7! 8! 9! 1! 4! 7! 10! 13! 16! 19! 22! 67;.($,(6'$'+$( ?"&9'5(,@(>73.'(A,.%$%<'.(='5(B'75( TOT! OLDA! LLDA! SS! (a) Run times (ED) (b) F ractio n of Outbreaks Detected (ED) (c) Da ys to Detect (ED) ! ! 0! 5000! 10000! 15000! 20000! 25000! 30000! 35000! 40000! 45000! 50000! TOT! OLDA! LABELED!LDA! SS! !"#$%&'()%#(*'+,#-./( 0'$1,-( ! 0.4! 0.5! 0.6! 0.7! 0.8! 0.9! 1! 1! 4! 7! 10! 13! 16! 19! 22! >57+$%,#(6'$'+$'-( ?"&9'5(,@(>73.'(A,.%$%<'.(='5(B'75( TOT! OLDA! LLDA! SS! ! 2! 3! 4! 5! 6! 7! 8! 9! 1! 4! 7! 10! 13! 16! 19! 22! 67;.($,(6'$'+$( ?"&9'5(,@(>73.'(A,.%$%<'.(='5(B'75( TOT! OLDA! LLDA! SS! (d) Run times (Y elp) (e) F raction of Even ts Detected (Y elp) (f ) Days to Detect (Y elp) Figure 2: Figures (a) and (d) on the left show the run times of SS compared to v arious methods on the ED and Y elp datasets. Figures (b) and (e) sho w the fraction of even ts detected as a function of num b er of false p ositiv es p er y ear. Figures (c) and (f ) show the av erage num b er of da ys required to detect after start of the outbreak as a function of false p ositiv es per year. of the spatio-temp oral distribution of Emergency Depart- men t cases resulting from a bioterrorist attack (airb orne re- lease of weaponized anthrax sp ores), integrating a disp er- sion model whic h takes wind speed and direction into ac- coun t with a detailed, population-based patien t model to predict who will b e affected and when they will visit a hos- pital Emergency Departmen t. The text complaints injected as part of the outbreak were uniformly sampled from the held-out complain ts for the given ICD-9 co de, thus mo del- ing a nov el outbreak which affects the p opulation similarly to an thrax but may hav e v ery differen t symptoms. Minimal preprocessing w as done to the chief complaint data field: all wo rds w ere conv erted to lo wercase, punctu- ation was remov ed, and tok ens with slashes, ampersands, and similar punctuation were separated into tw o w ords. In man y applications, text normalization methods such as stop w ord lists and stemming are used to preprocess data, but w e did not do this as these methods could negatively im- pact detection pow er by removing the signals of in terest in this domain. No metho ds w ere provided acc ess to the ICD-9 field, whic h was used for ev aluation purp oses only . 4.2 ED Results First, w e compare the run times of the v arious detection algorithms. Figure (2.a) sho ws av erage runtimes of the v ari- ous metho ds p er injected outbreak, i.e., runtime for a single detection run through the en tire dataset. The av erage run- time for SS is 270.8 seconds, muc h faster than T oT and OLD A (11595 and 3786 seconds respectively) and slightly faster than Lab eled LDA (280.8 seconds). Second, we ev aluate timeliness of detection of the v arious methods. T o ev aluate the performance of SS compared to other methods for detecting disease outbreaks, we plot the a ver age nu mber of day s take n to detect an outbreak and the fraction of outbreaks detected as a function of the allow able false p ositiv e rate in figures (2.b) and (2.c) resp ectiv ely . F or a fixed false positive rate of 1/mon th, a level t ypically con- sidered acceptable b y public health practitioners, it tak es 4.97 da ys on a v erage for SS to detect an outbreak, versus 6.05, 6.44, and 6.34 for T oT, OLDA, and Labeled LDA re- spectively . F or the same fixed false positive rate, the per- cen tage of outbreaks correctly detected was 92% compared to 81%, 77%, 77% for T oT, OLD A, and Labeled LD A re- spectively . Third, we ev aluate the abilit y of Semantic Scan to pre- cisely ch aracterize no ve l outbreaks. This was measured by computing the av erage Hellinger distance (HD) b et ween the true distribution of injected cases and the p oin t estimate of the distribution ov er w ords φ k for the detected topic, as a function of the num b er of days since the start of the out- break. F rom figure (3.a), w e see that SS has the low est HD of all methods. Therefore, we conclude that the distribution φ k of the detected topic was closest to the true outbreak distribution for SS, implying that this approac h is b etter at fitting a topic to nov el emerging trends. F ourth, we compare the accuracy of the identifi ed spatial outbreak regions, measuring the Jaccard ov erlap b etw een the set of detected lo cations and the set of true affected locations, whic h w e call Spatial Ov erlap (SO). As sho wn in figure (3.b), w e observe that SS outp erforms other metho ds as the outbreak days progress. Finally , we compare the accuracy of the online do cumen t assignmen t step by measuring the Jaccard ov erlap b etw een the set of do cumen ts detected to contain the emerging topic the set of do cumen ts which w ere tru ly generated from a mix- ture con taining the emerging topic, whic h w e call Document Ov erlap (DO). F rom figure (3.c), we observ e that SS has the best do cumen t ov erlap, comparable only to T oT which has ! ! 0.4! 0.5! 0.6! 0.7! 0.8! 0.9! 1! 1! 2! 3! 4! 5! 6! 7! 8! 9! 10! 2'33%#4'5(6%.$7#+'( 8"$95'7:(67;( TOT! OLDA! LLDA! SS! ! ! 0! 0.05! 0.1! 0.15! 0.2! 0.25! 0.3! 0.35! 1! 2! 3! 4! 5! 6! 7! 8! 9! 10! *=7$%73(8<'537=( 8"$95'7:(67;( TOT! OLDA! LLDA! SS! ! ! 0! 0.05! 0.1! 0.15! 0.2! 0.25! 0.3! 0.35! 0.4! 1! 2! 3! 4! 5! 6! 7! 8! 9! 10! 6,+"&'#$(8<'537=( 8"$95'7:(67;( TOT! OLDA! LLDA! SS! (a) Hellinger Distances (ED) (b) Spatial Overlap (ED) (c) Document Overlap (ED) ! ! 0! 0.1! 0.2! 0.3! 0.4! 0.5! 0.6! 0.7! 0.8! 0.9! 1! 1! 4! 7! 10! 13! 16! 19! 22! 25! 28! 2'33%#4'5(6%.$7#+'( 8"$95'7:(67;( TOT! OLDA! LLDA! SS! ! ! 0! 0.1! 0.2! 0.3! 0.4! 0.5! 0.6! 0.7! 0.8! 1! 2! 3! 4! 5! 6! 7! 8! 9! 10! *=7$%73(8<'537=( 8"$95'7:(67;( TOT! OLDA! LLDA! SS! ! ! 0! 0.1! 0.2! 0.3! 0.4! 0.5! 0.6! 1! 2! 3! 4! 5! 6! 7! 8! 9! 10! 6,+"&'#$(8<'537=( 8"$95'7:(67;( TOT! OLDA! LLDA! SS! (d) Hellinger Distances (Y elp) (e) Spatial Overlap (Y elp) (f ) Do cumen t Overlap (Y elp) Figure 3: Figures showing the effectiveness of the three stages of detection. The top figures show the av erage Hellinger distance, spatial ov erlap and do cument o verlap as function of outbreak day on the ED dataset. The figures in the b ottom ro w sho w the same metrics on the Y elp dataset. a m uc h higher runtime. In figure (4.a), we show an example of the topics learned on the ED dataset. The 25 background topics were learned from 2003 data, while the 25 foreground topics were learned from a simulated outbreak of ICD-9 co de 623 corresp onding to sexually transmitted diseases (STDs). The figure sho ws the top words based on the maximum probability of their occurrence in the learned topics. W ords ab o v e the hori- zon tal blue line in the figure such as p ain , thr o at , injury , etc. corresp ond to significant words in the bac kground top- ics, while those below the line such as vaginal , irritation , infe ction , etc. ha ve significan t presence in the foreground topics. Some of the foreground topics describ e the disease outbreak very strongly . W ords dominan t in the foreground topics such as vaginal , ble e ding , dischar ge , infe ction , etc. ac- curately ch aracterize the ICD9 co de 623. While these w ords w ere also presen t in the bac kground do cumen ts, their strong co-occurrence in the foreground documents allo w ed us to de- tect and characterize the disease outbreak. Ov erall, we can see that for nov el emerging outbreaks, SS ac hiev es muc h more timely and accurate detection than the competing approaches. 4.3 Y elp Dataset Our second dataset is the Y elp reviews dataset that w as publicly released by Y elp for academic research purp oses 1 . W e limited ourselves to businesses and reviews from Las V egas only . Eac h review was considered as a do cumen t. Its location was associated to the zip code of the business it belonged to. Reviews b efore Jan 1, 2014 were considered as bac kground documents, and reviews after this date formed the set of foreground do cumen ts. In order to create realistic ev ents depicti ng emerging bu si- ness trends, we use the categories that Y elp businesses are associated with. In particular, w e choose 70 categories of 1 Av ailable at h ttp://www.y elp.com/dataset c hallenge restauran ts such as Greek, Bangladeshi, Croatian, Thai, Burmese, etc. F or creating a sim ulated emerging business ev en t to test SS and competing metho ds, we pic k a par- ticular category of restaurants and remov e all reviews cor- responding to this category of restauran ts from the bac k- ground and foreground documents. W e then in tro duce an ev en t corresp onding to surge in a particular type of restau- ran ts in a city neighborho o d by in troducing the heldout re- views for that restauran t t ype int o the foreground corpus. Eac h in troduced even t was as sumed to last thirt y days, with an exp ected 20 ∗ d reviews injected in to the data on the d th da y of the sim ulated ev ent, and affected a circular region consisting of 30 zipco des whose center was randomly sam- pled from the set of zip co des in Las V egas. The prepro cessing steps to clean the business reviews w ere iden tical to those applied to the ED dataset - non- alphan umeric characters w ere replaced with spaces, and all letters were con verted to low er case. One ma jor difference of this dataset from the ED dataset previously an alyzed w as the length of do cumen ts. The reviews for Y elp businesses are m uc h longer than ED chief complain ts, which is reflected in differences in the results, particularly in the da ys tak en to detect an even t. 4.4 Y elp Results The metrics on which we compare the v arious metho ds to Seman tic Scan are identical to those used in analysis of the ED dataset. First, w e compare the run times of the v arious detection algorithms. Figure (2.d) sho ws av erage runtimes of the v ari- ous metho ds per injected even t. The av erage runtime for SS is 1649 seconds, m uc h faster as compared to 43281, 11172, and 2320 seconds for T oT, OLD A, and Lab eled LD A resp ec- tiv ely . Second, we ev aluate timeliness of even t detection of the v arious metho ds. T o ev aluate the p erformance of SS com- Background+Topics+ Foreground+Topics+ Background+Topics+ Foreground+Topics+ (a) ED T opic s (b) Y elp T opics Figure 4: Example background and foreground topics detected from the ED and Y elp datasets. Subfigure (a) sho ws topics learned on the ED dataset during an outbreak of a sexually transmitted disease, while subfigure (b) sho ws topics on the Y elp dataset characterizing the emergence of Mexican restauran ts in a Las V egas neigh borho o d. F or each dataset, w e sho w the top w ords from b oth the bac kground and foreground topics. W ords abov e the horizon tal blue line are top w ords with significant presence in the bac kground topics, while w ords b elo w the line are dominan t in the foreground topics. pared to other methods for detecting emerging business trends, we plot the a v erage num b er of days tak en to detect an ev ent and the fraction of even ts detected as a function of the allo wable false positive rate in figures (2.e) and (2.f ) respectively . F or a fixed false p ositive rate of 1/mon th, it tak es 2.44 days for SS to detect an even t, v ersus 5.71, 3.29, and 4.11 for T oT, OLDA, and Lab eled LD A respectively . F or the same fixed false p ositive rate, the p ercen tage of out- breaks correctly detected w as 97% compared to 85%, 80%, 85% for T oT, OLDA, and Lab eled LDA resp ectiv ely . Third, we ev aluate the abilit y of Semantic Scan to pre- cisely characterize nov el outbreaks. This w as measured via the a verage Hellinger distance (HD) b et w een the true dis- tribution of injected cases and the p oint estimate for the detected topic as described before. F rom figure (3.d), we see that SS has the low est HD of all metho ds, and conclude that the topic detected by SS b est characterized the emerg- ing business even t that was hidden in the data. F ourth, we compare the accuracy of the identifi ed spatial outbreak regions, measuring the Spatial Overlap b etw een the set of detected lo cations and the set of true affected locations. As shown in figure (3.e), we observe that SS out- performs other metho ds esp ecially in the early stages of the emerging ev en t. Finally , we compare the accuracy of the online do cumen t assignmen t step b y measuring the Do cumen t Overlap b e- t ween the set of documents detected to con tain the emerg- ing topic and the true set of injected documents. F rom fig- ure (3.f ), we observe that SS has the best document o verlap. In figure (4.b), w e sho w an example of the background and foreground topics learned on the Y elp dataset. The ev en t in this case corresp onded to a simulated increase in the nu mber of Mexican restaurants in a Las V egas neigh- borho o d. Compared to ED complain ts, Y elp reviews are m uc h longer. While ED complaints tend to describ e the en- tire case in t ypically less than 5 w ords, Y elp reviews span m ultiple sentences. As a result, the background topics tend to be more diffuse than the ED bac kground topics. How- ev er, the foreground topics are similar to the ED foreground topics in that they tend to concen trate on few er sp ecific w ords. In this case, words such as tac os , asada , salsa , chips , etc. ch aracterize the emerging surge of Mexican restaurants through their coo ccurrence in the Y elp reviews. Similar to ED dataset, w e observ e a biclustering of words across the bac kground and foreground topics as seen in figure (4.b). 5. CONCLUSIONS In this pap er, we presen ted Semantic Scan (SS), a nov el framew ork for detecting anomalous patterns in spatio- temporal free text data. Through a comprehensiv e ev al- uation comparing SS with three state-of-the-art methods on tw o real-world tasks, we demonstrated that SS im- pro v es both detection and characterization of nov el emerg- ing even ts. W e demonstrated ho w free text data can b e incorporated into spatial ev ent detection by integrating a no v el con trastive topic model with robust online document assignmen t and spatial scanning, resulting in significan t im- pro v emen ts in detection p o w er and the characterization of the emerging even t. In fact, as compared to many deploy ed systems, the improv ement in timeliness of detection may b e ev en greater in practice, giv en that free-text data is often a v ailable far earlier than the corresp onding structured data (e.g., disease co des in the ED dataset, or business categories in the Y elp dataset). Th us, SS is able to effectiv ely detect and precisely char- acterize emerging even ts. SS discov ers previously unseen anomalous textual patterns without an y man ual interv en- tion, allo wing users of the algorithm to form ulate earlier and more targeted resp onses than current metho ds. Unstruc- tured text information is far more p erv asiv e than structured h uman annotation of even ts. As a result, even t detection systems such as disease surv eillance systems and online busi- ness review p ortals will ha ve access to ever greater quanti- ties of geotagged, unstructured text data, necessitating the need for nov el metho ds for spatial even t detection from free text. W e therefore an ticipate that Seman tic Scan will be emplo y ed b y a v ariet y of users lo oking for a fast, scalable tool for unstructured even t detection. 6. A CKNO WLEDGMENTS This work w as partially supp orted by NSF gran ts I IS- 0916345, I IS-0911032, and IIS-0953330. W e wish to thank Alexandra Chouldec hov a for providing insigh tful criticism on this research pro ject. 7. REFERENCES [1] Matthew Hoffman, F rancis R Bach, and David M Blei. Online learning for Latent Dirichlet Allo cation. In A dvanc es in Neur al Information Pr o c essing Systems , pages 856–864, 2010. [2] D. M. Blei and J. D. Lafferty . Dynamic topic mo dels. Pr o c. 23r d Intl. Conf. on Machine Le arning , 2006. [3] Xuerui W ang and Andrew McCallum. T opics ov er time: a non-Marko v contin uous-time mo del of topical trends. In Pro c e e dings of the 12th A CM SIGKDD international c onfer enc e on Know le dge disc overy and data mining , pages 424–433. A CM, 2006. [4] Jon Kleinberg. Burst y and hierarchical structure in streams. In Pro c. KDD , 2002. [5] Daniel Ramage, Da vid Hall, Ramesh Nallapati, and Christopher D Manning. Lab eled LD A: A supervised topic model for credit attribution in m ulti-labeled corpora. In Pr o c e e dings of the 2009 Confer enc e on Empiric al Metho ds in Natur al Language Pr o c essing , 2009. [6] M. Kulldorff. A spatial scan statistic. Comm. Stat. The or. Meth. , pages 1481–1496, 1997. [7] J. I. Naus. The distribution of the size of the maxim um cluster of p oints on a line. J. Am. Stat. Asso c. , 60:532–538, 1965. [8] M. Kulldorff, E. J. F euer, B. A. Miller, and L. S. F reedman. Breast cancer clusters in the northeast United States: A geographic analysis. Am. J. Epidemiolo gy , pages 161–170, 1997. [9] U. Hjalmars, M. Kulldorff, G. Gustafsson, and N. Nagarw alla. Childho o d leukemia in Sweden: Using GIS and a spatial scan statistic for cluster detection. Stat. Me d. , pages 707–715, 1996. [10] F. Mostashari, M. Kulldorff, J. J. Hartman, J.R. Miller, and V. Kulasekera. Dead bird clustering: A potential early warning system for W est Nile virus activit y . Emer ging Infe ctious Dise ases , pages 641–646, 2003. [11] T. Nak ay a and K. Y ano. Visualising crime clusters in a space-time cub e. T r ans. in GIS , pages 223–229, 2010. [12] M. Kulldorff. Prospective time p erio d geographical disease surv eillance using a scan statistic. J. R oyal Stat. So c. A , pages 61–72, 2001. [13] D. B. Neill, A. W. Mo ore, M. R. Sabhnani, and K. Daniel. Detection of emerging space-time clusters. Pr o c. KDD , pages 218–227, 2005. [14] D. B. Neill, A. W. Mo ore, and M. R. Sabhnani. Detecting elongated disease clusters. Morbidity and Mortality We ekly R ep ort , 2005. [15] M. Kulldorff, L. Huang, L. Pickle, and L. Duczmal. An elliptic spatial scan statistic. Stat. Med. , pages 3929–3943, 2006. [16] L. Duczmal and R. Assuncao. A simulated annealing strategy for the detection of arbitrary shap ed spatial clusters. Comp. Stat. Data Anal. , pages 269–286, 2004. [17] G. P . Patil and C. T aille. Upp er level set scan statistic for detecting arbitrarily shap ed hotspots. Envir on. Ec ol. Stat. , pages 183–197, 2004. [18] T. T ango and K. T ak ahashi. A flexibily shap ed spatial scan statistic for detecting clusters. Intl. J. He alth Ge o gr aphics , 2005. [19] D. B. Neill. F ast subset scan for spatial pattern detection. J. R oyal Stat. So c. B , pages 337–360, 2011. [20] David M Blei, Andrew Y Ng, and Michael I Jordan. Laten t Diric hlet Allo cation. Journal of Machine L e arning R esea r ch , 3:993–1022, 2003. [21] C. W ang, D. Blei, and Dav id Hec k erman. Con tin uous time dynamic topic mo dels. Pr o c. UAI , 2008. [22] X. W ei, J. Sun, and X. W ang. Dynamic mixture models for multiple time series. Pr o c. IJCAI , pages 2909 – 2914, 2007. [23] L. Bolelli, S. Ertekin, and C. Lee Giles. T opic and trend detection in text collections using laten t Diric hlet allocation. Pr oc. ECIR , 2009. [24] T. Iwata, T. Y amada, Y. Sakurai, and N. Ueda. Online m ultiscale dynamic topic mo dels. Pr o c. KDD , 2010. [25] Dan He and D. Stott Park er. T opic dynamics: An alternativ e model of bursts in streams of topics. In Pr o c. KDD , 2010. [26] Jacob Eisenstein, Brendan O’Connor, Noah A Smith, and Eric P Xing. A latent v ariable mo del for geographic lexical v ariation. In Pr o ce e dings of the 2010 Confer enc e on Empiric al Metho ds in Natura l L anguage Pr o cessing , pages 1277–1287. Asso ciation for Computational Linguistics, 2010. [27] Zhijun Yin, Liangliang Cao, Jiaw ei Han, Chengxiang Zhai, and Thomas Huang. Geographical topic disco v ery and comparison. Pr o c. WWW , pages 247–256, 2011. [28] Liang jie Hong, Amr Ahmed, Siv a Gurumurth y , Alexander J Smola, and Kostas Tsioutsiouliklis. Disco v ering geographical topics in the Twitter stream. In Pr o c e e dings of the 21st international c onfer enc e on World Wide Web , pages 769–778. ACM, 2012. [29] T. L. Griffiths and M. Steyvers. Finding scientific topics. PNAS , pages 5228–5235, April 2004. [30] W. R. Hogan, G. F. Co op er, G. L. W allstrom, M. M. W agner, and J. M. Depina y . The Bay esian aerosol release detector: an algorithm for detecting and c haracterizing outbreaks caused by atmospheric release of Bacillus anthracis. Stat. Me d. , 26:5225–52, 2007.
Original Paper
Loading high-quality paper...
Comments & Academic Discussion
Loading comments...
Leave a Comment