GraphPrints: Towards a Graph Analytic Method for Network Anomaly Detection
This paper introduces a novel graph-analytic approach for detecting anomalies in network flow data called GraphPrints. Building on foundational network-mining techniques, our method represents time slices of traffic as a graph, then counts graphlets …
Authors: Christopher R. Harshaw, Robert A. Bridges, Michael D. Iannacone
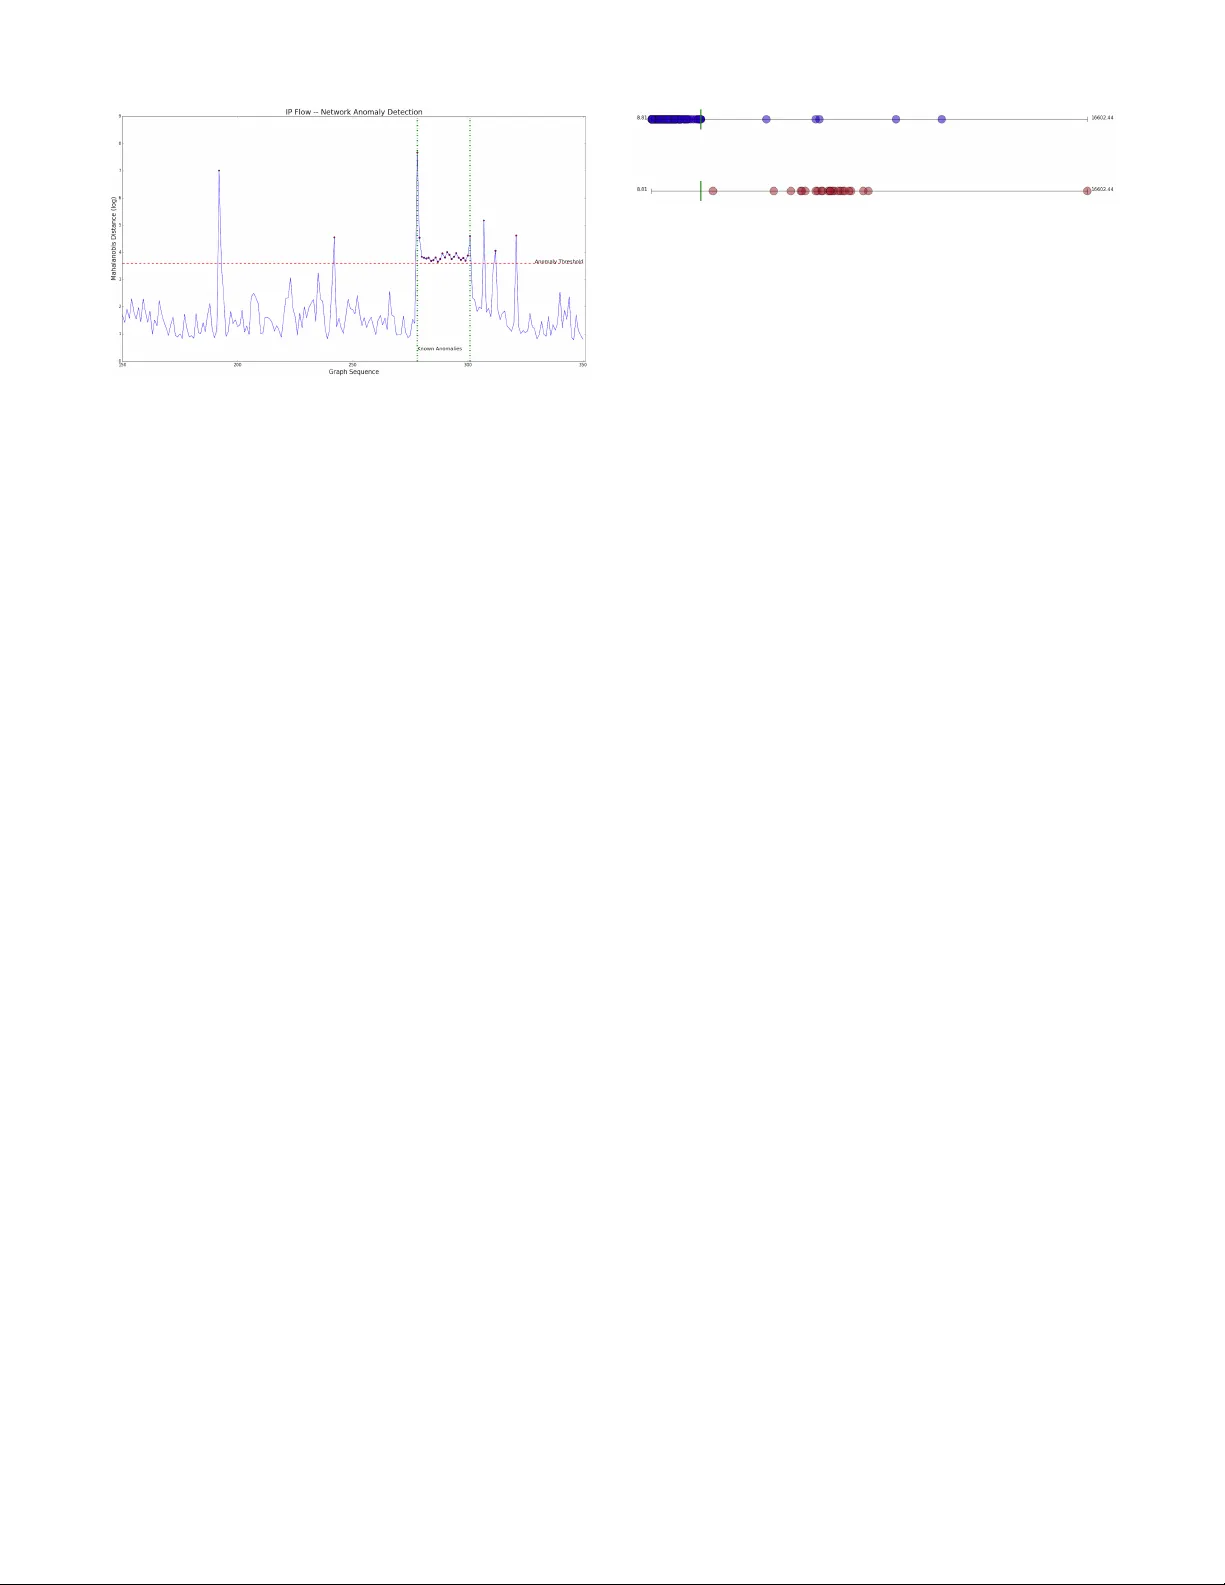
GraphPrints: T o war ds a Graph Analytic Method f or Netw ork Anomal y Detection ∗ Christopher R. Harsha w , 1 Rober t A. Bridges, Michael D . Iannacone, Joel W . Reed, John R. Goodall crh7@rice.edu, {br idgesra, iannaconemd, reedjw, jgoodall}{@ornl.gov} 1 Oak Ridge Institute f or Science & Education Oak Ridge, TN 37831 & Rice University Houston, TX 77005 Computational Sciences and Engineering Division Oak Ridge National Laboratory Oak Ridge, TN 37831 ABSTRA CT This pap er introduces a nov el graph-analytic approac h for detecting anomalies in netw ork flo w data called Gr aphPrints . Building on foundational netw ork-mining techniques, our method represen ts time slices of traffic as a graph, then coun ts graphlets—small induced subgraphs that describe lo- cal topology . By performing outlier detection on the se- quence of graphlet counts, anomalous interv als of traffic are iden tified, and furthermore, individual IPs exp eriencing ab- normal b eha vior are sin gled-out. Initial testing of Graph- Prin ts is performed on real netw ork data with an implanted anomaly . Ev aluation shows false p ositiv e rates bounded b y 2.84% at the time-interv al level, and 0.05% at the IP-level with 100% true p ositiv e rates at b oth. K eywords anomaly detection, graphlet, motif, in trusion detection 1. INTR ODUCTION As gov ernmen t, industry , and priv ate enterprises are in- creasingly dependent on information technology , adequate cyber defensive capabilities are of the utmost imp ortance. Curren tly , defending net w ork ed computing assets relies on t wo primary mechanisms —automated signature-based de- tection systems and manual analysis of cyb er data. While essen tial, these alone are insufficien t. Signature-based detec- tion metho ds (such as anti-virus softw are, intrusion detec- tion systems, and firewalls) identify malicious traffic using heuristics that are usually handcrafted; hence, such metho ds ∗ This man uscript has been authored b y UT-Battelle, LLC under Contract No. DE-AC05-00OR22725 with the U.S. Departmen t of Energy . The United States Gov ernment retains and the publisher, by accepting the article for publication, ackno wledges that the United States Go vernment retains a non-exclusive, paid- up, irrevocable, w orld-wide license to publish or repro duce the published form of this manuscript, or allo w others to do so, for United States Governmen t pur- poses. The Department of Energy will provide public access to these results of federally sponsored research in accordance with the DOE Public Access Plan http://energy .gov/downloads/doe- public- access- plan. Cyber and Information Security Resear ch Confer ence 2016 Oak Ridge, TN A CM ISBN 978-1-4503-3345-0/15/04 . DOI: 10.1145/1235 are only effective when encountering a previously analyzed attac k. In order to gain traction in understanding netw ork activit y , security analysts turn to semi-manual in vestigation of net work data (e.g., firewall logs, pac k et capture data, net- w ork flows, system logs), but are met with an abundance of data and a scarcity of information; for example, flow data alone from a small netw ork will constitute 10-100 million records p er day . Anomaly detection metho ds, which seek to single out unexp ected even ts, prop ose a muc h needed com- plimen t to current metho ds, as they pinp oin t noteworth y ev en ts for further in vest igation and hold the promise of de- tecting nev er-b efore-seen attacks. In this pap er, we introduce Gr aphPrints , a nov el net- w ork anomaly detection algorithm that uses graph analyt- ics to identify qualitativ e cha nges in netw ork traffic at the IP and whole netw ork level. W e concentrate on netw ork flo ws—records of comm unication b et ween a source and des- tination IP address. More sp ecifically , flows give the meta- data (timestamp, IPs, p orts, protocol, etc.) describing com- m unication b et w een a pair of IPs ov er a small time window (see inset table in Section 2). As such, netw ork flo ws are a primary data source for monitoring, diagnosing, and inv es- tigating netw ork traffic. Our metho d divides netw ork traffic in to time slices that are naturally represen ted as a graph. More sp ecifically , a graph G = ( V , E ) is defined as a set of vertices, V (representing entities, IPs in our case), and edges, E (representing relationships b et ween pairs of v er- tices—comm unication betw een IPs in our case.) The Graph- Prin ts metho d mines gr aphlets —small, induced subgraphs, whic h can b e thought of as the building blo c ks of the graph that describ e the local topology—then p erforms outlier de- tection to find those time windows of traffic that exhibit unc haracteristic graphlet coun ts. In order to isolate the spe- cific IPs engaging in unexp ected traffic, for eac h vertex v of a graph, GraphPrints also tracks the graphlet automorphism orbits con taining v (see Section 2.2), which charac terizes the role v ’s IP pla ys in communication patterns. This simul ta- neous detection capabilit y not only identifies time windo ws of anomalous traffic, but also fo cuses the op erator on those IPs in the time window exhibiting unc haracteristic b eha vior. Our hypothesis is that an un usual occurrence in net work traffic will pro duce a detectable change in graphlet counts. T o test this, we implement the multi-lev el detector on real net w ork traffic with an implanted anomaly—a host engag- ing in bit torren t traffic —and report promising results high- ligh ting GraphPrin ts’ p oten tial (Section 3). The GraphPrints metho d builds on foundational work of Milo et al. [3] and Prˇ zulj et al. [5] (among others) where graphlets and automorphism orbits are used for netw ork classification, alignmen t, and comparison. T o the b est of our knowledge, this is the first work to prop ose a net w ork anomaly detection algorithm for the dynamic graph setting based on graphlets and automorphism orbits. W e note that the idea for multi-lev el anomaly detection on time-v arying graph data follows contributions of Bridges et al. [1], which create a generativ e mo del for detection on synthetic graph data at no de, comm unit y , and whole graph levels. Addi- tionally , a position paper of Halappanav ar et al. [2] outlines a netw ork-of-netw ork design for cyber securit y applications and calls for graphlet analysis of flow data, but to our knowl- edge no implemen tation of these ideas has y et b een pursued. 2. GRAPHPRINTS WORKFLO W In order to p erform streaming anomaly detection based on graph analytics, netw ork flow data m ust b e observed, con v erted into a sequence of graphs, and fed to an algo- rithm for ident ifying aberrations in the graph data. This section outlines the steps used in our detection workflo w from tapping netw ork comm unication, to identifying unex- pected time windows of net w ork activit y . T o tap netw ork flow data, we used ARGUS 1 (the Audit Record Generation and Utilization System), an op en source, real-time, net w ork flow mon- itor. The table to the rights con tains an example of a single AR GUS flo w Time 09:58:32.912 Proto col tcp SrcIP 1 92.168.1.100 SrcP ort 59860 DstIP 173.16.100.10 DstP ort 80 T otBytes 1695088 record. Only the fields used in this pap er are display ed. 2.1 Representation of Flow Data as Graphs W e seek to represen t net w ork flo w data in a given time in- terv al as a directed graph (d igraph) G using a v ertex for eac h IP and letting flow records generate edges. T o do this, we create a preliminary graph H with vertices for IP addresses and, naturally , an edge for each flow. More specifically , upon observ ation of a flow record, a directed edge from the source IP’s vertex to the destination IP’s v ertex is created, and w e w eigh t eac h edge by the flow’s total bytes record. F urther- more, we color an edge blue if at least one of the p orts is w ell known (i.e., less than 1024) and red if b oth ports are not well known (1024 or greater). 2 Since multiple flows can occur b et ween the same pair of IPs in the time interv al, H is a multi-digraph, meaning it admits multiple edges b et ween an y pair of vertices, and we aggregate the m ulti-edges to create the desired graph, G . Specifically , for eac h source v ertex i and destination vertex j of H , let B i,j ( R i,j ) b e the sum of edge weigh ts, total bytes, o ver the blue (red) edges from i to j . If B i,j > R i,j ( R i,j ≥ B i,j ), create a blue (red) edge from i to j in G . Thus our final graph, G , has colored, 1 h ttp://qosien t.com/ 2 The most common TCP and UDP traffic will hav e a desti- nation (or source) p ort of a w ell-kno wn port num b er, with the source (or destination) p ort b eing a randomly chosen “high” p ort num b er. T raffic that has both p orts outside of this range is typically either a less-common protocol, or a common protocol configured in an uncommon w ay . Figure 1: Graphlet & Orbit Counting Example directed, and unw eighted edges represen ting the collection of flo ws observed in the time interv al. 2.2 Graphlet & Orbit V ectors T o capture a netw ork’s b eha vior ov er time, we examine gr aphlets —small, connected, induced subgraphs of the net- w ork. Graphlets are an imp ortan t netw ork characteristic because they capture the lo cal top ology of the netw ork. F or instance, observing man y stars or many paths (see Figure 1) pro vides an understanding of the ov erall structure of the net w ork [3, 5]. Giv en a graph G i from time windo w i , we coun t the o ccurrences of all graphlets up to size k , and store these graphlet coun ts in a gr aphlet de gre e ve ctor , denoted g i . See Figure 1 for an example graph G i with graphlet degree v ector g i . The notion of graphlets is easily extended to in- clude colored vertices and edges as well as directed edges, as is our curren t int erest. In this case, top olog ically equiv- alen t graphlets with different colorings are considered dif- feren t. While coloring allo ws encoding of contextu al infor- mation, the n um ber of graphlets grows comb inatorially with the num b er of colors, whic h can pose issu es of computational cost or memory usage. T o capture a vertex’s b eha vior ov er time, we will examine graphlet automorphism orbits . 3 The automorphism orbits of a graph are sets of vertices that are symmetric in the graph. In tuitiv ely , the automorphism orbits are the different roles a v ertex can fill in that graph; for instance, a star has tw o automorphism orbits—one for the center vertex and one for the leaf vertices. The orbit ve ctor of v is a vec tor whose en tries are the counts of the graphlet automorphism orbits in whic h v participates. Given a graph G i and a v ertex v , w e denote the orbit vector of v in G i as a i v (see Figure 1). Orbit vectors are useful characteristics b ecause they des cribe a v ertex’s extended neighborho od in a graph. F or instance, a v ertex who appears in the center of many stars is likely differen t from a vertex who app ears alwa ys as a leaf. T o summarize the workflo w up to this p oin t, netw ork flow data is observed in near real time, and is represented as a sequence of graphs, G 1 , G 2 , . . . . F or a giv en graph G i , graphlet vectors g i c haracterize the net w ork at the graph- lev el (i.e., changes ov er the whole time-windo w of netw ork activit y) and the orbit vectors a i v c haracterize the net work at the v ertex level. As an analogy , graphlet v ectors are like handprin ts and orbit v ectors are like fingerprints , hence the term Gr aphPrints . There are sev eral a v ailable tools to coun t 3 The automorphism orbits of G = ( V , E ) form a partition of V where v ertices u and v are in the same orbit iff there exists a graph automorphism f : V → V that takes u to v . graphlets. In this study , w e used F anMod 4 [8]. W e note that in the F anMod implementation there is no extra computa- tion to coun t g raphlet automorphism orbits as this is already a step in the process of graphlet coun ting. 2.3 Anomaly Detection Framework In order to p erform detection at the graph level, we fit a multiv ariate Gaussian to the set of previously observed graphlet degree vectors, { g i } n i =1 using a technique that is robust to outliers. Because our historical netw ork data may con tain (discov ered or undiscov ered) anomalies, w e use the Minimum Covarianc e Determinant (MCD) metho d, whic h can identify the “best fit” mean and cov ariance in the pres- ence of up to 50% outliers. More specifically , the user pro- vides a num b er h b et ween n/ 2 and n of pure (i.e., non- anomalous) data p oin ts, and the algorithm finds the ellip- soid of leas t v olume that co vers h p oin ts. 5 This is equiv alent to fitting a Gaussian distribution to h of the data points, and omitting n − h outliers; hence our distribution will not b e sk ewe d by up to ( n − h ) /n percent of arbitrarily bad data points. Up on receipt of the next time-windo w’s graphlet v ector, g n +1 w e compute the Mahalanobis distance, 6 whic h scores how anomalous the new vector is—high scores for v ery anomalous data, low scores for relativ ely common data, according to the Gaussian distribution. W e reference inter- ested readers to algorithmic details of MCD by the creators, Rousseeu w et al. [6]. Our implementation used the SciKit- Learn MinCo vDet mo dule [4]. 7 T o demonstrate the usefulness of orbit vec tors in IP flow analysis, w e c haracterize normal vectors via an unsup ervised clustering algorithm ( k -means), and use a vector’s distance to cluster centers as an anomaly score. The k -means al- gorithm is an unsup ervised learning algorithm that, given positive integer k , partitions the data into k clusters via a greedy metho d. T o bui ld a detector, w e first learn the cluster cen ters (centroids) by running k -means on a set of observed data points. Next, give n a (newly observ ed) orbit v ector, we determine its anomaly score b y considering its distance to the nearest centroid. In this study , we used the gap statistic to c hoose the v alue of k used in k -means [7]. Details of our detection exp erimen t and results are giv en in Section 3. 3. EXPERIMENT AL SETUP & RESUL TS F or a demonstration dataset, netw ork flow data w as col- lected from the main netw ork switc h of a small office building in a campus environmen t, during a typical workda y . This traffic includes b oth wired and wireless subnets, as well as a small datacen ter with man y virtual machi nes (VMs), on a separate NA T-ed netw ork. This collection of flows serves as ambien t traffic. T o create a known anomaly , the ambi- en t traffic is combined with a separately-recorded session of bit torrent flo ws from a single host. As bit torrent partic- ipation is disallo wed on the office net work, the bit torrent 4 h ttp://theinf1.informatik.uni- jena.de/motifs/ 5 Once the ellipsoid, E = { x : ( x − µ ) t Q ( x − µ ) ≤ 1 } ( µ ∈ R p , Q ∈ R p × p positive definite), is found, the corresponding Gaussian has mean µ , and cov ariance Σ = Q − 1 . 6 Giv en mean µ and cov ariance Σ, the Mahalanobis distance is defined of x is ( x − µ ) t Σ − 1 ( x − µ ) and is (inv ersely mono- tonically) equiv alen t to finding the v ector’s p -v alue. 7 h ttp://scikit- learn.org/stable/modules/generated/sklearn. co v ariance.MinCo vDet.h tml traffic should b e abnormal. F urthermore, we exp ect bit tor- ren t traffic to demonstrate a similar topology to other, more concerning t ypes of traffic, such as peer-to-p eer botnet com- m unication or distributed denial of service attacks , which w ould be problematic to generate in a real netw ork setting. T o implant the bit torren t traffic the flows’ tim estamps w ere offset, and the host and router IP addresses m apped to their analogues in the building’s subnet. Finally , the bit torren t flo ws are shuffled into the am bien t traffic respecting th e time sequence of all the data. In total, this dataset included 10,507 IP addresses of which 2,795 IP addresses are within the building’s subnets. These included 151 IPs on the eth- ernet netw ork, 491 IPs on the wireless netw ork, and 2,153 IPs in the datacenter. As discussed in Section 2.1, we now represent the data as a sequence of graphs, ( G i ), with time windows of 31 seconds with one second o v erlap. In total, w e observed 350 graphs, a ve raging 1,265 no des and 4,901 edges p er graph of which 76% were red indicating more data was sent betw een high port connections than otherwise. Additionally , there w ere on a ve rage 4,929 non-empty flo ws per time interv al; hence , most colored edges represent a single flow. Zo oming in on the bit torren t traffic, we find 40 interv als (no. 278-317 in Figure 2) in whic h at least a single flow was attributable to bit torren t traffic. Of these, the first 24 time windows con tained roughly 15% bit torrent flo ws, while the latter 16 in terv als had only contained 2% bit torren t flows. F or testing, we consider these 24 in terv als true p ositiv es at the graph lev el, and the vertex engaging in the bit torren t activity during those interv als a true p ositiv e at the node level. As the goal of an anomaly detector is to pinp oin t abnormal ev ents, we consider a sub stan tial change in netw ork activity to b e a true positive, even if not necessarily malicious. Additionally , we are una ware of what, p ossibly bizarre, activity is present in the rest of the data. Graphlets of size three and corresp onding automorphism orbits are counted to create the sequence of graphlet degree v ectors g i and a sequence of orbit coun t vectors for eac h ver- tex v , a i v (see Section 2.2). Using the MCD algorithm (Sec- tion 2.3), we fit the initial Gaussian to the first 150 graphlet v ectors. F or each subsequent vec tor, we score anomalous- ness using Mahalanobis distance and re-fit the Gaussian to include the new data p oin t. In this study , h = 0 . 85 n . See Figure 2, which gives a plot of the anomaly score for each time windo w. A suggested threshold is displa yed in red, and is cho sen to maximize the known true-p ositiv es while mini- mizing the num b er of other p oin ts ov er the threshold. Since the kno wn anomalies are easily discriminated from the ma- jorit y of the traffic, suc h a threshold obtains p erfect true pos- itiv e rate, zero false negatives, and we see 5 of 176 unknown anomalies detected. This b ounds our graph-level false posi- tiv e rate by 2.84%. Although we hav e not pro ven causalit y , initial inv estigation of these unknown anomalies revealed an IP scan of a VM subnet; hence, these may indeed b e true (but previously unknown) p ositiv es. F urther inv estigation of these detected anomalies will be included in future work. F or no de-lev el detection, we randomly sample 40 IPs with probabilit y prop ortional to their vertex’s o ccurrence in the data, then cluster their orbit vecto rs’ from the first 150 time in terv als. As describ ed in section 2.3, we use the gap statistic and choose k = 5 for K-means clustering. F or the remaining 200 time interv als the distance of these 40 IPs’ orbit vectors to the nearest cluster centroid is plotted on the top line of Figure 2: Graph-Lev el Detection Results Note: Log-Mahalanobis distance of graphlet vectors shown.Th reshold chosen to maximize known anomalies, while minimizing detection of other p oin ts. T rue-positive rate = 100%. F alse p ositiv e rate = 2.84%. Figure 3 (blue dots), while just below, the red dots represent the nearest-cen troid distances of orbit v ectors corresponding to the kno wn anomalous vertex. As in the graph-lev el analy- sis, an appropriate threshold that detects all known anoma- lies is indicated by the green bars. W e note that only 4 of 8000 vectors from the unknown time in terv als are detected as anomalous, b ounding our false p ositiv e rate by 0.05%. F urthermore, the clear disparity in scores exhibited by the kno wn anomalies p ermits zero false negatives at the node lev el also. These preliminary results sho w that graphlet vectors can indicate when anomalies o ccur in the netw ork, and orbit v ectors can identify wher e these anomalies occur. 4. CONCLUSION AND FUTURE WORK Our ev aluation of GraphPrin ts exhibited 2.84% and 0.05% false p ositiv e rates at the graph and no de levels, resp ectiv ely , with 100% true p ositiv e rate at b oth. This confirms that notew orth y c hanges in net work traffic are iden tifiable using only coun ts of 3-graphlets / orb its. F urthermore, the disco v- ery of unexpected anomalies illuminates an important area of future research for GraphPrints—ho w to trace a detected ev en t to (1) particular graphlet / orbit counts, and (2) the specific net wo rk traffic that is abnormal. As the Graph- Prin ts method admits colored no des, important contextual information—suc h as an IP’s membership in a known sub- net, ASN, or country co de—can b e encoded via no de col- oring, and we exp ect future inclusion of this information to yield more informative results. Finally , we b eliev e fur- ther inv estigation of the node-level clusters will allow us to c haracterize differen t types of user b eha vior; for example, perhaps one cluster is comprised of the orbit vectors asso ci- ated with using email, while another those of web browsing. In summary , this work presents a graph analytic metho d with promising initial results for analyzing, detecting, and c haracterizing net work flo w data, where noteworth y changes in net work behavior are identifiable at multiple levels with exceptionally low false p ositiv e rates. 5. A CKNO WLEDGMENTS This material is based on research sp onsored by: the U.S. Departmen t of Homeland Security (DHS) under Grant Aw ard Figure 3: No de-Lev el Detection Results Note: Distance of orbit vec tors from nearest cen troid depicted. Un- known vectors in blue dots. Known anomalies in red dots. Thresh- old chosen to maximize kno wn anomalies, while minimizing other de- tected p oin t. T rue-positive rate = 100%. F alse positive rate = 0.05%. Num ber 2009-ST-061-CI0001, DHS Science and T echn ology Directorate, Cyber Securit y Division (DHS S&T/CSD) via BAA 11-02; the Departmen t of National Defence of Canada, Defence Research and Developmen t Canada (DRDC); the Kingdom of the Netherlands; and the Department of En- ergy (DOE). The views and conclusions contained herein are those of the authors and should not b e in terpreted as necessarily rep resen ting the official policies or endorsemen ts, either expressed or implied, of: the DHS; the DOE; the U.S. Go v ernmen t; the Department of National Defence of Canada DRDC; or the Kingdom of the Netherlands. 6. REFERENCES [1] R. A. Bridges, J. P . Collins, E. M. F erragut, J. A. Lask a, and B. D. Sulliv an. Multi-lev el anomaly detection on time-v arying graph data. In Pr o c e e dings of the 2015 IEEE/A CM International Confer enc e on A dvanc es in So cial Networks Analysis and Mining 2015 , pages 579–583. ACM , 2015. [2] M. Halappana v ar, S. Choudhury , E. Hogan, P . Hui, J. Johnson, I. Ray , and L. Holder. T o wa rds a net w ork-of-net w orks framew ork for cyber security . In Intel ligenc e and Se curity Informatics (ISI), 2013 IEEE International Confer enc e on , pages 106–108. IEEE, 2013. [3] R. Milo, S. Shen-Orr, S. Itzk o vitz, N. Kashtan, D. Chklo vskii, and U. Alon. Netw ork motifs: simple building blo c ks of complex netw orks. Scienc e , 298(5594):824–827, 2002. [4] F. Ped regosa, G. V aroquaux, A. Gramfort, V. Michel, B. Thirion, O. Grisel, M. Blondel, P . Prettenhofer, R. W eiss, V. Dub ourg, J. V anderplas, A. Pas sos, D. Cournapeau, M. Bruc her, M. Perrot, and E. Duc hesnay . Scikit-learn: Machine learning in Python. Journal of Machine Le arning R ese ar ch , 12:2825–2830, 2011. [5] N. Prˇ zulj, D. G. Corneil, and I. Jurisica. Modeling in teractome: scale-free or geometric? Bioinformatics , 20(18):3508–3515, 2004. [6] P . J. Rousseeu w and K. V. Driessen. A fast algorithm for the minimum cov ariance determinant estimator. T e chnometrics , 41(3):212–223, 1999. [7] R. Tibshirani, G. W alther, and T. Hastie. Estimating the n umber of clusters in a data set via the gap statistic. Journal of the Roya l Statistic al So ciety: Series B (Statistic al Metho dolo gy) , 63(2):411–423, 2001. [8] S. W ernick e and F. Rasche. F anmod: a to ol for fast net w ork motif detection. Bioinformatics , 22(9):1152–1153, 2006.
Original Paper
Loading high-quality paper...
Comments & Academic Discussion
Loading comments...
Leave a Comment