Reality Mining with Mobile Big Data: Understanding the Impact of Network Structure on Propagation Dynamics
Information and epidemic propagation dynamics in complex networks is truly important to discover and control terrorist attack and disease spread. How to track, recognize and model such dynamics is a big challenge. With the popularity of intellectuali…
Authors: Yuanfang Chen, Noel Crespi, Gyu Myoung Lee
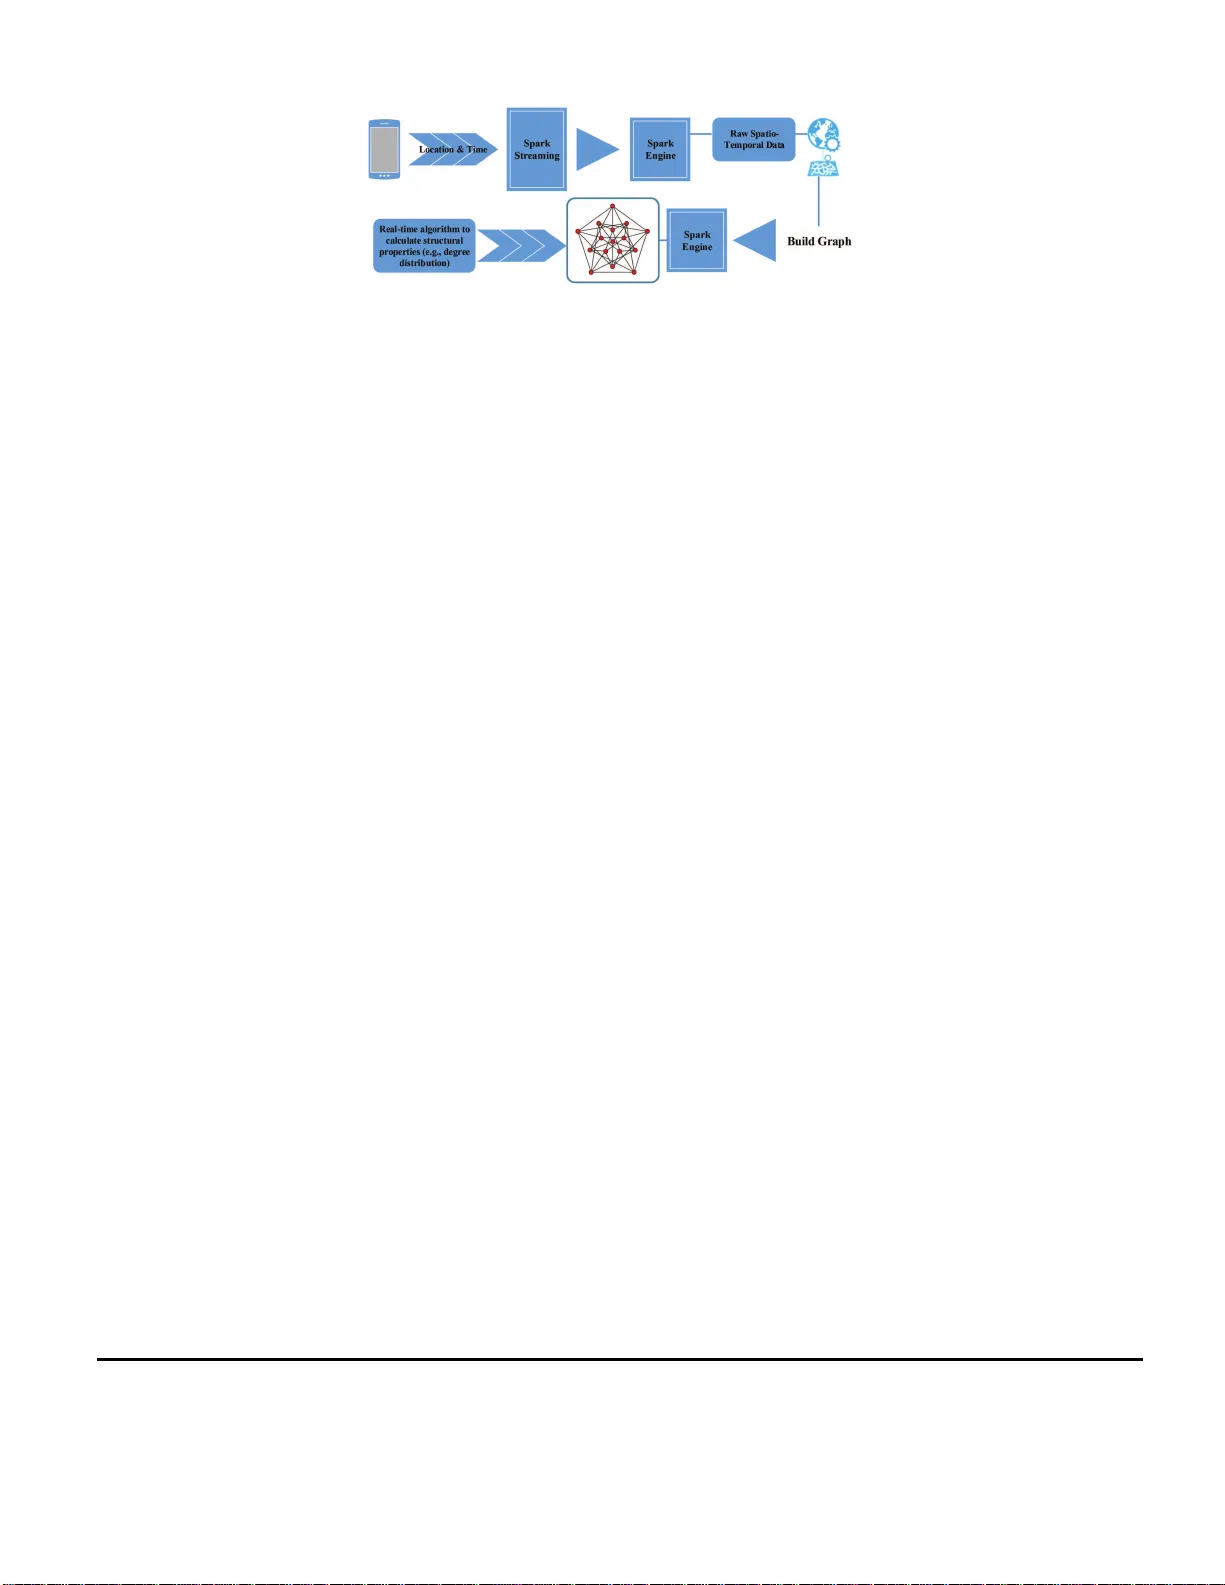
1 Reality Mining with Mobile Big Data: Understand ing the Impact of Network Structure on Propagation Dynamics Y uanfang Chen † , Noel Cres pi † , Gyu Myo ung Lee ‡ † Institut Mine s-Télécom, Téléco m SudParis, France † Department of Co mputer Scien ce, Uni versité Pierre et Ma rie CURIE, F rance ‡ Li verpool John Mo ores University , Liv erpool, UK Email: yuanfang_ chen@ieee .org, noel.crespi@mines-telec om.fr , G.M.Lee@ljmu.ac.u k Abstract Information and epidemic propagation dynamics in complex networks is truly important to discov er and control terrorist attack and disease spread. How to track, recognize and model such dynamics is a big challenge. W ith the popularity of i ntellectualization and the r apid de velopme nt of I nternet of Things (IoT), massiv e mobile data is automatically collected by mil lions of wireless devices (e.g., smart phone and tablet). In this arti cle, as a typical use case, t he impact of network structure on epidemic propagation dynamics is in vestigated by using the mobile data collected from the smart phone s carried by the volunteers of Ebola outbreak areas. On this basis, we propose a model to recognize the dynamic structure of a network. Then, we introduce and discuss the open issues and future work for de veloping the proposed recognition model. I . I N T R O D U C T I O N Inform ation and epidem ic propa gation dynamics [1], [ 2], [3], [ 4] has been extensively studied by n etwork-enab led science, e. g., graph th eory , network theory and probab ility theory . When info rmation and epidemic prop agation is modelled over network s, it is usual to a ssume that th e prop agation h as the same p robability over lin ks. Even if d ifferent link s have re spectiv e propag ation probab ilities, such modellin g is not enou gh to reflect the rea l pr opagation patter n in the physical world . As the impo rtant f eature of n etworks, ne twork structure n eeds to be co nsidered [5]. For example, the patter ns of prop agation are different in a scale-free network a nd a network with heavy-tailed distribution. It is an open issue whether the structu re of complex networks u nderlies the propag ation dynam ics of infor mation and epidemic [6]. Despite a lack o f direc t experimenta l e vidence supportin g such “structur e-prop agation” hypoth esis, a numb er of theoretical studies have sho wn that the topo logical structure of complex networks (scale-free and small-world topologies) leads to markedly different pr opagation dy namics com pared with the predicted by standar d pro pagation m odels. For examp le, in the literatu re [7], Michael Small et al. examin e th e glob al spatio-temp oral distribution of avian influen za cases in bo th wild an d domestic birds, and they find that the c ases an d the links between the cases d uring an outbre ak form a scale-fr ee network . I t means that such avian influenza outb reak will contin ue to propag ate even with a vanishingly small pro pagation ra te. In c ontrast, with stan dard m athematical m odels of disease prop agation [8], th e p ropagatio n of this avian influ enza has been controlled a nd ev en h as halted. It makes th e best time to vaccination be missed, and th e risk of second outbreak be increa sed. Based on the above description , under standing the imp act of network stru cture on pro pagation d ynamics is very importan t, and recog nizing the dy namic structure of a n etwork is a gap for the previous studies of pr opagation dynamics. This article revie ws the advance of prop agation dyna mics, and then as a typical use case we investigate th e im pact of network structure on ep idemic p ropaga tion dyn amics based o n the mob ile d ata collected from th e G PS-enabled wireless d e vices carried by volunteer s ( Fig. 1 illustrates an exam ple). On this basis, we propose a model to recog nize th e dyn amic structure of a network . Finally , open issues and f uture work are provid ed and discussed fo r dev elopin g the prop osed r ecognition model. Fig. 1: Con tact Tracing m odule of Ebola Care [9 ]. It ca n track ev eryon e who cam e in d irect contac t with a sick Ebola patien t. The c ollected data by this APP is shar ed with the WHO ( W orld Health Organization) , who is using info rmation from hun dreds of aid organ izations to make big strategic decisions. 2 I I . A D V A N C E O F P RO PAG AT I O N D Y NA M I C S It is im portant to und erstand the pro pagation processes arising over the networks with different structu res, for example, knowledge mining: h ow a beh aviour on a network with a special structur e to im pact the nod es of the network, and such understan ding is helpful to mo del th e beh aviour as well. In recent years, there is an increasing effort to study propag ation dynamics based on a variety o f co mplex networks. Recent achievements can be d i vided into two categories b ased on different types of n etworks: • Propagatio n dyn amics on social networks [10]. On su ch network s, info rmation is the m ain research target. Expo nential and power -law m odels tha t reflect network structur e have b een widely used to mod el the dynam ics o f info rmation prop agation. • Propagatio n dynam ics on co ntact networks [ 11]. A conta ct network d escribes the real r elationships among individu- als/ecosystems in the ph ysical world. Based on the real relationsh ips from the physical world , the propa gation dynamics on contact networks is d ifferent from th e prop agation dy namics on social networks. W ith the dev elopmen t of the IoT (Intern et of T hings) an d the h elp o f various sen sors and wireless d evices, some research ers have p aid th eir attention to this propag ation dy namics, and have obtaine d some achievements in: ( i) the pr opagatio n o f inf ectious d iseases, an d ( ii) the p ropagatio n of con taminants. Ana lyzing and studyin g the dyn amics of prop agation among individuals/ecosystems can help us to un derstand an d control the dy namic behaviours on th ese real networks. As a n imp ortant aspec t of prop agation dynamics, th e th eoretical studie s on the “stru cture-pr opagatio n” hypothesis are classified into two classes: info rmation- related an d epidemic-r elated pro pagation dyn amics on respective complex n etworks. As the im portant recent achievements in in formatio n-related pro pagation dy namics [1], Jure Leskovec et al. ob tain th ree interesting observations, a long with tracking informatio n pr opagatio n amo ng m edia sites a nd blogs: (i) the in formation path ways for gen eral rec urrent topics are mo re stable across time tha n for on- going n ews ev ents. It m eans that the f ormer h as a mo re stable network structure. (ii) Clusters o f n ews media sites and blogs often emerge a nd vanish in a matter of day s for on -going news ev ents. From this observation, we c an acq uire that hub nod es (clusters) ar e existent in an info rmation pro pagation network. As the key elemen t to reflect n etwork structu re, th e clusters are dy namically change d over tim e, and different informa tion prop agation networks are with different clusters. And (iii) m ajor events, for example, large-scale ci vil un rest such as Liby an c i vil war and Syrian up rising, incr ease the n umber of infor mation pathways amon g blogs, and also increase the n etwork ce ntrality of blog s and social media sites. Moreover , as a kind of h armful in formation pr opagation , malware/virus pro pagation dynam ics is also an importan t research issue. Guan hua Y an et al. in vestigate the ch aracteristics of malware propag ation in online social n etworks based on a data set collected from a r eal-world location- based online social network, which in cludes not only the social graph formed by its users but also the activity events of these users. And furth er , they stud y the im pact of social structure o n malware propag ation dy namics in o nline social networks. This ach iev ement is to deeply u nderstand the impact o f onlin e so cial ne twork structure on malware propa gation dynam ics. For the recen t achievement in epidem ic-related pr opagation dynam ics [12], Louis Kim et al. p ropose a p arameter estimation method by learn ing network characteristics and d isease d ynamics. And this meth od is applied to th e data collecte d d uring the 2009 H1 N1 epidemic, a nd on this basis, th ey find the outbreak network is best fitted into a scale-free n etwork. This find ing implies tha t random vaccination alone will not efficiently halt the pr opagation of influ enza, and instead vaccination sh ould be based on und erstanding the propag ation dynamics of ep idemic with exploiting th e special struc ture o f network. Moreover , as an importa nt a spect of epid emic-related prop agation dynamics, quantifyin g and predicting disease d ynamics during epidem ics is very impo rtant to public health in a llocating public hea lth r esources and in r espondin g to pub lic h ealth ev ents. The infected nu mber R can be u sed to quan tify the disease dynam ics during an epidem ic. For studying the quan tized disease dynamics, a wide range of methods ha ve been proposed to est imate or predict the param eter R based on the assumption s of network structure, e.g., the contact networks for the spread of disease are best described as ha ving exponential degree distrib utions. Howe ver , n etwork structur e is tim e-varying along with the pro pagation of inf ormation an d epidemic on the network. It is necessary to reco gnize the dy namic structure of such network. For examp le, for imp roving the ac curacy o f estimating and predicting for R during an ep idemic in a network , the dy namic stru cture of the network ne eds to be mined . I I I . I M PAC T O F N E T W O R K S T R U C T U R E O N P RO PAG AT I O N D Y NA M I C S As a ty pical use case, the imp act of network structure on epid emic prop agation dy namics is inv estigated based on the contact network o f Ebola outb reak in 2 014. W ith th e w ireless co mmunica tion devices held by volunteer s of epidem ic areas, the voluntee rs repo rt new cases (co nfirmed and suspected cases), correspon ding locations, and relationships between these cases, and then, these reported cases with corresponding locations can b e used to build th e contact n etwork (an example is shown in Fig. 2). Dur ing an epid emic, the network is time- varying alon g with the pro pagation of an infe ctious disease, with th e orde r of time stamps o f reports. The co ntact network can be mo delled as a dy namic graph G t . The weig ht w { i,j } is the tra nsmission prob ability ( p { i,j } ) of a disease fro m vertex i to vertex j (o n the correspon ding edge e { i,j } ). 3 4 6 8 10 12 14 −15 −10 −5 0 5 X Y 4 6 8 10 12 14 −15 −10 −5 0 5 Fig. 2: An examp le of the contact network d uring an epidemic. This examp le displays 5 0 cases and their relatio nships (co ntact). X and Y deno te the relative location s of cases. Th ese cases come from three typ ical cou ntries and seven regions of the Ebola outbreak in 20 14. Three countrie s ar e: Guinea, Nigeria an d L iberia. Seven region s are: Guec kedou, Mace nta, Kissidougo u, Conakry , Monr ovia, Lago s and Port Harcour t. T he black n odes of this network are ca ses (suspected a nd confir med) a nd if there is an edg e between two nodes, it mean s th at there is con tact b etween the individuals o f the two cases. A. Outb r eak Data The o utbreak d ata of Ebola in W est Afr ica fro m March 201 4 is used as real surveillanc e data to analy ze the imp act o f network structure on pr opagatio n d ynamics. As a latest o utbreak of d isease, un til Februar y 15 , 201 5, Ebola V iru s Disease (it is comm only known as “Ebo la”) has killed 9380 p eople, and the to tal cases have reac hed 232 53. Researchers gen erally believe that fro m a 2- year-old boy of Gu inea to his mother, sister and gran dmother (a contact network) , Ebola rapid ly spre ads in W est Africa from Mar ch 20 14. The rep orted Ebo la cases with time series and lo cation inform ation a re co llected by the W o rld Health Organizatio n (WHO), as well as the ministries of health of epidem ic coun tries. An d in this stud y , we select p art o f data f rom three typical outb reak countries, Guinea, N igeria and Liberia. Guinea is the so urce of this o utbreak and is with relatively high quan tity of confirm ed cases ( 2727, as of Febr uary 15, 201 5), and Nigeria is far away fro m the so urce o f the o utbreak , and is with relatively low quantity of confirmed cases (19, as of February 1 5, 2015), an d Liberia is close to the source of the o utbreak , a nd is with high quantity o f confirmed cases (3149 , as of Feb ruary 1 5, 2015 ). An d seven region s o f these three co untries are: Gu eckedou of Gu inea, Macenta of Guine a, Kissidou gou of Guinea, Conakry of Guinea, Monr ovia of Liberia, Lag os of Nigeria, and Port Har court of Nigeria. And these variables ar e included in the outbre ak da ta: ( i) Case ID. A uniqu e nu mber indicates a case. (ii) Sourc e I D. A so urce id ind icates the source o f infe ction for a case. (iii) Date. It is the date that a case is re ported. (iv) L ocation. It ind icates the coordin ates (lon gitude and la titude) of a rep orted case. B. Results a nd Analysis T o evaluate the impac t of network structur e on disease dyn amics, the basic an d impo rtant structural kn owledge of networks, degree d istribution, is m easured for the contac t n etwork that is studied in th is article. In a network, the degree o f a node is basic stru ctural knowledge, and it indicates the number o f adjacen t ed ges of the nod e. The d egree distribution is the pro bability distribution of degrees over the network. It g iv es the overall structural informa tion of th e network. For a real-world network, there are com plex relationship s amon g node s. The degree distribution is helpful to characterize and mo del a real-world ne twork. On this basis, the structur al k nowledge of a complex network can be ac quired and formu lated. The for mulated knowledge can be used to analy ze and so lve network -related pr oblems. In this article, we analy ze the degree d istribution o f the contact network ac quired fr om the co llected Eb ola outbr eak d ata, by condu cting th e maximu m-likelihood fitting to fit the calculated degree distribution of the network in to exp onential, normal, poisson and p ower -law distributions, and calculatin g and compa ring the estimated standard deviations and the estimated variance- covariance matrices of these fittin gs. Figure 3a illustrates the d egree distribution o f th e contact network built by Ebo la ou tbreak d ata. On Fig. 3a basis, for analy zing the degree d istribution of co ntact n etwork, m aximum- likelihood fitting is conducted to fit the d egree distribution in to exponential, normal, poisson a nd power -law distributions, and then the estimated standar d deviations and the estimated variance-covariance 4 matrices of these fittings are measured to qu antify “how many d ifference between two different distributions”. The results of fittings are illustrated in Fig. 3b. 0 5 10 15 20 25 30 0.0 0.1 0.2 0.3 0.4 0.5 0.6 Degree(x) P(x) 0 5 10 15 20 25 30 0.0 0.1 0.2 0.3 0.4 0.5 0.6 (a) Degree distribution of the contact network built by Ebola outbreak data. There are 942 nodes and 938 edges in this network. The black spots are the probability distribution of nodes’ degrees. 5 10 15 20 0 200 400 Exponential distribution Degree Frequency 5 10 15 20 0 200 400 5 10 15 20 0 200 400 Normal distribution Degree Frequency 5 10 15 20 0 200 400 5 10 15 20 0 200 400 Poisson distrib ution Degree Frequency 5 10 15 20 0 200 400 5 10 15 20 0 200 400 Po wer−law distribution Degree Frequency 5 10 15 20 0 200 400 (b) Maximum-likelihood fitting of degree distributions. The degree distribution of contact network is fi tted into expo nential, normal, poisson and po wer-la w distributions with maximum-likelihoo d fitting. The black spots indicate the probability distribution of nodes’ degrees, and the red lines are the corresponding fittings for expon ential, normal, poisson and po wer-law distributions. Fig. 3: Degree distribution a nd maximu m-likelihood fitting for th e co ntact network of Ebo la ou tbreak In Fig. 3, the results show that the degree distribution of contact ne twork is approx imate to the exponential d istribution with λ = 0 . 50159 915 . For d ifferent distributions, based on the maxim um-likelihood fitting, the results of param eter estimation are listed as fo llows: (i) the rate parameter λ = 0 . 5 01599 15 f or the expon ential distribution, (ii) µ = 1 . 9 93623 80 and σ = 2 . 77 9146 91 for th e normal distribution, (iii) λ = 1 . 99 36238 fo r the poisson d istribution, and (iv) x min = 2 an d α = 2 . 80397 3 for the power -law distribution. T able I shows the estimated stand ard deviations and th e estimated variance-covariance matr ices o f these fittings. T ABLE I: Estimated stan dard deviations an d estimated variance-covariance matrices for d ifferent fittings Distribution Standard deviation V ariance-covariance matrix Exponential λ (rate parameter): 0.01635166 r ate par ameter r ate par ameter 2 . 673769 e − 04 Normal µ (mean): 0.09059760, σ (standard deviation (sd)): 0.06406218 mean sd mean 0 . 008207925 0 . 000000000 sd 0 . 000000000 0 . 004103963 Poisson λ (lambda): 0.0460285 lambda lambda 0 . 002118623 Power -law x min + α : 0. 03831463 NULL Comparing the estimated stan dard d e viations and e stimated variance-covariance matrices listed in T a b . I, th e min imum standard deviation f or these fittings is 0 . 01635 166 . T his m inimum standa rd deviation is correspon ding to the expone ntial distribution with the rate par ameter λ = 0 . 5 0159 915 . Howe ver, based on the d escription of th e network th at is studied in th is article, th e conta ct network is time -varying alo ng with the p ropag ation of inf ectious disease. As an examp le, the analysis resu lts of the subn etwork that is with 9 6 time per iods of August 26th, 201 4, ar e shown in Fig. 4 and T ab . II. By the max imum-likelihoo d fitting fo r the subnetwork, the results of p arameter estimation for different d istributions are : (i) the rate parameter λ = 0 . 74 79674 8 fo r the expo nential distribution, (ii) µ = 1 . 3369 5652 and σ = 1 . 00841 216 for the normal distribution, (iii) λ = 1 . 3369 5652 for the poisson distribution, and (iv) x min = 1 an d α = 3 . 041 947 for th e power-law distribution. 5 1 2 3 4 5 6 7 8 0.0 0.2 0.4 0.6 0.8 Degree(x) P(x) 1 2 3 4 5 6 7 8 0.0 0.2 0.4 0.6 0.8 (a) Degree distribution for the subnetwork of contact network. There are 96 time periods of August 26th, 2014 in t his subnetwork. The black spots are the probability distribution of nodes’ degrees. 1 2 3 4 5 6 7 0 50 100 150 Exponential distribution Degree Frequency 1 2 3 4 5 6 7 0 50 100 150 1 2 3 4 5 6 7 0 50 100 150 Normal distribution Degree Frequency 1 2 3 4 5 6 7 0 50 100 150 1 2 3 4 5 6 7 0 50 100 150 Poisson distrib ution Degree Frequency 1 2 3 4 5 6 7 0 50 100 150 1 2 3 4 5 6 7 0 50 100 150 Po wer−law distribution Degree Frequency 1 2 3 4 5 6 7 0 50 100 150 (b) Maximum-likelihood fitting of degree distributions. The degree distribution of the subnetwo rk is fitted into expo nential, normal, poisson and po wer-la w distributions by maximum-like lihood fitting. The black spots indicate the probability distribution of nodes’ degrees, and the red lines are the corresponding fittings for expon ential, normal, poisson and po wer-law distributions. Fig. 4: Degree distribution a nd maximu m-likelihood fitting for the sub network of contact network T able II shows the estimated stand ard deviations and the estima ted variance-covariance matrices of the fittings for the subnetwork. T ABLE II: Estimated stand ard d eviations and estimate d variance-covariance matrices for different fittings Distribution Standard deviation V ariance-covariance matrix Exponential λ (rate parameter): 0.05514089 r ate par ameter r ate par ameter 0 . 003040518 Normal µ (mean): 0.07434113, σ (standard deviation (sd)): 0.05256712 mean sd mean 0 . 005526604 0 . 000000000 sd 0 . 000000000 0 . 002763302 Poisson λ (lambda): 0.08524123 lambda lambda 0 . 007266068 Power -law x min + α : 0. 02865438 NULL From the fitting results for the subnetwork of Aug ust 26th , 2014 , wh ich ar e listed in T ab . I I, the degree distribution of the subnetwork is appro ximate to th e power -law distribution with x min = 1 and α = 3 . 04194 7 . Based on the above detailed an alyses on the structure of networks, the se two facts can be o bserved: (i) epidemic p ropagatio n shows high p ertinency with network structure. It means that along w ith the pro pagation o f disease durin g an epidem ic, the extending of contact network is to follow a c ertain pattern . T hat is, n etwork structure impa cts the dy namics of epide mic propag ation: the propag ation dy namics is different on different n etworks with d ifferent structu res. (ii) Network structure is time-varying du ring an epidemic (it makes a d ynamic network). I V . R E C O G N I T I O N M O D E L O F N E T WO R K S T RU C T U R E How to rec ognize the dynam ic structure of a contac t network is a valuable research issue. It is impo rtant to q uantify and predict the pro pagation dynamics during an ep idemic. If the qu antification and predictio n can be achieved, it will be helpfu l to accurately allocate pub lic h ealth resources and respon d to public health events. Based on the a nalytical ability of Apache Spark [ 13] on Streaming Data and Graph , we propo se the reco gnition m odel of network stru cture. The workflow of this model is illustrated in Fig. 5. In this model, the inpu t stream is co mposed of th e spatio- temporal data, G PS location s a nd times, from smart phon es. Th e GPS location of a case is associated with the physical lo cation where the case is fou nd and reporte d. On th is basis, the cases 6 Fig. 5: Recogn ition m odel workflow and their relationships fr om within a perio d of time (by ana lyzing the time stamp of each r ecorded case), a re used to build a graph. In this grap h, the distance between two vertices can be c alculated based on the coordin ates of these two vertices. The graph is time- varying: the vertex and ed ge set are chang ed over time along with the propa gation of epidem ic. By the spark engine with a real-tim e alg orithm and the processing of Spark Streaming 1 , such d ynamic chan ge of graph can b e followed, an d structu ral pr operties (e.g ., degree distribution) an d m aximum-likeliho od fitting can b e c alculated. Wit h the calculated p roperties and fitting, the propag ation dynamics o f a n epidem ic can be quantize d and even the trend o f p ropaga tion can be pre dicted. A prediction for an epidemic is based on the actu al m ovements of cases, and with obtained special inf ormation of network structure, the pre diction will be mo re effectiv e. V . O P E N I S S U E S A N D F U T U R E W O R K The a bove p roposed reco gnition mod el is based on Spark to p rocess an d an alyze stre aming data and the data-based graph. For d ev eloping this model, these op en issues need to be studied as futu re work: • Building a gr aph based on spatio- temporal data. Once the spatio-tem poral data is persistently inp ut, Spark can process it by Sp ark Str eaming, and further throu gh the graph algorith ms of Spark Engine, a dynam ic graph is built. Fr om “d ata” to “graph ”, ther e is an impo rtant proce ss, “transfor mation”. For a cer tain problem , such p rocess is with specific require ments, for exam ple, a suitab le p eriod o f time needs to be co nfirmed to build the gra ph tha t is used to d enote th e real-time contact network o f epidemic propa gation. • Real-time algor ithm design b ased on the fr amew ork of Spark. Spa rk is d esigned f or big data analy tics. It m eans th at Spark is a fast and ge neral engine for large-scale data pro cessing. In this eng ine, th e processing is based on parallelization technolog y , so traditio nal serial algorithms are no t su itably used in he re. • Follo wing th e dy namic ch ange of g raph. It is n ecessary to design a real-time algo rithm to rec ognize th e struc ture o f dynamic graph and calcu late the structural pro perties o f the grap h. V I . C O N C L U S I O N By ana lyzing the imp act of network structu re on epid emic propag ation dynamics, this article has prop osed a model to re cognize the d ynamic structure of network. This mo del is based on the ab ility of Spark to proce ss an d analyze streaming d ata and the data-based graph. The mod el can calculate: (i) the stru ctural pro perties of d ynamic n etwork, and ( ii) the maxim um-likelihood fitting for these stru ctural pr operties. By th is calculation , the stru cture of network can be recognized in real time. Spe cifically , from the po int of view of the future work, we have intro duced an d discussed the op en issues f or developing this mod el. R E F E R E N C E S [1] M. G. Rodriguez, J. Leskov ec, D. Balduzzi, and B. SCHÖLKOPF , “Uncov ering the s tructu re and temporal dynamics of information propagation, ” Network Scienc e , vol. 2, no. 01, pp. 26–65, 2014. [2] S. W en, W . Zhou, J. Zhang, Y . Xiang, W . Z hou, and W . Jia, “Modeli ng propagatio n dynamics of social network worms, ” P arallel and Distributed Systems, IEEE Tr ansaction s on , vol. 24, no. 8, pp. 1633–1643, 2013. [3] G. Theodorakopo ulos, J.-Y . L e Boudec, and J. S. Baras, “Selfish response to epidemic propagation, ” Automat ic Contr ol, IEEE T ransacti ons on , vol. 58, no. 2, pp. 363–376, 2013. [4] X. Fu, M. Small, and G. Chen, Prop agatio n dynami cs on comple x networks: models, methods and stability analysis . John W iley & Sons, 2013. [5] J. Guo, H. Guo, and Z. W ang, “ An acti vati on force-b ased af finity measure for analyzing complex networks, ” Scien tific re ports , vol. 1, 2011. [6] S. Pei and H. A. Makse, “Spreading dynamics in complex networks, ” J ournal of Statisti cal Mechanics: Theory and Experiment , vol . 2013, no. 12, p. P12002, 2013. [7] M. Small, D. M. W alk er , and C. K. T se, “Scale-free distributio n of avian influenza outbreaks, ” Physical rev iew letters , vol. 99, no. 18, p. 188702, 2007. [8] F . Brauer et al. , Mathematical models for communicable diseases . SIAM, 2012, vol. 84. 1 Spark Streaming provide s a language-inte grated API to stream processing. It makes the processing of streaming data be easy as processing batch data. 7 [9] “Ebola care app, ” http:// www .appsagai nstebola.or g/#the- ap p . [10] T . Lappas, E. T erzi, D. Gunopulos, and H. Mannila , “Finding ef fectors in social networks, ” in Proc eedings of the 16th ACM SIGKDD internati onal confer ence on Knowledg e discovery and data mining . ACM, 2010, pp. 1059–1068. [11] G. M. V azquez-Prok opec, D. Bisanzio, S. T . Stoddard, V . Paz-Soldan, A. C. Morrison, J. P . Elder , J. Ramirez-P aredes, E. S. Halsey , T . J. Kochel, T . W . Scott et al. , “Using gps technol ogy to quantify human mobility , dynamic contact s and infecti ous disease dynamics in a resource-poo r urban en vironment , ” PloS one , vol. 8, no. 4, p. e58802, 2013. [12] L. Kim, M. Abramson, K. Drakopoulos, S. Koli tz, and A. Ozdaglar , “Estimating social network structure and propagation dynamics for an infectious disease, ” in Social Computing , Behavior al-Cult ural Modeling and Predict ion . Springer , 2014, pp. 85–93. [13] “ A pache spark, ” http:/ /spark.apach e.org/ .
Original Paper
Loading high-quality paper...
Comments & Academic Discussion
Loading comments...
Leave a Comment