Statistical Modelling of Citation Exchange Between Statistics Journals
Rankings of scholarly journals based on citation data are often met with skepticism by the scientific community. Part of the skepticism is due to disparity between the common perception of journals' prestige and their ranking based on citation counts…
Authors: Cristiano Varin, Manuela Cattelan, David Firth
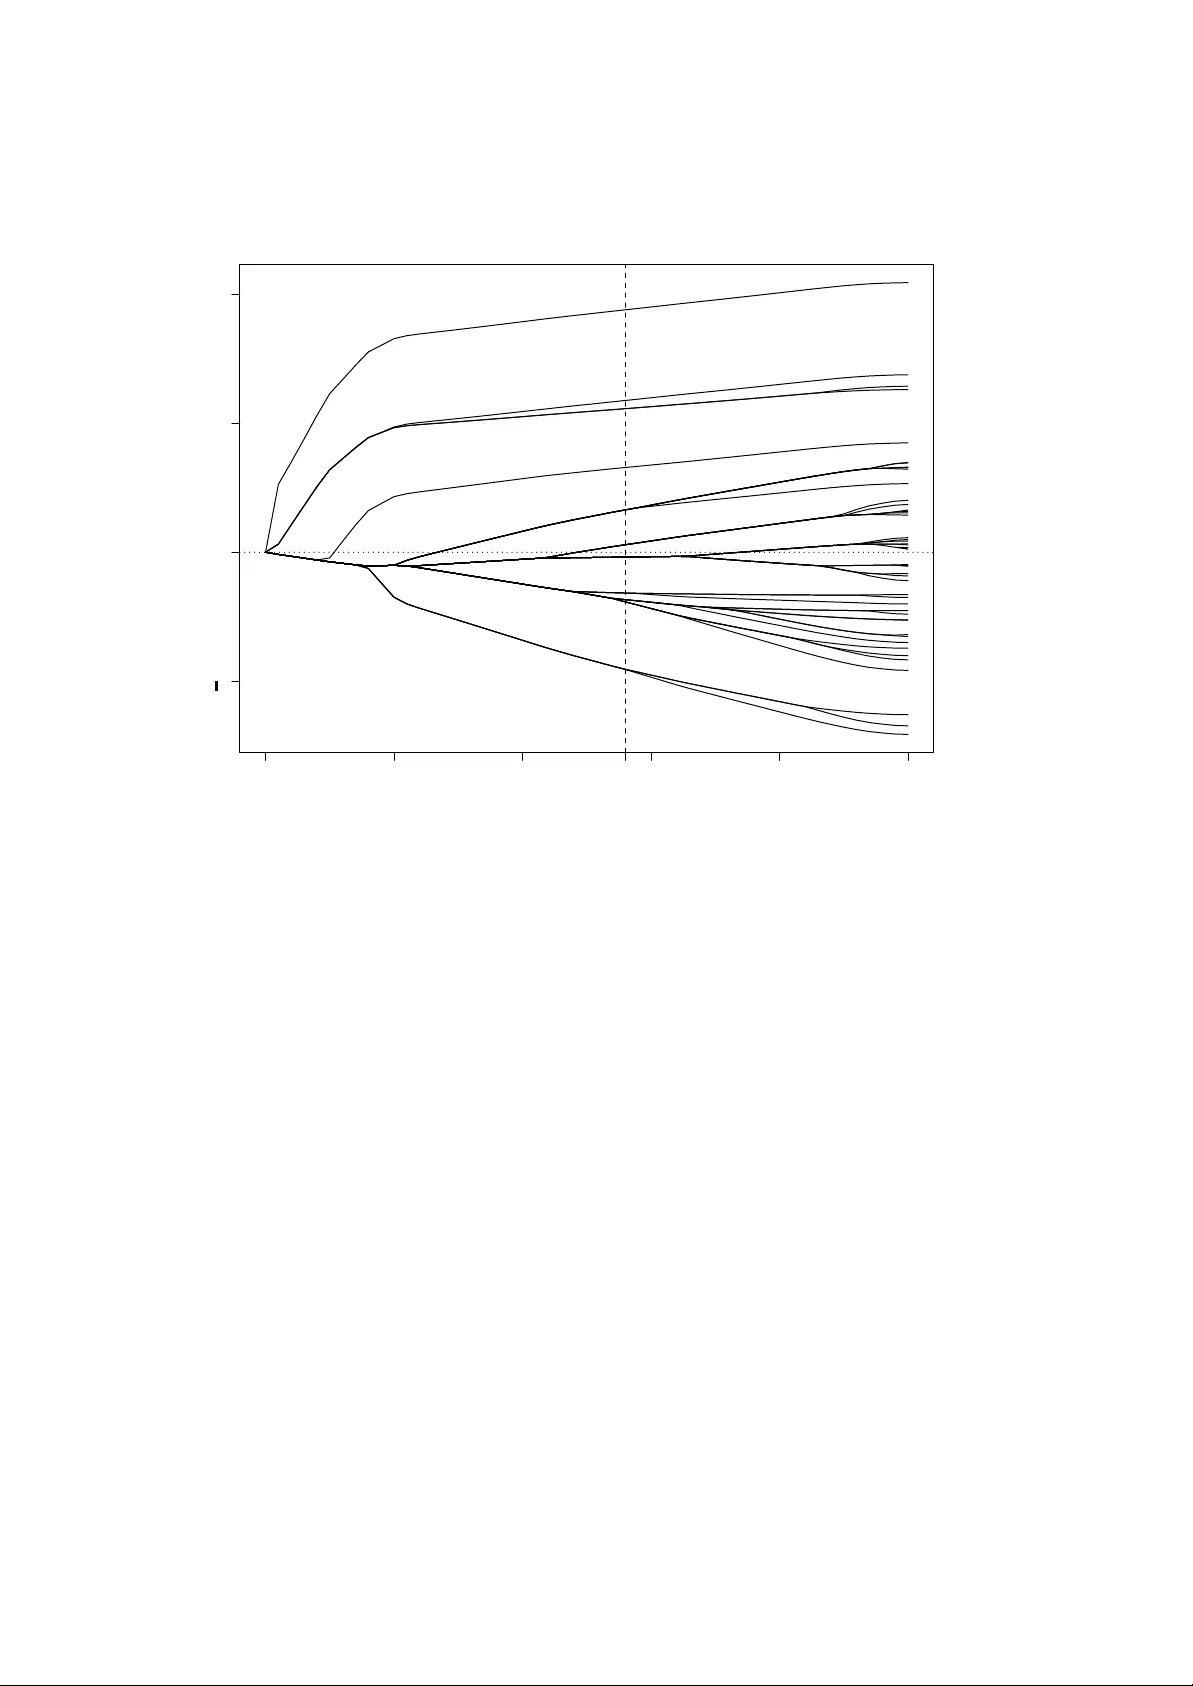
Statistical Modelling of Citation Exchange Between Statistics Journals Cristiano V arin Universit ` a Ca’ F oscari, V enezia, Italy . Manuela Cattelan Universit ` a degli Studi di P adova, P adov a, Italy . David Firth University of W arwick, Co ventry , UK. Summary . Rankings of scholarly jour nals based on citation data are often met with skepticism b y the scientific community . P ar t of the skepticism is due to disparity between the common perception of journals’ prestige and their ranking based on citation counts. A more serious concer n is the inap- propriate use of jour nal rankings to ev aluate the scientific influence of authors. This paper focuses on analysis of the tab le of cross-citations among a selection of Statistics jour nals. Data are collected from the Web of Science database published by Thomson Reuters. Our results suggest that mod- elling the exchange of citations between jour nals is useful to highlight the most prestigious jour nals, but also that journal citation data are characterized b y considerab le heterogeneity , which needs to be properly summarized. Inf erential conclusions require care in order to avoid potential over-interpretation of insignificant differences betw een journal ratings. Comparison with published ratings of institutions from the UK’s Research Assessment Exercise shows strong correlation at aggregate lev el between assessed research quality and journal citation ‘expor t scores’ within the discipline of Statistics. K eywords : Bradle y-T erry Model; Citation Data; Expor t Score; Impact Factor; Journal Ranking; Re- search Evaluation; Stigler Model. 1. Introduction The problem of ranking sc holarly journals has arisen partly as an economic matter. When the n um b er of scien tific journals started to increase, librarians were faced with decisions as to whic h journal subscriptions should consume their limited economic resources; a natural resp onse was to b e guided b y the relative importance of different journals according to a published or otherwise agreed ranking. Gross and Gross (1927) proposed the coun ting of citations received by journals as a direct measure of their importance. Garfield (1955) suggested that the num b er of citations receiv ed should b e normalized by the num b er of citable items published by a journal. This idea is at the origin of the Imp act F actor , the b est known index for ranking journals. Published since the 1960s, the Impact F actor is ‘an av erage citation rate p er published article’ (Garfield, 1972). The Impact F actor of the journals where sc holars publish has also b een emplo yed — improperly , man y might argue — in app ointing to academic p ositions, in a w arding research grants, and in ranking univ ersities and their departmen ts. The San F r ancisc o De clar ation on R ese ar ch Assessment (2013) and the IEEE Position Statement on Appr opriate Use of Bibliometric Indic ators for the Assessment of Journals, R ese ar ch Pr op osals, and Individuals (IEEE Board of Directors, 2013) are just t wo of the most recen t authoritativ e standp oin ts regarding the risks of automatic, metric-based ev aluations of sc holars. T ypically , only a small fraction of all published articles accoun ts for most of the citations receiv ed by a journal (Seglen, 1997). Single authors should ideally be ev aluated on the basis of their o wn outputs and not through citations of other pap ers that hav e app eared in the journals where their papers hav e b een published (Seglen, 1997; Adler et al. , 2009; Silverman, 2009). As stated in a recen t Scienc e editorial ab out Impact F actor distortions (Alb erts, 2013): ‘(. . . ) the leaders of the scientific enterprise m ust accept full resp onsibility for thought- fully analyzing the scientific contributions of other researchers. T o do so in a meaningful w a y requires the actual reading of a small selected set of each researc her’s publications, a task that m ust not b e passed by default to journal editors’. 2 C . V arin, M. Cattelan, and D . Fir th Indicators deriv ed from citations receiv ed b y papers written b y a particular author ( e.g. , Bornmann and Marx, 2014) can b e a useful complement for ev aluation of trends and patterns of that author’s impact, but not a substitute for the reading of pap ers. Journal rankings based on the Impact F actor often differ substantially from common p erceptions of journal prestige (Theoharakis and Sk ordia, 2003; Arnold and F o wler, 2011). V arious causes of such discrepancy ha v e b een p ointed out. First, there is the phenomenon that more ‘applied’ journals tend to receive citations from other scientific fields more often than do journals that publish theoretical work. This may b e related to uncoun ted ‘indirect citations’ arising when metho dology dev elop ed in a theoretical journal is then p opularized by pap ers published in applied journals accessible to a wider audience and thus receiving more citations than the original source (Journal- Ranking.com, 2007; Putirk a et al. , 2013). Second is the short time-p erio d used for computation of the Impact F actor, whic h can b e completely inappropriate for some fields, in particular for Mathematics and Statistics (v an Nierop, 2009; Arnold and F o wler, 2011). Finally , there is the risk of manipulation, whereby authors might b e asked by journal editors to add irrelev ant citations to other pap ers published in their journal (Sevinc, 2004; F randsen, 2007; Archam bault and Larivi ` ere, 2009; Arnold and F o wler, 2011). According to a large surv ey published in Scienc e (Wilhite and F ong, 2012), ab out 20% of academics in so cial-science and business fields hav e b een asked to ‘pad their pap ers with superfluous references to get published’ (v an Noorden, 2012). The survey data also suggest that junior faculty mem b ers are more likely to b e pressured to cite sup erfluous pap ers. Recen tly , Thomson Reuters has started publishing the Impact F actor b oth with and without journal self-citations, thereby allowing ev aluation of the contribution of self-citations to the Impact F actor calculation. Moreo v er, Thomson Reuters has o ccasionally excluded journals with an excessive self-citation rate from the Journal Citation Rep orts. Giv en the ab ov e criticisms, it is not surprising that the Impact F actor and other ‘quan titativ e’ journal rankings hav e given rise to substan tial skepticism ab out the v alue of citation data. Sev eral prop osals hav e b een developed in the bibliometric literature to ov ercome the weaknesses of the Impact F actor; examples include the A rticle Influenc e Sc or e (Bergstrom, 2007; W est, 2010), the H index for journals (Braun et al. , 2006; Pratelli et al. , 2012), the Sour c e Normalize d Imp act p er Pap er (SNIP) index (W altman et al. , 2013), and metho ds based on p ercen tile rank classes (Marx and Bornmann, 2013). The aforementioned Scienc e editorial (Alb erts, 2013) rep orts that ‘(...) in some nations, publication in a journal with an impact factor b elow 5 . 0 is officially of zero v alue.’ In the latest edition (2013) of the Journal Citation Reports, the only journal with an Impact F actor larger than 5 in the category Statistics and Pr ob ability was the Journal of the R oyal Statistic al So ciety Series B, with Impact F actor 5.721. The category Mathematics ac hieved still low er Impact F actors, with the highest v alue there in 2013 b eing 3 . 08 for Communic ations on Pur e and Applie d Mathematics . Several bibliometric indicators hav e b een developed, or adjusted, to allow for cross- field comparisons, e.g. Leydesdorff et al. (2013), W altman and V an Ec k (2013), and could b e considered to alleviate unfair comparisons. Ho wev er, our opinion is that comparisons betw een differen t research fields will rarely make sense, and that such comparisons should b e a v oided. Researc h fields differ v ery widely , for example in terms of the frequency of publication, the typical n um b er of authors p er pap er and the typical n umber of citations made in a pap er, as well as in the sizes of their researc h comm unities. Journal homogeneit y is a minimal prerequisite for a meaningful statistical analysis of citation data (Lehmann et al. , 2009). Journal citation data are unav oidably c haracterized by substantial v ariability ( e.g. , Amin and Mab e, 2000). A clear illustration of this v ariability , suggested b y the Asso ciate Editor of this pap er, comes from an early editorial of Briefings in Bioinformatics (Bishop and Bird, 2007) announcing that this new journal had receiv ed an Impact F actor of 24 . 37. How ever, the editors noted that a v ery large fraction of the journal’s citations came from a single pap er; if that pap er were to b e dropp ed, then the journal’s Impact F actor w ould decrease to ab out 4. The v ariability of the Impact F actor is inheren tly related to the hea vy-tailed distribution of citation counts. Av eraged indica- tors suc h as the Impact F actor are clearly unsuitable for summarizing highly skew distributions. Nev ertheless, quan tification of uncertaint y is t ypically lacking in published rankings of journals. A recen t exception is Chen et al. (2014) who employ a b o otstrap estimator for the v ariability Statistical Modelling of Citation Exchange 3 of journal Impact F actors. Also the SNIP indicator published by Leiden Universit y’s Centre for Science and T ec hnology Studies based on the Elsevier Scopus database, and av ailable online at www.journalindicators.com , is accompanied b y a ‘stability interv al’ computed via a b o otstrap metho d. See also Hall and Miller (2009, 2010) and references therein for more details on statistical assessmen t of the authorit y of rankings. The Impact F actor was developed to identify which journals hav e the greatest influence on subsequen t researc h. The other metrics men tioned in this paper originated as p ossible impro ve- men ts on the Impact F actor, with the same aim. P alacios-Huerta and V olij (2004) list a set of prop erties that a ranking method whic h measures the intellectual influence of journals, b y using citation coun ts, should satisfy . How ever, the list of all desirable features of a ranking metho d migh t reasonably b e extended to include features other than citations, depending on the purp ose of the ranking. F or example, when librarians decide which journals to take, they should consider the influence of a journal in one or more researc h fields, but they ma y also tak e in to accoun t its cost-effectiv eness. The website www.journalprices.com , main tained by Professors T ed Bergstrom and Preston McAfee, ranks journals according to their price per article, price p er citation, and a comp osite index. A researcher when deciding where to submit a pap er most likely considers each candidate journal’s record of publishing papers on similar topics, and the imp ortance of the journal in the researc h field; but he/she ma y also consider the speed of the reviewing process, the t ypical time b et ween acceptance and publication of the pap er, p ossible page c harges, and the lik ely effect on his/her own career. Certain institutions and national ev aluation agencies publish rankings of journals which are used to ev aluate researcher p erformance and to inform the hiring of new faculty mem b ers. F or v arious economics and management-related disciplines, the Journal Quality List , compiled b y Professor Anne-Wil Harzing and a v ailable at www.harzing.com/jql.htm , com bines more than 20 differen t rankings made b y univ ersities or ev aluation agencies in v arious countries. Suc h rankings typically are based on bibliometric indices, exp ert surveys, or a mix of b oth. Mo dern tec hnologies hav e fostered the rise of alternative metrics such as “webometrics” based on citations on the internet or n umbers of downloads of articles. Recen tly , interest has mo v ed from web-citation analysis to so cial-media usage analysis. In some disciplines the fo cus is no w to w ards broader measurement of research impact through the use of web-based quantities suc h as citations in so cial-media sites, newspap ers, gov ernment policy do cumen ts, blogs, etc. This is mainly implemented at the level of individual articles, see for example the Altmetric service (Adie and Ro e, 2013) av ailable at www.altmetric.com , but the analysis may also b e made at journal lev el. Along with the adv antages of timeliness, a v ailability of data and consideration of differen t sources, such measures also hav e certain drawbac ks related to data quality , p ossible bias, and data manipulation (Bornmann, 2014). A primary purpose of the presen t pap er is to illustrate the risks of ov er-in terpretation of insignif- ican t differences betw een journal ratings. In particular, w e focus on the analysis of the exc hange of citations among a relativ ely homogeneous list of journals. F ollo wing Stigler (1994), w e model the table of cross-citations b etw een journals in the same field b y using a Bradley-T erry mo del (Bradley and T erry, 1952) and thereb y deriv e a ranking of the journals’ abilit y to ‘exp ort in tel- lectual influence’ (Stigler, 1994). Although the Stigler approach has desirable prop erties and is simple enough to be promoted also outside the statistics comm unity , there hav e been rather few published examples of application of this mo del since its first app earance; Stigler et al. (1995) and Liner and Amin (2004) are tw o notable examples of its application to the journals of Economics. W e pay particular attention to metho ds that summarize the uncertaint y in a ranking pro duced through the Stigler mo del-based approac h. Our fo cus on properly accoun ting for ‘mo del-based uncertain t y in making comparisons’ is close in spirit to Goldstein and Spiegelhalter (1996). W e prop ose to fit the Stigler mo del with the quasi-likelihoo d metho d (W edderburn, 1974) to account for inter-dependence among the citations exchanged b etw een pairs of journals, and to summarize estimation uncertaint y by using quasi-v ariances (Firth and de Menezes, 2005). W e also suggest the use of the ranking lasso p enalty (Masarotto and V arin, 2012) when fitting the Stigler mo del, in order to combine the b enefits of shrink age with an enhanced interpretation arising from automatic presen tational grouping of journals with similar merits. The pap er is organised as follo ws. Section 2 describ es the data collected from the W eb of Science database compiled b y Thomson Reuters; then as preliminary bac kground to the paper’s 4 C . V arin, M. Cattelan, and D . Fir th main conten t on journal rankings, Section 3 illustrates the use of cluster analysis to identify groups of Statistics journals sharing similar aims and t yp es of con ten t. Section 4 pro vides a brief summary of journal rankings published by Thomson Reuters in the Journal Citation Rep orts. Section 5 discusses the Stigler metho d and applies it to the table of cross-citations among Statistics journals. Section 6 compares journal ratings based on citation data with results from the UK Research Assessmen t Exercise, and Section 7 collects some concluding remarks. The citation data set and the computer code used for the analyses written in the R language (R Core T eam, 2014) are made a v ailable in the Supplemen tary W eb Materials. 2. The W eb of Science database The database used for our analyses is the 2010 edition of the W eb of Science produced by Thomson Reuters. The citation data contained in the database are employ ed to compile the Journal Cita- tion Rep orts (JCR), whose Science Edition summ arizes citation exchange among more than 8,000 journals in science and technology . Within the JCR, sc holarly journals are group ed into 171 ov er- lapping sub ject categories. In particular, in 2010 the Statistics and Pr ob ability category comprised 110 journals. The choice of the journals that are encompassed in this category is to some extent arbitrary . The Scopus database, which is the main commercial comp etitor of W eb of Science, in 2010 included in its Statistics and Probability category 105 journals, but only ab out tw o thirds of them were classified in the same category within W eb of Science. The Statistics and Probability category contains also journals related to fields such as Econometrics, Chemistry , Computational Biology , Engineering and Psychometrics. A severe criticism of the Impact F actor relates to the time p eriod used for its calculation. The standard version of the Impact F actor considers citations received to articles published in the previous t wo y ears. This p erio d is to o short to reac h the peak of citations of an article, especially in mathematical disciplines (Hall, 2009). v an Nierop (2009) finds that articles published in Statistics journals t ypically reach the p eak of their citations more than three y ears after publication; as rep orted b y the JCR, the median age of the articles cited in this category is more than 10 years. Thomson Reuters ackno wledges this issue and computes a second version of the Impact F actor using citations to pap ers published in the previous five y ears. Recent published alternatives to the Impact F actor, to b e discussed in Section 4, also count citations to articles that app eared in the previous five years. The presen t pap er considers citations of articles published in the previous ten years, in order to capture the influence, o ver a more substan tial p erio d, of w ork published in statistical journals. A key requirement for the metho ds describ ed here, as well as in our view for an y sensible analysis of citation data, is that the journals jointly analysed should be as homogeneous as possible. Accordingly , analyses are conducted on a subset of the journals from the Statistics and Probability category , among which there is a relativ ely high level of citation exchange. The selection is obtained b y discarding journals in Probability , Econometrics, Computational Biology , Chemometrics and Engineering, and other journals not sufficiently related to the ma jorit y of the journals in the selection. F urthermore, journals recently established, and thus lacking a record of ten y ears of citable items, also are dropp ed. The final selection consists of the 47 journals listed in T able 1. Ob viously , the metho ds discussed in this pap er can b e similarly applied to other selections motiv ated by different purp oses. F or example, a statistician interested in applications to Economics migh t consider a different selection with journals of econometrics and statistical metho dology , discarding instead journals orien ted tow ards biomedical applications. The JCR database supplies detailed information ab out the citations exc hanged b etw een pairs of journals through the Cite d Journal T able and the Citing Journal T able . The Cited Journal T able for journal i con tains the n um b er of times that articles published in journal j during 2010 cite articles published in journal i in previous years. Similarly , the Citing Journal T able for journal i contains the n um b er of times that articles published in journal j in previous years were cited in journal i during 2010. Both of the tables contain some very mo dest loss of information. In fact, all journals that cite journal i are listed in the Cited Journal T able for journal i only if the n umber of citing journals is less than 25. Otherwise, the Cited Journal T able rep orts only those journals that cite journal i at least twice in al l p ast ye ars , thus counting also citations to pap ers published earlier than the decade 2001–2010 here considered. Remaining journals that cite journal i only Statistical Modelling of Citation Exchange 5 T able 1. List of selected Statistics jour nals, with abbre viations used in the paper . Journal name Abbreviation American Statistician AmS Annals of Statistics AoS Annals of the Institute of Statistical Mathematics AISM Australian and New Zealand Journal of Statistics ANZS Bernoulli Bern Biometrical Journal BioJ Biometrics Bcs Biometrik a Bk a Biostatistics Biost Canadian Journal of Statistics CJS Comm unications in Statistics - Simulation and Computation CSSC Comm unications in Statistics - Theory and Metho ds CSTM Computational Statistics CmpSt Computational Statistics and Data Analysis CSD A En vironmental and Ecological Statistics EES En vironmetrics En vr In ternational Statistical Review ISR Journal of Agricultural, Biological and Environmen tal Statistics JABES Journal of Applied Statistics JAS Journal of Biopharmaceutical Statistics JBS Journal of Computational and Graphical Statistics JCGS Journal of Multiv ariate Analysis JMA Journal of Nonparametric Statistics JNS Journal of Statistical Computation and Simulation JSCS Journal of Statistical Planning and Inference JSPI Journal of Statistical Softw are JSS Journal of the American Statistical Asso ciation JASA Journal of the Roy al Statistical So ciet y Series A JRSS-A Journal of the Roy al Statistical So ciet y Series B JRSS-B Journal of the Roy al Statistical So ciet y Series C JRSS-C Journal of Time Series Analysis JTSA Lifetime Data Analysis LD A Metrik a Mtk a Scandina vian Journal of Statistics SJS Stata Journal StataJ Statistica Neerlandica StNee Statistica Sinica StSin Statistical Metho ds in Medical Research SMMR Statistical Mo delling StMo d Statistical Papers StP ap Statistical Science StSci Statistics Stats Statistics and Computing StCmp Statistics and Probability Letters SPL Statistics in Medicine StMed T echnometrics T ech T est T est 6 C . V arin, M. Cattelan, and D . Fir th once in all past years are collected in the category ‘all others’. Information on journals cited only once is similarly treated in the Citing Journal T able. Cited and Citing Journal T ables allo w construction of the cross-citation matrix C = [ c ij ], where c ij is the n um b er of citations from articles published in journal j in 2010 to papers published in journal i in the chosen time window ( i = 1 , . . . , n ). In our analyses, n = 47, the num b er of selected Statistics journals, and the time window is the previous ten years. In the rest of this section w e pro vide summary information ab out citations made and received by each Statistics journal at aggregate lev el, while Sections 3 and 5 discuss statistical analyses derived from citations exc hanged b y pairs of journals. T able 2 shows the citations made b y pap ers published in each Statistics journal in 2010 to pap ers published in other journals in the decade 2001–2010, as well as the citations that the papers published in eac h Statistics journal in 2001–2010 received from pap ers published in other journals in 2010. The same information is visualized in the back-to-bac k bar plots of Figure 1. Citations made and received are classified into three categories, namely journal self-citations from a pap er published in a journal to another pap er in the same journal, citations to/from journals in the list of selected Statistics journals, and citations to/from journals not in the selection. The total n umbers of citations rep orted in the second and fifth columns of T able 2 include citations given or received by all journals included in the W eb of Science database, not only those in the field of Statistics. The totals are influenced by journals’ sizes and b y the citation patterns of other categories to whic h journals are related. The num b er of references to articles published in 2001–2010 ranges from 275 for citations made in Statistic al Mo del ling , whic h has a small size publishing around 350–400 pages p er y ear, to 4,022 for Statistics in Me dicine , a large journal with size ranging from 3,500 to 6,000 pages annually in the p eriod examined. The num b er of citations from a journal to articles in the same journal is quite v ariable and ranges from 0.8% of all citations for Computational Statistics to 24% for Stata Journal . On a verage, 6% of the references in a journal are to articles app earing in the same journal and 40% of references are addressed to journals in the list, including journal self-citations. The Journal of the R oyal Statistic al So ciety Series A has the lo w est percentage of citations to other journals in the list, at only 10%. Had we kept the whole Statistics and Pr ob ability category of the JCR, that p ercentage would hav e risen by just 2 p oints to 12%; most of the references app earing in Journal of the R oyal Statistic al So ciety Series A are to journals outside the Statistics and Probabilit y category . The num b er of citations received ranges from 168 for Computational Statistics to 6,602 for Statistics in Me dicine . Clearly , the num b ers are influenced by the size of the journal. F or example, the small num b er of citations received b y Computational Statistics relates to only around 700 pages published p er year by that journal. The citations received are influenced also by the citation patterns of other sub ject categories. In particular, the num b er of citations receiv ed b y a journal orien ted tow ards medical applications b enefits from comm unication with a large field including man y high-impact journals. F or example, around 75% of the citations received by Statistics in Me dicine came from journals outside the list of Statistics journals, mostly from medical journals. On a verage, 7% of the citations receiv ed b y journals in the list came from the same journal and 40% were from journals in the list. As stated already , the Statistics journals up on whic h we fo cus hav e b een selected from the Statistics and Probabilit y category of the JCR, with the aim of retaining those which comm unicate more. The median fraction of citations from journals discarded from our selection to journals in the list is only 4%, while the median fraction of citations receiv ed b y non-selected journals from journals in the list is 7%. An important example of an excluded journal is Ec onometric a , which was rank ed in leading p ositions by all of the published citation indices. Ec onometric a had only ab out 2% of its references addressed to other journals in our list, and received only 5% of its citations from journals within our list. 3. Clustering journals Statistics journals hav e differen t stated ob jectiv es, and differen t t yp es of conten t. Some journals emphasize applications and modelling, while others focus on theoretical and mathematical dev elop- men ts, or deal with computational and algorithmic asp ects of statistical analysis. Applied journals are often targeted to particular areas, suc h as, for example, statistics for medical applications, or Statistical Modelling of Citation Exchange 7 T able 2. Citations made ( Citing ) and received ( Cited ) in 2010 to/from ar ticles published in 2001-2010. Columns are total cita- tions ( Total ), propor tion of citations that are journal self-citations ( Self ), and propor tion of citations that are to/from Statistics jour- nals ( Stat. ), including journal self-citations . Jour nal ab bre via- tions are as in T ab le 1. Citing Cited Journal T otal Self Stat. T otal Self Stat. AmS 380 0.11 0.43 648 0.07 0.29 AoS 1663 0.17 0.48 3335 0.09 0.47 AISM 459 0.04 0.36 350 0.05 0.57 ANZS 284 0.02 0.35 270 0.02 0.34 Bern 692 0.03 0.29 615 0.04 0.39 BioJ 845 0.07 0.50 664 0.08 0.42 Bcs 1606 0.12 0.49 2669 0.07 0.45 Bk a 872 0.09 0.57 1713 0.04 0.60 Biost 874 0.06 0.41 1948 0.03 0.22 CJS 419 0.04 0.51 362 0.04 0.60 CSSC 966 0.03 0.43 344 0.08 0.48 CSTM 1580 0.06 0.41 718 0.13 0.59 CmpSt 371 0.01 0.33 168 0.02 0.38 CSD A 3820 0.13 0.45 2891 0.17 0.40 EES 399 0.10 0.34 382 0.10 0.23 En vr 657 0.05 0.27 505 0.06 0.27 ISR 377 0.05 0.21 295 0.07 0.32 JABES 456 0.04 0.26 300 0.05 0.27 JAS 1248 0.03 0.31 436 0.08 0.33 JBS 1132 0.09 0.33 605 0.16 0.33 JCGS 697 0.06 0.44 870 0.05 0.43 JMA 2167 0.09 0.49 1225 0.15 0.52 JNS 562 0.03 0.52 237 0.07 0.65 JSCS 736 0.04 0.43 374 0.09 0.45 JSPI 3019 0.08 0.44 1756 0.13 0.54 JSS 1361 0.07 0.21 1001 0.09 0.17 JASA 2434 0.10 0.41 4389 0.05 0.44 JRSS-A 852 0.05 0.15 716 0.05 0.24 JRSS-B 506 0.11 0.51 2554 0.02 0.42 JRSS-C 731 0.02 0.30 479 0.03 0.34 JTSA 327 0.08 0.32 356 0.07 0.41 LD A 334 0.06 0.57 247 0.09 0.59 Mtk a 297 0.07 0.56 264 0.08 0.59 SJS 493 0.02 0.50 562 0.02 0.60 StataJ 316 0.24 0.36 977 0.08 0.11 StNee 325 0.01 0.24 191 0.02 0.31 StSin 1070 0.04 0.57 935 0.05 0.54 SMMR 746 0.04 0.33 813 0.03 0.18 StMo d 275 0.03 0.41 237 0.03 0.35 StP ap 518 0.03 0.35 193 0.08 0.42 StSci 1454 0.03 0.29 924 0.05 0.35 Stats 311 0.02 0.47 254 0.02 0.43 StCmp 575 0.04 0.46 710 0.03 0.24 SPL 1828 0.08 0.36 1348 0.11 0.46 StMed 4022 0.16 0.42 6602 0.10 0.24 T ech 494 0.09 0.37 688 0.06 0.38 T est 498 0.01 0.61 243 0.03 0.54 8 C . V arin, M. Cattelan, and D . Fir th Citing 1.0 0.8 0.6 0.4 0.2 0.0 self stat other Cited 0.0 0.2 0.4 0.6 0.8 1.0 AmS AoS AISM ANZS Bern BioJ Bcs Bka Biost CJS CSSC CSTM CmpSt CSD A EES Envr ISR JABES JAS JBS JCGS JMA JNS JSCS JSPI JSS JASA JRSS−A JRSS−B JRSS−C JTSA LD A Mtka SJS StataJ StNee StSin SMMR StMod StP ap StSci Stats StCmp SPL StMed T ech T est Fig. 1. Bar plots of citations made ( Citing , left panel) and received ( Cited , right panel) for the selected Statistics jour nals, as listed in T able 2, based on Jour nal Citation Repor ts 2010. For each jour nal, the bar displa ys the propor tion of self-citations (dark grey), the propor tion of citations made/received to/from other Statistics journals in the list (mid grey), and to/from journals not in the list (light grey). Statistical Modelling of Citation Exchange 9 for environmen tal sciences. Therefore, it is quite natural to consider whether the cross-citation matrix C allows the identification of groups of journals with similar aims and types of conten t. Clustering of sc holarly journals has been extensively discussed in the bibliometric literature and a v ariety of clustering metho ds hav e b een considered. Examples include the hill-climbing metho d (Carp en ter and Narin, 1973), k -means (Boy ack et al. , 2005), and metho ds based on graph theory (Leydesdorff, 2004; Liu et al. , 2012). Consider the total n um b er t ij of citations exchanged b et ween journals i and j , t ij = ( c ij + c j i , for i 6 = j c ii , for i = j. (1) Among v arious p ossibilities — see, for example, Boy ack et al. (2005) — the distance b et w ee n t w o journals can b e measured by quantit y d ij = 1 − ρ ij , where ρ ij is the Pearson correlation co efficient of v ariables t ik and t j k ( k = 1 , . . . , n ), i.e. , ρ ij = P n k =1 ( t ik − ¯ t i ) ( t j k − ¯ t j ) q P n k =1 ( t ik − ¯ t i ) 2 P n k =1 ( t j k − ¯ t j ) 2 , with ¯ t i = P n k =1 t ik /n . Among the many av ailable clustering algorithms, we consider a hierarchical agglomerativ e cluster analysis with complete link age (Kaufman and Rousseeu w, 1990). The cluster- ing pro cess is visualized through the dendrogram in Figure 2. Visual insp ection of the dendrogram suggests cutting it at heigh t 0 . 6 , thereby obtaining eight clusters, tw o of which are singletons. The iden tified clusters are group ed in grey b oxes in Figure 2. W e comment first on the groups and later on the singletons, following the order of the journals in the dendrogram from left to right. The first group includes a large num b er of general journals concerned with theory and metho ds of Statistics, but also with applications. Among others, the group includes Journal of Time Series Analysis , Journal of Statistic al Planning and Infer enc e , and A nnals of the Institute of Statistic al Mathematics . The second group contains the leading journals in the developmen t of statistical theory and metho ds: A nnals of Statistics , Biometrika , Journal of the A meric an Statistic al Asso ciation and Journal of the R oyal Statistic al So ciety Series B. The group includes also other metho dological journals such as Bernoul li , Sc andinavian Journal of Statistics and Statistic a Sinic a . It is p ossible to iden tify some natural subgroups: Journal of Computational and Gr aphic al Statistics and Statistics and Computing ; Biometrika , Journal of the R oyal Statistic al So ciety Series B, and Journal of the A meric an Statistic al Asso ciation ; Annals of Statistics and Statistic a Sinic a . The third group comprises journals mostly dealing with computational asp ects of Statistics, such as Computational Statistics and Data Analysis , Communic ations in Statistics – Simulation and Computation , Computational Statistics , and Journal of Statistic al Computation and Simulation . Other members of the group with a less direct orientation tow ards computational metho ds are T e chnometrics and Journal of Applie d Statistics . The fourth group includes just tw o journals b oth of whic h publish mainly review articles, namely A meric an Statistician and International Statistic al R eview . The fifth group comprises the three journals specializing in ecological and en vironmental ap- plications: Journal of A gricultur al, Biolo gic al and Envir onmental Statistics , Envir onmental and Ec olo gic al Statistics and Envir onmetrics . The last group includes v arious journals emphasising applications, esp ecially to health sciences and similar areas. It encompasses journals oriented tow ards biological and medical applications suc h as Biometrics and Statistics in Me dicine , and also journals publishing pap ers ab out more general statistical applications, such as Journal of the R oyal Statistic al So ciety Series A and Series C. The review journal Statistic al Scienc e also falls into this group; it is not group ed together with the other tw o review journals already mentioned. Within the group there are some natural sub- groupings: Statistics in Me dicine with Statistic al Metho ds in Me dic al R ese ar ch ; and Biometrics with Biostatistics . Finally , and perhaps not surprisingly , the tw o singletons are the softw are-oriented Journal of Statistic al Softwar e and Stata Journal . The latter is, b y some distance, the most remote journal in the list according to the measure of distance used here. 10 C . V arin, M. Cattelan, and D . Fir th S t P a p A N Z S J T S A S P L A I S M J S P I M t k a C S T M S t a t s J C G S S t C m p C J S S J S J R S S − B B k a J A S A S t N e e T e s t A o S S t S i n B e r n J M A J N S C m p S t C S D A T e c h J S C S C S S C J A S A m S I S R S t a t a J J A B E S E E S E n v r J S S S t M o d L D A S t S c i J R S S − C B c s B i o s t B i o J J B S J R S S − A S t M e d S M M R H e i g h t 0 . 0 0 . 2 0 . 4 0 . 6 0 . 8 1 . 0 Fig. 2. Dendrogram of complete linkage hier archical cluster analysis. Clusters obtained by cutting the dendrogram at height 0.6 are identified b y grey bo xes. 4. Ranking journals The Thomson Reuters JCR website ann ually publishes v arious rating indices, the b est known b eing the already men tioned Impact F actor. Thomson Reuters also publishes the Imme diacy Index , which describ es the av erage num b er of times an article is cited in the year of its publication. The Immediacy Index is unsuitable for ev aluating Statistics journals, but it could b e worth y of atten tion in fields where citations o ccur very quickly , for example some areas of neuroscience and other life sciences. It is w ell kno wn in the bibliometric literature that the calculation of the Impact F actor contains some important inconsistencies (Gl¨ anzel and Mo ed, 2002). The numerator of the Impact F actor includes citations to all items, while the num b er of citable items in the denominator excludes letters to the editor and editorials; such letters are an imp ortant element of some journals, notably medical journals. The inclusion of self-citations, defined as citations from a journal to articles in the same journal, exposes the Impact F actor to p ossible manipulation by editors. Indeed, Sevinc (2004), F randsen (2007) and Wilhite and F ong (2012) report instances where authors w ere ask ed to add irrelev ant references to their articles, presumably with the aim of increasing the Impact F actor of the journal. As previously men tioned, recen tly Thomson Reuters has made a v ailable also the Impact F actor without journal self-citations. Journal self-citations can also be a consequence of authors’ preferring to cite pap ers published in the same journal instead of equally relev an t pap ers published elsewhere, particularly if they p erceive such self-citation as likely to b e welcomed by the journal’s editors. Nevertheless, the p oten tial for such b eha viour should not lead to the conclusion that self-citations are alw a ys unfair. Man y self-citations are lik ely to be gen uine, especially since sc holars often select a journal for submission of their work according to the presence of previously published pap ers on related topics. The Eigenfactor Sc or e and the deriv ed Article Influenc e Sc or e (Bergstrom, 2007; W est, 2010) ha v e b een proposed to o vercome the limitations of the Impact F actor. Both the Eigenfactor and the Article Influence Score are computed ov er a fiv e-year time perio d, with journal self-citations remo v ed in order to eliminate p ossible sources of manipulation. The idea underlying the Eigenfactor Score is that the imp ortance of a journal relates to the time sp ent by scholars in reading that journal. As stated b y Bergstrom (2007), it is p ossible to imagine that a sc holar starts reading an article selected at random. Then, the scholar randomly selects another article from the references of the first pap er and reads it. Afterwards, a further article is selected at random from the references included in the previous one and the pro cess ma y go on ad infinitum . In such a process, the time sp ent in reading a journal might reasonably be regarded as an indicator of that journal’s imp ortance. Statistical Modelling of Citation Exchange 11 Apart from mo difications needed to account for sp ecial cases such as journals that do not cite any other journal, the Eigenfactor algorithm is summarized as follo ws. The Eigenfactor is computed from the normalized citation matrix ˜ C = [˜ c ij ], whose elements are the citations c ij from journal j to articles published in the previous five y ears in journal i divided b y the total num b er of references in j in those years, ˜ c ij = c ij / P n i =1 c ij . The diagonal elements of ˜ C are set to zero, to discard self-citations. A further ingredient o f the Eigenfactor is the vector of normalized num b ers of articles a = ( a 1 , . . . , a n ) > , with a i b eing the num b er of articles published b y journal i during the five-y ear p erio d divided by the num b er of articles published by all considered journals. Let e > b e the row vector of ones, so that ae > is a matrix with all identical columns a . Then P = λ ˜ C + (1 − λ ) ae > is the transition matrix of a Mark o v pro cess that assigns probabilit y λ to a random mov ement in the journal citation netw ork, and probabilit y 1 − λ to a random jump to any journal; for jumps of the latter kind, destination-journal attractiveness is simply prop ortional to size. The damping parameter λ is set to 0 . 85, just as in the PageR ank algorithm at the basis of the Go ogle search engine; see Brin and P age (1998). The leading eigen vector ψ of P corresp onds to the steady-state fraction of time sp ent reading eac h journal. The Eigenfactor Score EF i for journal i is defined as ‘the p ercentage of the total weigh ted citations that journal i receives’; that is, EF i = 100 [ ˜ C ψ ] i P n i =1 [ ˜ C ψ ] i , i = 1 , . . . , n, where [ x ] i denotes the i th element of vector x . See www.eigenfactor.org/methods.pdf for more details of the metho dology b ehind the Eigenfactor algorithm. The Eigenfactor ‘measures the total influence of a journal on the scholarly literature’ (Bergstrom, 2007) and thus it dep ends on the num b er of articles published b y a journal. The Article Influ- ence Score AI i of journal i is instead a measure of the p er-article citation influence of the journal, obtained by normalizing the Eigenfactor as follo ws: AI i = 0 . 01 EF i a i , i = 1 , . . . , n. Distinctiv e asp ects of the Article Influence Score with resp ect to the Impact F actor are: (a) The use of a formal sto c hastic mo del to derive the journal ranking; (b) The use of biv ariate data — the cross-citations c ij — in con trast to the univ ariate citation coun ts used by the Impact F actor. An app ealing feature of the Article Influence Score is that citations are w eigh ted according to the imp ortance of the source, whereas the Impact F actor counts all citations equally (F rancesc het, 2010). Accordingly , the bibliometric literature classifies the Article Influence Score as a measure of journal ‘prestige’ and the Impact F actor as a measure of journal ‘p opularity’ (Bollen et al. , 2006). T able 3 summarizes some of the main features of the ranking metho ds discussed in this section and also of the Stigler mo del that will b e discussed in Section 5 b elo w. The rankings of the selected Statistics journals according to Impact F actor, Impact F actor without journal self-citations, fiv e-y ear Impact F actor, Immediacy Index, and Article Influence Score are rep orted in columns t wo to six of T able 4. The substantial v ariation among those five rankings is the first asp ect that leaps to the ey e; these different published measures clearly do not yield a common, unam biguous picture of the journals’ relative standings. A diffuse opinion within the statistical comm unity is that the four most prestigious Statistics journals are (in alphab etic order) Annals of Statistics , Biometrika , Journal of the A meric an Sta- tistic al Asso ciation , and Journal of the R oyal Statistic al So ciety Series B. See, for example, the surv ey about ho w statisticians p erceive Statistics journals describ ed in Theoharakis and Sk ordia (2003). Accordingly , a minimal requirement for a ranking of acceptable quality is that the four most prestigious journals should o ccup y prominent p ositions. F ollo wing this criterion, the least satisfactory ranking is, as exp ected, the one based on the Immediacy Index, which ranks Journal 12 C . V arin, M. Cattelan, and D . Fir th T able 3. Characteristics of the jour nal rankings derived from Jour nal Citation Repor ts. Rankings are: Immediacy Index ( II ), Impact F actor ( IF ), Impact F actor without self-citations ( IFno ), fiv e-year Impact F actor ( IF5 ), Ar ticle Influence Score ( AI ), and the Stigler model studied in this paper ( SM ). The ‘Data’ column indicates whether the data used are biv ar iate cross-citation counts or only univ ar iate ci- tation counts. ‘Global/Local’ relates to whether a ranking is ‘local’ to the main journals of Statistics, or ‘global’ in that it is applied across disciplines. Citation Sto chastic Excludes Global/ Ranking P erio d (yrs) Mo del Data Self-citation Lo cal II 1 none univ ariate no global IF 2 none univ ariate no global IFno 2 none univ ariate yes global IF5 5 none univ ariate no global AI 5 Mark ov biv ariate yes global pro cess SM 10 Bradley- biv ariate y es lo cal T erry of the Americ an Statistic al Asso ciation only 22nd and Biometrika just a few positions ahead at 19th. In the three v ersions of Impact F actor ranking, Journal of the R oyal Statistic al So ciety Series B alwa ys o ccupies first p osition, Annals of Statistics ranges b etw een second and sixth, Journal of the Americ an Statistic al Asso ciation b et ween fourth and eighth, and Biometrika betw een tenth and tw elfth. The t wo softw are journals hav e quite high Impact F actors: Journal of Statistic al Softwar e is rank ed betw een second and fifth by the three differen t Impact F actor versions, while Stata Journal is b etw een seven th and ninth. Other journals ranked highly according to the Impact F actor measures are Biostatistics and Statistic al Scienc e . Among the indices published by Thomson Reuters, the Article Influence Score yields the most satisfactory ranking with resp ect to the four leading journals men tioned ab o v e, all of whic h stand within the first fiv e p ositions. All of the indices discussed in this section are constructed b y using the complete W eb of Science database, thus counting citations from journals in other fields as well as citations among Statistics and Probability journals. 5. The Stigler model Stigler (1994) considers the export of in tellectual influence from a journal in order to determine its imp ortance. The exp ort of influence is measured through the citations received by the journal. Stigler assumes that the log-o dds that journal i exp orts to journal j rather than vice- v ersa is equal to the difference of the journals’ exp ort sc or es , log-o dds (journal i is cited b y journal j ) = µ i − µ j , (2) where µ i is the exp ort score of journal i . In Stephen Stigler’s w ords ‘the larger the export score, the greater the prop ensity to exp ort intellectual influence’. The Stigler mo del is an example of the Bradley-T erry mo del (Bradley and T erry, 1952; David, 1963; Agresti, 2013) for paired comparison data. According to (2), the citation coun ts c ij are realizations of binomial v ariables C ij with exp ected v alue E( C ij ) = t ij π ij , (3) where π ij = exp( µ i − µ j ) / { 1 + exp( µ i − µ j ) } and t ij is the total n um b er of citations exc hanged b et ween journals i and j , as defined in (1). The Stigler mo del has some attractive features: (a) Statistic al mo del ling . Similarly to the Eigenfactor and the derived Article Influence Score, the Stigler metho d is based on sto chastic modelling of a matrix of cross-citation counts. The methods differ regarding the mo delling persp ective — Marko v pro cess for Eigenfactor v ersus Bradley-T erry mo del in the Stigler method — and, p erhaps most imp ortantly , the Statistical Modelling of Citation Exchange 13 T able 4. Rankings of selected Statistics journals based on Jour nal Citation Repor ts, 2010 Edition. Columns correspond to Immediacy Index ( II ), Impact F actor ( IF ), Impact Factor without self-citations ( IFno ), five-y ear Impact F actor ( IF5 ), Ar ticle Influence Score ( AI ), and the Stigler model ( SM ). Braces indicate groups identified b y the ranking lasso . Rank II IF IFno IF5 AI SM 1 JSS JRSS-B JRSS-B JRSS-B JRSS-B JRSS-B 2 Biost AoS Biost JSS StSci AoS 3 SMMR Biost AoS StSci JASA Bk a 4 StCmp JSS JRSS-A JASA AoS JASA 5 AoS JRSS-A JSS Biost Bk a Bcs 6 EES StSci StSci AoS Biost JRSS-A 7 JRSS-B StMed StMed StataJ StataJ Bern 8 JCGS JASA JASA SMMR StCmp SJS 9 StMed StataJ StataJ JRSS-A JRSS-A Biost 10 BioJ StCmp StCmp Bk a JSS JCGS 11 CSD A Bk a SMMR StCmp Bcs T ech 12 StSci SMMR Bk a StMed Bern AmS 13 JRSS-A Bcs EES Bcs JCGS JTSA 14 StSin EES Bcs T ec h SMMR ISR 15 JBS T ec h T ec h JCGS T ech AISM 16 StataJ BioJ BioJ EES SJS CJS 17 Bcs JCGS JCGS CSD A StMed StSin 18 En vr CSDA T est SJS T est StSci 19 Bk a JBS AISM AmS CJS LDA 20 JMA T est Bern JBS StSin JRSS-C 21 T ech JMA StSin Bern JRSS-C StMed 22 JASA Bern LD A JRSS-C AmS ANZS 23 JRSS-C AmS JMA BioJ JMA StCmp 24 ISR AISM CSD A JABES EES StataJ 25 JNS StSin SJS JMA JTSA SPL 26 T est LDA ISR CJS LDA StNee 27 Bern ISR JBS T est BioJ Envr 28 JABES SJS AmS StMod StMo d JABES 29 JSPI En vr Envr StSin CSD A Mtk a 30 SJS JABES StMo d LDA JABES StMo d 31 AmS StMo d CJS Envr AISM JSPI 32 AISM JSPI JABES JTSA ANZS SMMR 33 StMod CJS JTSA ISR ISR BioJ 34 Mtk a JTSA JSPI ANZS JSPI JMA 35 StNee JRSS-C ANZS JSPI Envr EES 36 StP ap ANZS StP ap AISM JBS CSDA 37 SPL StPap Mtk a Stats StNee JNS 38 ANZS Mtk a JRSS-C Mtk a CmpSt CmpSt 39 LD A Stats Stats CmpSt JNS Stats 40 JTSA CmpSt CmpSt StNee Stats T est 41 JSCS JSCS JSCS JSCS Mtk a CSTM 42 CJS JNS JNS StPap JSCS JSS 43 CmpSt SPL SPL SPL StPap JBS 44 CSTM CSTM CSTM JNS SPL JSCS 45 Stats CSSC StNee JAS CSTM CSSC 46 JAS StNee CSSC CSTM CSSC StPap 47 CSSC JAS JAS CSSC JAS JAS 14 C . V arin, M. Cattelan, and D . Fir th use of formal statistical metho ds. The Stigler mo del is calibrated through well-established statistical fitting metho ds, such as maximum likelihoo d or quasi-likelihoo d (see Section 5.1), with estimation uncertaint y summarized accordingly (Section 5.3). Moreov er, Stigler-mo del assumptions are readily chec ked by the analysis of suitably defined residuals, as describ ed in Section 5.2. (b) The size of the journals is not imp ortant . Rankings based on the Stigler mo del are not affected b y the num b ers of pap ers published. As shown by Stigler (1994, pg. 102), if tw o journals are merged into a single journal then the o dds in fav our of that ‘sup er’ journal against any third journal is a weigh ted av erage of the o dds for the tw o separate journals against the third one. Normalization for journal size, which is explicit in the definitions of v arious Impact F actor and Article Influence measures, is thus implicit for the Stigler mo del. (c) Journal self-citations ar e not c ounte d . In con trast to the standard Impact F actor, rankings based on journal exp ort scores µ i are not affected by the risk of manipulation through journal self-citations. (d) Only citations b etwe en journals under c omp arison ar e c ounte d . If the Stigler mo del is applied to the list of 47 Statistics journals, then only citations among these journals are coun ted. Suc h an application of the Stigler mo del thus aims unambiguously to measure influence within the research field of Statistics, rather than combining that with p otential influence on other researc h fields. As noted in T able 3, this prop erty differentiates the Stigler mo del from the other ranking indices published b y Thomson Reuters, which use citations from all journals in p oten tially any fields in order to create a ‘global’ ranking of all scholarly journals. Ob viously it w ould be possible als o to re-compute more ‘locally’ the v arious Impact F actor measures and/or Eigenfactor-based indices, b y using only citations exc hanged betw een the journals in a restricted set to b e compared. (e) Citing journal is taken into ac c ount . Lik e the Article Influence Score, the Stigler mo del measures journals’ relative prestige, b ecause it is derived from biv ariate citation counts and th us takes into account the source of each citation. The Stigler mo del decomp oses the cross- citation matrix C differently , though; it can b e re-expressed in log-linear form as the ‘quasi symmetry’ mo del, E ( C ij ) = t ij e α i + β j , (4) in which the exp ort score for journal i is µ i = α i − β i . (f ) L ack-of-fit assessment . Stigler et al. (1995) and Liner and Amin (2004) observed increasing lac k of fit of the Stigler mo del when additional journals that trade little with those already under comparison are included in the analysis. Ritzb erger (2008) states bluntly that the Stigler mo del ‘suffers from a lack of fit’ and dismisses it — incorrectly , in our view — for that reason. W e agree instead with Liner and Amin (2004) who suggest that statistical lack-of-fit assessmen t is another p ositive feature of the Stigler mo del that can b e used, for example, to identify groups of journals b elonging to different research fields, journals which should p erhaps not b e ranked together. Certainly the existence of principled lac k-of-fit assessment for the Stigler mo del should not b e a reason to prefer other metho ds for which no suc h assessmen t is av ailable. See also T able 3 for a comparison of prop erties of the ranking metho ds considered in this pap er. 5.1. Model fitting Maxim um lik eliho o d estimation of the v ector of journal export scores µ = ( µ 1 , . . . , µ n ) > can be obtained through standard softw are for fitting generalized linear mo dels. Alternatively , sp ecialized soft w are such as the R pack age BradleyTerry2 (T urner and Firth, 2012) is av ailable through the CRAN rep ository . Since the Stigler mo del is sp ecified through pairwise differences of exp ort scores µ i − µ j , mo del identification requires a constrain t, such as, for example, a ‘reference journal’ constrain t µ 1 = 0 or the sum constraint P n i =1 µ i = 0. Without loss of generality w e use the latter constrain t in what follo ws. Standard maximum likelihoo d estimation of the Stigler mo del would assume that citation coun ts c ij are realizations of indep endent binomial v ariables C ij . Suc h an assumption is likely to b e inappropriate, since research citations are not indep endent of one another in practice; see Cattelan Statistical Modelling of Citation Exchange 15 (2012) for a general discussion on handling dependence in paired-comparison mo delling. The presence of dep endence b etw een citations can b e exp ected to lead to the well-kno wn phenomenon of o verdispersion. A simple wa y to deal with ov erdisp ersion is provided by the method of quasi- lik eliho od (W edderburn, 1974). Accordingly , w e consider a ‘quasi-Stigler’ mo del, E( C ij ) = t ij π ij and v ar( C ij ) = φ t ij π ij (1 − π ij ) , (5) where φ > 0 is the disp ersion parameter. Let c b e the vector obtained by stac king all citation coun ts c ij in some arbitrary order, and let t and π be the corresp onding vectors of totals t ij and exp ected v alues π ij , resp ectively . Then estimates of the exp ort scores are obtained b y solving the quasi-lik eliho od estimating equations D > V − 1 ( c − tπ ) = 0 , (6) where D is the Jacobian of π with resp ect to the export scores µ , and V = V ( µ ) is the diagonal ma- trix with elements v ar( C ij ) /φ . Under the assumed mo del (5), quasi-likelihoo d estimators are con- sisten t and asymptotically normally distributed with v ariance-cov ariance matrix φ D > V − 1 D − 1 . The disp ersion parameter is usually estimated via the squared Pearson residuals as ˆ φ = 1 m − n + 1 n X i 0) the num b er of pairs of journals that exc hange citations. W ell-kno wn prop erties of quasi-likelihoo d estimation are robust- ness against missp ecification of the v ariance matrix V and optimalit y within the class of linear un biased estimating equations. The estimate of the disp ersion parameter obtained here, for the mo del applied to Statistics journal cross-citations b etw een 2001 and 2010, is ˆ φ = 1 . 76, indicativ e of ov erdisp ersion. The quasi- lik eliho od estimated exp ort scores of the Statistics journals are rep orted in T able 5 and will b e discussed later in Section 5.4. 5.2. Model validation An essential feature of the Stigler mo del is that the export score of any journal is a constan t. In particular, in mo del (2) the exp ort score of journal i is not affected b y the iden tity of the citing journal j . Citations exc hanged betw een journals can b e seen as results of con tests betw een opposing journals and the residuals for contests inv olving journal i should not exhibit any relationship with the corresp onding estimated exp ort scores of the ‘opp onent’ journals j . With this in mind, w e define the journal r esidual r i for journal i as the standardized regression coefficient derived from the linear regression of Pearson residuals in v olving journal i on the estimated exp ort scores of the corresp onding opp onen t journals. More precisely , the i th journal res idual is defined here as r i = P n j =1 ˆ µ j r ij q ˆ φ P n j =1 ˆ µ 2 j , where r ij is the Pearson residual for citations of i by j , r ij = c ij − t ij ˆ π ij p t ij ˆ π ij (1 − ˆ π ij ) . The journal residual r i indicates the exten t to whic h i p erforms systematically b etter than predicted b y the mo del either when the opp onent j is strong, as indicated by positive-v alued journal residual for i , or when the opp onent j is weak, as indicated by a negative-v alued journal residual for i . The journal residuals thus provide a basis for useful diagnostics, targeted sp ecifically at readily in terpretable departures from the assumed mo del. 16 C . V arin, M. Cattelan, and D . Fir th Fig. 3. Normal probability plot of journal residuals with 95% simulation envelope (left panel) and scatterplot of journal residuals versus estimated journal expor t scores (right panel). Under the assumed quasi-Stigler mo del, journal residuals are approximately realizations of standard normal v ariables and are unrelated to the exp ort scores. The normal probabilit y plot of the journal residuals display ed in the left panel of Figure 3 indicates that the normality assumption is indeed appro ximately satisfied. The scatterplot of the journal residuals r i against estimated export scores ˆ µ i sho ws no clear pattern; there is no evidence of correlation b et ween journal residuals and exp ort scores. As exp ected based on appro ximate normality of the residuals, only tw o journals — i.e. , 4 . 3% of journals — ha ve residuals larger in absolute v alue than 1 . 96. These journals are Communic ations in Statistics - The ory and Metho ds ( r CSTM = 2 . 23) and T est ( r T est = − 3 . 01). The ov erall conclusion from this graphical insp ection of journal residuals is that the assumptions of the quasi-Stigler mo del app ear to b e essentially satisfied for the data used here. 5.3. Estimation uncer tainty Estimation uncertaint y is commonly unexplored, and is rarely rep orted, in relation to the v arious published journal rankings. Despite this lacuna, many academics hav e pro duced vibrant critiques of ‘statistical citation analyses’, although such analyses are actually rather non-statistical. Recen t researc h in the bibliometric field has suggested that uncertaint y in estimated journal ratings might b e estimated via b ootstrap simulation; see the already mention ed Chen et al. (2014) and the ‘stabilit y interv als’ for the SNIP index. A key adv antage of the Stigler mo del ov er other ranking metho ds is straightforw ard quantification of the uncertaint y in journal exp ort scores. Since the Stigler model is identified through pairwise differences, uncertaint y quantification requires the complete v ariance matrix of ˆ µ . Routine rep orting of suc h a large v ariance matrix is impracticable for space reasons. A neat solution is pro vided through the presen tational device of quasi-v ariances (Firth and de Menezes, 2005), constructed in such a wa y as to allow approximate calculation of any v ariance of a difference, v ar( ˆ µ i − ˆ µ j ), as if ˆ µ i and ˆ µ j w ere indep enden t: v ar ( ˆ µ i − ˆ µ j ) ' qv ar i + qv ar j , for all choices of i and j . Rep orting the estimated export scores with their quasi-v ariances, then, is an economical wa y to allow approximate inference on the significance of the difference b etw een an y tw o journals’ exp ort scores. The quasi-v ariances are computed by minimizing a suitable p enalty function of the differences b etw een the true v ariances, v ar ( ˆ µ i − ˆ µ j ), and their quasi-v ariance represen tations qv ar i + qv ar j . See Firth and de Menezes (2005) for details. Statistical Modelling of Citation Exchange 17 T able 5. Journal ranking based on the Stigler model using data from Journal Citation Repor ts 2010 edition. Columns are the quasi-likelihood estimated Stigler-model expor t scores ( SM ) with associated quasi standard errors ( QSE ), and estimated e xpor t scores after grouping b y lasso ( SM grouped ). Rank Journal SM QSE SM group ed 1 JRSS-B 2.09 0.11 1.87 2 AoS 1.38 0.07 1.17 3 Bk a 1.29 0.08 1.11 4 JASA 1.26 0.06 '' 5 Bcs 0.85 0.07 0.65 6 JRSS-A 0.70 0.19 0.31 7 Bern 0.69 0.15 '' 8 SJS 0.66 0.12 '' 9 Biost 0.66 0.11 '' 10 JCGS 0.64 0.12 '' 11 T ech 0.53 0.15 '' 12 AmS 0.40 0.18 0.04 13 JTSA 0.37 0.20 '' 14 ISR 0.33 0.25 '' 15 AISM 0.32 0.16 '' 16 CJS 0.30 0.14 '' 17 StSin 0.29 0.09 '' 18 StSci 0.11 0.11 -0.04 19 LD A 0.10 0.17 '' 20 JRSS-C 0.09 0.15 '' 21 StMed 0.06 0.07 '' 22 ANZS 0.06 0.21 '' 23 StCmp 0.04 0.15 '' 24 StataJ 0.02 0.33 '' Rank Journal SM QSE SM group ed 25 SPL -0.09 0.09 -0.04 26 StNee -0.10 0.25 '' 27 En vr -0.11 0.18 '' 28 JABES -0.16 0.23 '' 29 Mtk a -0.18 0.17 '' 30 StMod -0.22 0.21 '' 31 JSPI -0.33 0.07 -0.31 32 SMMR -0.35 0.16 '' 33 BioJ -0.40 0.12 '' 34 JMA -0.45 0.08 -0.36 35 EES -0.48 0.25 '' 36 CSD A -0.52 0.07 '' 37 JNS -0.53 0.15 '' 38 CmpSt -0.64 0.22 '' 39 Stats -0.65 0.18 '' 40 T est -0.70 0.15 '' 41 CSTM -0.74 0.10 '' 42 JSS -0.80 0.19 '' 43 JBS -0.83 0.16 '' 44 JSCS -0.92 0.15 '' 45 CSSC -1.26 0.14 -0.88 46 StP ap -1.35 0.20 '' 47 JAS -1.41 0.15 '' T able 5 rep orts the estimated journal export scores computed under the sum constraint P n i =1 µ i = 0 and the corresp onding quasi standard errors, defined as the square ro ot of the quasi-v ariances. Quasi-v ariances are calculated b y using the R pack age qvcalc (Firth, 2012). F or illustration, con- sider testing whether the exp ort score of Biometrika is significantly different from that of the Journal of the Americ an Statistic al Asso ciation . The z test statistic as approximated through the quasi-v ariances is z ' ˆ µ Bk a − ˆ µ JASA √ qv ar Bk a + qv ar JASA = 1 . 29 − 1 . 26 √ 0 . 08 2 + 0 . 06 2 = 0 . 30 . The ‘usual’ v ariances for those tw o exp ort scores in the sum-constrained parameterization are resp ectiv ely 0.0376 and 0.0344, and the cov ariance is 0.0312; thus the ‘exact’ v alue of the z statistic in this example is z = 1 . 29 − 1 . 26 p 0 . 0376 − 2 (0 . 0312) + 0 . 0344 = 0 . 31 , so the approximation based up on quasi-v ariances is quite accurate. In this case the z statistic suggests that there is insufficient evidence to rule out the p ossibilit y that Biometrika and Journal of the Americ an Statistic al Asso ciation hav e the same ability to ‘exp ort intellectual influence’ within the 47 Statistics journals in the list. 5.4. Results W e pro ceed now with in terpretation of the ranking based on the Stigler mo del. It is reassuring that the four leading Statistics journals mentioned previously are ranked in the first four p ositions. Journal of the R oyal Statistic al So ciety Series B is rank ed first with a remark ably larger exp ort score than the second-rank ed journal, Annals of Statistics : the approximate z statistic for the significance of the difference of their exp ort scores is 5 . 44. The third p osition is o ccupied by Biometrika , closely follow ed b y Journal of the A meric an Statistic al Asso ciation . The fifth-ranked journal is Biometrics , follo wed by Journal of the R oyal Statistic al So ciety Series A, Bernoul li , Sc andinavian Journal of Statistics , Biostatistics , Journal of Gr aphic al and 18 C . V arin, M. Cattelan, and D . Fir th Computational Statistics , and T e chnometrics . The ‘cen tip ede’ plot in Figure 4 visualizes the estimated exp ort scores along with the 95% comparison interv als with limits ˆ µ i ± 1 . 96 qse( ˆ µ i ), where ‘qse’ denotes the quasi standard error. The centipede plot highlights the outstanding position of Journal of the R oyal Statistic al So ciety Series B, and indeed of the four top journals whose comparison interv als are well separated from those of the remaining journals. Ho wev er, the most striking general feature is the substantial uncertain t y in most of the estimated journal scores. Many of the small differences that app ear among the estimated exp ort scores are not statistically significant. −1 0 1 2 JAS StP ap CSSC JSCS JBS JSS CSTM T est Stats CmpSt JNS CSD A EES JMA BioJ SMMR JSPI StMod Mtka JABES Envr StNee SPL StataJ StCmp ANZS StMed JRSS−C LD A StSci StSin CJS AISM ISR JTSA AmS T ech JCGS Biost SJS Bern JRSS−A Bcs JASA Bka AoS JRSS−B −1.41 −1.35 −1.26 −0.92 −0.83 −0.8 −0.74 −0.7 −0.65 −0.64 −0.53 −0.52 −0.48 −0.45 −0.4 −0.35 −0.33 −0.22 −0.18 −0.16 −0.11 −0.1 −0.09 0.02 0.04 0.06 0.06 0.09 0.1 0.11 0.29 0.3 0.32 0.33 0.37 0.4 0.53 0.64 0.66 0.66 0.69 0.7 0.85 1.26 1.29 1.38 2.09 Expor t Scores Fig. 4. Centipede plot of estimated jour nal e xpor t scores and 95% comparison inter vals based on Journal Citation Reports 2010 edition. The error-bar limits are ˆ µ i ± 1 . 96 qse ( ˆ µ i ) , with the estimated export scores ˆ µ i marked by solid circles . 5.5. Ranking in groups with lasso Shrink age estimation offers notable improv ement ov er standard maxim um likelihoo d estimation when the target is simultaneous estimation of a v ector of mean parameters; see, for example, Morris (1983). It seems natural to consider shrink age estimation also for the Stigler model. Masarotto and V arin (2012) fit Bradley-T erry mo dels with a lasso-type p enalty (Tibshirani, 1996) which, in our application here, forces journals with close exp ort scores to b e estimated at the same level. Statistical Modelling of Citation Exchange 19 The method, termed the ranking lasso, has the tw ofold adv antages of shrink age and enhanced in terpretation, b ecause it av oids ov er-interpretation of small differences b etw een estimated journal exp ort scores. F or a given v alue of a b ound parameter s ≥ 0, the ranking lasso metho d fits the Stigler mo del b y solving the quasi-likelihoo d equations (6) with an L 1 p enalt y on all the pairwise differences of exp ort scores; that is, D > V − 1 ( c − tπ ) = 0 , sub ject to n X i denote the solution of (8) for a given v alue of the b ound s . Then the optimal v alue for s is chosen by minimization of TIC( s ) = − 2 ˆ ` ( s ) + 2 trace J ( s ) I ( s ) − 1 , where ˆ ` ( s ) = ` { ˆ µ ( s ) } is the missp ecified log-likelihoo d of the Stigler mo del ` ( µ ) = n X i
Original Paper
Loading high-quality paper...
Comments & Academic Discussion
Loading comments...
Leave a Comment