An Immersive Visualization Tool for Teaching and Simulation of Smart Grid Technologies
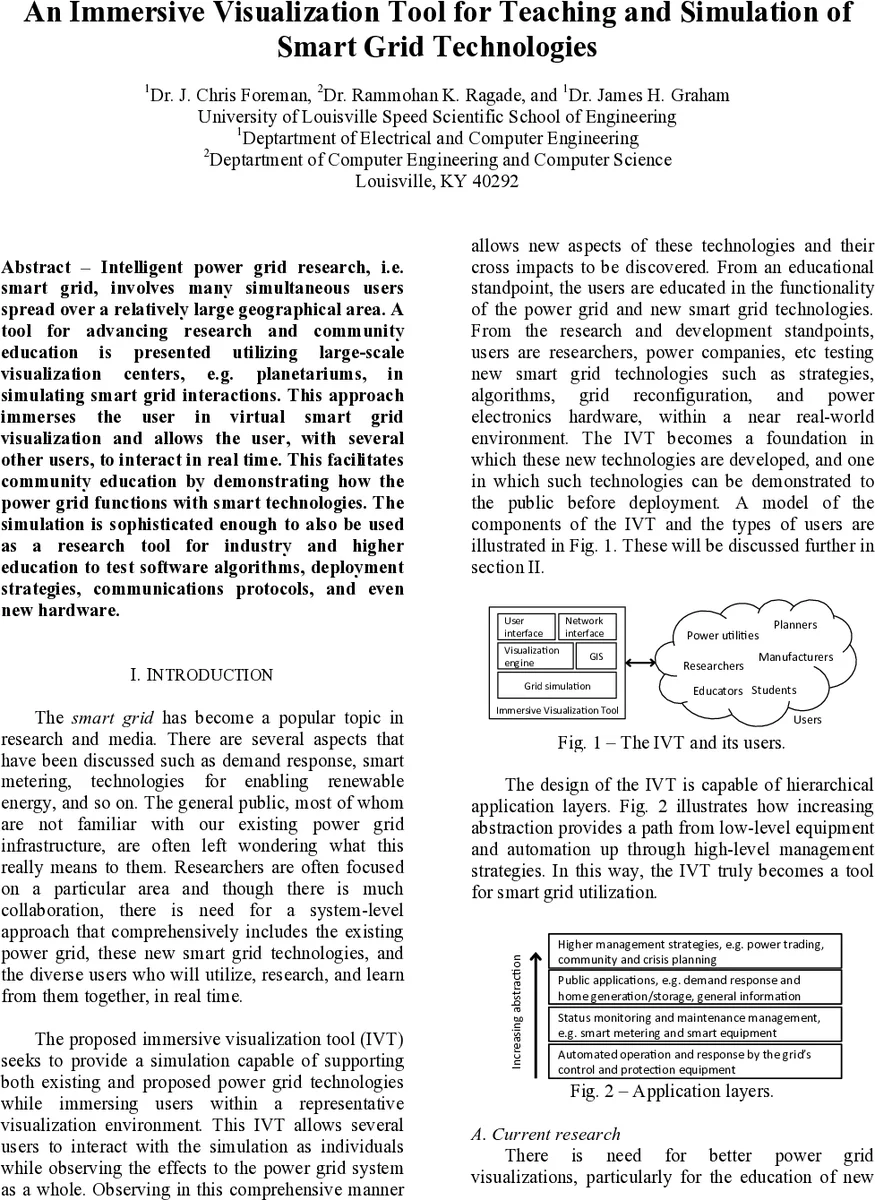
Intelligent power grid research, i.e. smart grid, involves many simultaneous users spread over a relatively large geographical area. A tool for advancing research and community education is presented utilizing large-scale visualization centers, e.g. planetariums, in simulating smart grid interactions. This approach immerses the user in virtual smart grid visualization and allows the user, with several other users, to interact in real time. This facilitates community education by demonstrating how the power grid functions with smart technologies. The simulation is sophisticated enough to also be used as a research tool for industry and higher education to test software algorithms, deployment strategies, communications protocols, and even new hardware.
💡 Research Summary
The paper addresses the lack of large‑scale, immersive visualization tools for smart‑grid research, education, and planning. It proposes an Immersive Visualization Tool (IVT) that leverages a planetarium‑type dome theater to display a geographically accurate, multi‑layered model of an electrical power system together with smart‑grid technologies such as demand‑response, distributed generation, and storage. The underlying architecture is built on a GIS platform that supports hierarchical layers: a base map with existing transmission and distribution assets, followed by layers for consumers, generators, storage units, and control agents. Each object is defined by its physical characteristics, real‑time operational data, and scripted behavior that links it to other objects in the network.
A key innovation is the multi‑user, real‑time interaction model. Users access the IVT via web‑based clients on PDAs, smartphones, or PCs. They interact with software agents that represent individual homes, substations, or other devices, adjusting parameters such as appliance loads, on‑site generation output, or battery charge/discharge schedules. The agents feed these changes into a power‑flow engine, which instantly recomputes voltages, currents, and system stability metrics. The updated state is rendered on the dome, allowing all participants to observe the system‑wide consequences of their actions. This “cross‑impact” capability makes the platform valuable not only for public outreach but also for researchers testing algorithms, utilities evaluating operational strategies, and regulators assessing policy impacts.
The authors review related work, noting that most existing visualizations are limited to 2‑D GIS displays, small‑scale 3‑D tools, or game‑like environments that lack the fidelity required for serious engineering analysis. By contrast, a planetarium provides a 360° × 180° high‑resolution canvas that can accommodate up to 160 viewers, ensuring both visual immersion and the capacity for collaborative experimentation. The planetarium’s network infrastructure (high‑speed campus fiber, Wi‑Fi access points, and connection to a university supercomputer) supports the heavy computational load of real‑time simulation and data streaming.
Four user categories are identified: (1) Education – general public, K‑12, and university students; (2) Researchers and developers – testing new control algorithms, hardware prototypes, and communication protocols; (3) Utility companies – planning maintenance, demand‑response programs, and market operations; (4) Community planners and regulators – evaluating emergency response, environmental, economic, and social impacts. The system’s GIS‑based layering makes it straightforward to add new technology modules or even extend the concept to water, gas, and telecommunications infrastructures.
Implementation proceeds in stages: (a) GIS construction of the baseline power‑grid model; (b) integration of real‑time operational data from simulation algorithms or field I/O; (c) development of software agents and user interfaces; (d) deployment on the planetarium dome with full‑dome projection; (e) iterative testing with stakeholder groups. As of April 2010 the project was in the proposal phase, with GIS development and simulation expected to begin later that year and preliminary results slated for presentation at the IEEE SmartGridComm conference in October 2010.
The paper concludes that the IVT uniquely combines high‑fidelity engineering simulation with immersive visualization, enabling simultaneous education and research activities. Future work includes expanding the platform to other critical infrastructures, incorporating communication‑protocol testing, performing cybersecurity and vulnerability assessments, and creating a publicly accessible web‑based “game” version to further improve consumer acceptance of smart‑grid technologies.
Comments & Academic Discussion
Loading comments...
Leave a Comment