Detecting communities using asymptotical Surprise
Nodes in real-world networks are repeatedly observed to form dense clusters, often referred to as communities. Methods to detect these groups of nodes usually maximize an objective function, which implicitly contains the definition of a community. We…
Authors: V.A. Traag, R. Aldecoa, J-C. Delvenne
Detecting comm unities using asymptotical surprise V.A. T raag, 1, 2 , ∗ R. Aldecoa, 3 and J-C. Delvenne 4 1 R oyal Netherlands Institute of Southe ast Asian and Caribb e an Studies, L eiden 2 e-Humanities Gr oup, R oyal Netherlands A cademy of A rts and Scienc es, Amster dam 3 Dep artment of Physics, Northe astern University, Boston 4 ICTEAM, Université c atholique de L ouvain, L ouvain-la-Neuve No des in real-world netw orks are rep eatedly observed to form dense clusters, often referred to as comm unities. Metho ds to detect these groups of no des usually maximize an ob jectiv e function, whic h implicitly contains the definition of a communit y . W e here analyze a recently proposed measure called surprise, which assesses the qualit y of the partition of a net work in to communities. In its curren t form, the formulation of surprise is rather difficult to analyze. W e here therefore develop an accurate asymptotic approximation. This allo ws for the developmen t of an efficient algorithm for optimizing surprise. Inciden tally , this leads to a straightforw ard extension of surprise to weigh ted graphs. A dditionally , the approximation makes it possible to analyze surprise more closely and compare it to other metho ds, esp ecially mo dularity . W e show that surprise is (nearly) unaffected by the well known resolution limit, a particular problem for mo dularit y . How ever, surprise may tend to o verestimate the n umber of communities, whereas they ma y be underestimated b y mo dularit y . In short, surprise works w ell in the limit of many small comm unities, whereas mo dularit y w orks b etter in the limit of few large communities. In this sense, surprise is more discriminative than mo dularity , and ma y find comm unities where mo dularit y fails to discern an y structure. I. INTR ODUCTION Net works are often used as a mo del to describ e in ter- actions among comp onen ts of a system [ 1 , 2 ]. In its sim- plest form, a netw ork is comp osed of a set of vertices (also called no des) and a set of edges connecting them. Many real-w orld systems can b e reduced to this scheme, such as so cial netw orks establishing relations among individuals, proteins interacting within the cell or roads connecting differen t cities [ 3 ]. What caught the interest of the sci- en tific communit y was that most of these real netw orks share high-order structural patterns and dynamics, such as a wide heterogeneity in the num b er of neigh b ors of a no de, the presence of many triangles or a very low net- w ork diameter [ 4 , 5 ]. Another feature observ ed in real net works is the presence of densely connected groups of no des, kno wn as communities [ 6 ]. No des in the same group usually share similar c haracteristics or functions and, therefore, methods to detect comm unities in net- w orks are of m uc h in terest across differen t fields [ 7 – 12 ] Researc hers ha ve prop osed numerous strategies to de- tect the communit y structure of a netw ork [ 6 , 13 – 15 ]. Ul- timately , most metho ds optimize a given ob jective func- tion to find a partition into comm unities. This function con tains, either explicitly or implicitly , its o wn defini- tion of a comm unity . Mo dularit y [ 16 ] has been, since its inception, the most extensively used measure for comm u- nit y detection. It b elongs to a wider class of functions in whic h comm unities are defined by Potts mo del spin states and the qualit y of the partition is given by the energy of the system [ 17 , 18 ]. Although this approach based on statistical mec hanics may be app ealing, em- ∗ traag@kitlv.nl pirical evidence shows that in man y cases these meth- o ds are unable to capture the exp ected communities of the netw ork [ 15 , 19 – 22 ]. In fact, numerous studies hav e p oin ted out strong theoretical limitations of mo dularit y approac hes for communit y detection [ 23 – 29 ]. A prop osed measure based on classical probability , called surprise [ 30 ], has b een sho wn to systematically out- p erform modularity-based metho ds on differen t b enc h- marks [ 15 , 21 ]. Here w e demonstrate how surprise can b e expressed under an information-theoretic framew ork, b y examining its asymptotic formulation. In particular, we describ e surprise in terms of the Kullback-Leibler (KL) div ergence [ 31 ]. This asymptotic formulation allo ws us to develop, for the first time, an efficien t surprise max- imization algorithm. Inciden tally , this also points to a straigh tforward extension of surprise to w eighted graphs. A dditionally , this enables a better analysis of its p er- formance, and allo ws an analytic comparison to other metho ds. In particular, we compare surprise to a mo dularit y mo del and the recently in tro duced measure of signifi- cance, which also detects comm unities based on the KL- div ergence [ 22 ]. W e show that surprise is more dis- criminativ e than mo dularit y using an Erdös-Rényi (ER) n ull mo del, and that significance and surprise b eha ve relativ ely similar. A dditionally , we analyze the limita- tions of communit y de tection, most notably the resolu- tion limit [ 23 ] and the detectability threshold [ 32 ]. W e sho w that surprise is (nearly) unaffected by the resolu- tion limit, and works well in the limit of large num b er of communities with fixed communit y sizes. How ever, in the limit of large communit y sizes with a fixed num b er of comm unities, surprise wo rks worse than ER mo dularit y , as it tends to find smaller subgraphs within those larger comm unities. Apart from the choice of the null mo del, a key com- 2 Graph v ariables n Num b er of no des m Num b er of edges M = n 2 Num b er of p ossible edges p = m M Densit y Comm unity v ariables n c Num b er of no des in communit y c m c Num b er of edges in communit y c h m c i Exp ected num b er of edges in communit y c p c = m c ( n c 2 ) Densit y of communit y c P artition v ariables m int = P c m c T otal internal edges M int = P c n c 2 T otal p ossible internal edges q = m int m F raction of internal edges h q i = M int M Exp ected fraction of in ternal edges T ABLE I. V ariables. p onen t in comm unity detection is how the difference b e- t ween the actual communit y structure and the null mo del is quantified. Relying on the KL-divergence to measure suc h difference results in more discriminative metho ds. W e b eliev e that this fact can improv e current and future comm unity detection strategies. I I. SURPRISE In general, we denote a graph by G = ( V , E ) consisting of no des V = { 1 , . . . , n } and edges E ⊆ V × V , whic h has n = | V | no des and m = | E | links. The total num b er of p ossible links is denoted by M = n 2 , and the ratio of present links p = m M is known as the density of the graph. The general aim is to find a go o d partition V = { V 1 , V 2 , . . . , V r } of the graph, where each V c ⊆ V is a set of no des, which we call a comm unity . Suc h comm u- nities are non-o verlapping (i.e. V c ∩ V d = ∅ for all c 6 = d ) and co ver all the no des (i.e. S V c = V ). Each communit y consists of n c = | V c | no des and contains m c = | E c | edges. Ob viously then P c n c = n , but the total num b er of inter- nal edges m int = P c m c is smaller than the total num b er of edges so that m int ≤ m . An ov erview of the relev an t v ariables is provided in T able I . Surprise is a statistical approac h to assess the qual- it y of a partition into communities. Giv en a graph with n no des, there are M = n 2 p ossible w ays of dra wing m edges. Out of those, there are M int = P c n c 2 p os- sible wa ys of drawing an internal edge. Surprise is then defined as the (minus logarithm of the) probabilit y of ob- serving at least m int successes (internal edges) in m draws without replacement from a finite p opulation of size M con taining exactly M int p ossible successes [ 30 , 33 ]: S ( V ) = − log min( m,M int ) X i = m int M int i M − M int m − i M m , (1) whic h deriv es from the hypergeometric distribution. 1. Asymptotic formulation Ho wev er, this formulation presents some difficulties. It is not straightforw ard to work with, nor is it simple to implemen t in an optimization pro cedure, mainly due to n umerical computational problems. Since w e are usually in terested in relativ ely large graphs, an asymptotic ap- pro ximation may provide a go od alternativ e. The asymp- totic expansion w e consider here assumes that the graph gro ws, but that the relative n umber of internal edges q = m int m and the relative n umber of exp ected internal edges h q i = M int M remains fixed. By only considering the dominan t term, w e obtain a simple and elegan t appro xi- mation (see App endix A ) S ( V ) ≈ mD ( q k h q i ) , (2) where D ( x k y ) is the KL divergence D ( x k y ) = x log x y + (1 − x ) log 1 − x 1 − y . (3) The KL divergence measures the distance b et ween tw o probabilit y distributions (although it is not a prop er met- ric), with in this case the Bernoulli probability distribu- tions x , 1 − x and y , 1 − y . Notice that, in general, D ( x k y ) 6 = D ( y k x ) . In this case, q and h q i denote the probabilit y that a link lies (or is exp ected to lie) within a comm unity . Whenever q = h q i , we ha ve that D ( q k h q i ) = 0 and, otherwise, D ( q k h q i ) > 0 . Since we are lo oking for relatively dense comm unities, we generally ha ve q > h q i . The original formulation of surprise in Eq. ( 1 ), based on a hypergeometric distribution, can b e accurately ap- pro ximated b y a binomial distribution. The only dif- ference b et ween both approaches is that in the former links are dra wn without replacement. Consider again q = m int m , the fraction of internal edges in the partition, and h q i = M int M , the exp ected fraction of internal edges. The binomial form ulation of surprise w ould then b e S ( V ) = − log min( m,M int ) X i = m int m i h q i i (1 − h q i ) m − i (4) The asymptotic developmen t for the dominan t term of binomial surprise is simpler. W e use Stirling’s appro xi- mation, log n k ≈ n H k n (5) 3 where H ( x ) = − x log x − (1 − x ) log(1 − x ) is the (binary) en tropy and w e use that m int = q m . Binomial surprise then b ecomes S ( V ) ≈ − m h H ( q ) + q log h q i + (1 − q ) log (1 − h q i ) i = mD ( q k h q i ) Th us, as exp ected, for large sparse netw orks the differ- ence b et w een drawing with or without replacement is negligible. 2. Algorithm Ev aluating the quality of a partition using surprise sho ws excellen t results in standard b enc hmarks. In fact, it has b een sho wn that a meta-algorithm of selecting the partition with the highest surprise, from a set of candi- date solutions provided by the b est communit y detection algorithm solutions, outp erforms any single algorithm by itself [ 15 , 21 , 34 ]. Ho wev er, no algorithm for directly op- timizing surprise has b een developed y et. The asymptotic formulation allows a straigh tforward algorithmic implementation, in a similar fashion as the Louv ain algorithm [ 35 ], whic h was initially designed to optimize mo dularit y . The basic idea of the Louv ain al- gorithm consists of tw o steps. W e mo v e around nodes from one communit y to another so as to greedily improv e surprise. When surprise can no longer b e improv ed b y mo ving around individual no des, w e aggregate the graph, and rep eat the procedu re on the aggregated graph. The aggregation of the graph is simply the contrac- tion of all no des within a communit y to a single “com- m unity no de”. The m ultiplicities of the edges are k ept as weigh ted edges, so that w cd = P i ∈ V c ,j ∈ V d w ij denotes the w eight b et ween the new no des c and d in the aggre- gate graph, where initially w ij = A ij . Here, A ij = 1 if there is an edge b et ween i and j , and 0 otherwise. W e additionally need a no de size to keep track of the total size of the communities, similar to [ 29 ]. Initially we set this node size to n i = 1 , and up on aggregation the node size n c = P i ∈ V c n i is set to the total num b er of nodes within the comm unity . One of the essen tial elements of the Louv ain algorithm is that the surprise of the partition on the aggregated graph is the same as the surprise of the original parti- tion on the original graph. This ensures that moving a no de in the aggregated graph corresponds to moving a whole comm unity in the original graph. In other w ords, if V denotes the partition of G and V 0 = { 1 , 2 , . . . , r } de- notes the default partition of the aggregated graph G 0 , then S ( V , G ) = S ( V 0 , G 0 ) . F or calculating surprise in the aggregated graph, we then use m c = P i,j ∈ V 0 c w 0 ij as the in ternal weigh t and n c = P i ∈ V 0 c n i as the commu- nit y size and n = P c n c . With the other definitions remaining the same, it is straightforw ard to see that S ( V , G ) = S ( V 0 , G 0 ) . Notice that the same formulations can also b e applied to the original graph, when using w ij = A ij and n i = 1 . Using this form ulation of the aggregate graph, it is quite straightforw ard to calculate the improv ement in surprise when moving a no de. Before we mov e no de i from communit y c to communit y d , assume we ha v e m int in ternal edges, and M int p ossible internal edges. The total w eigh t b et w een no de i and communit y c is w ic = P j 6 = i ∈ V c w ij and similarly b et ween node i and comm unity d , with a p ossible self-lo op of w ii . The new in ternal w eight after mo ving no de i from communit y c to communit y d is then m 0 int = m int − w ic + w id . The c hange in M int = P c n c 2 is slightly more complicated. After the mov e, we obtain n 0 c = n c − n i and n 0 d = n d + n i , so that M 0 int = M int + n i ( n i + n d − n c ) . Finally , we use q 0 = m 0 int m and h q 0 i = M 0 int M . The difference in surprise for mo ving no de i from communit y c to comm unit y d is then simply ∆ S ( σ i = c 7→ d ) = m ( D ( q k h q i ) − D ( q 0 k h q 0 i )) , (6) where w e denote the communit y of node i by σ i (i.e. σ i = c if i ∈ V c ). The algorithm can then be simply summarized as follo ws: function Optimizesurprise (Graph G ) while improv ement do σ i ← i for i = 1 , . . . , | V ( G ) | . Initial partition while improv ement do for random v ∈ V ( G ) do σ v ← arg max d ∆ S ( σ v = c 7→ d ) end for end while σ 0 i = σ σ 0 i Communit y in original graph. G ← A ggrega teGraph ( G ) end while return σ 0 end function Inciden tally , our formulation for surprise for the aggre- gated graph yields a w eighted v ersion of surprise. While k eeping the same form ulation of surprise as in Eq. ( 2 ), we only need to change the definitions of q and h q i . Then q = P c w c /w where w c = P i,j ∈ V c w ij is the internal w eight and w = P ij w ij is the total weigh t. Assuming then a uniform distribution of weigh ts across the graph in the random graph, the expected weigh ts of an edge w ould b e h w i , which would not sho w to o m uch devia- tion. The total p ossible internal weigh t is then h w i M int , while the total p ossible weigh t would b e h w i M . Hence, h q i = M int / M remains unchanged. W e provide an op en-source, fast and flexible C++ im- plemen tation of the optimization of surprise using the Louv ain algorithm. It is suitable for use in python using the igraph pack age. This implementation is av ailable from GitHub 1 as louvain-igraph and from PyPi 2 sim- 1 https://github.com/vtraag/louvain- igraph 2 https://pypi.python.org/pypi/louvain/ 4 ply as louvain and implements v arious other metho ds as well. I II. COMP ARISON W e now review how surprise compares to some closely related methods. There are man y other metho ds s till, and w e cannot do all of them justice here. F or a more comprehensiv e review, please refer to [ 6 , 36 ]. A. Mo dularit y Although relativ ely recent, mo dularit y has rapidly be- come an extremely p opular metho d for communit y detec- tion. The general idea is that we w ant to find a partition, suc h that the communities hav e more internal links than exp ected. In its original formulation, mo dularit y assumes a null mo del in which the degree k i of a no de is fixed [ 16 ], the so called configuration mo del [ 37 ]. This implies that the exp ected num b er of internal edges is h m c i = K 2 c 4 m , (7) where K c = P i ∈ V c k i is the total degree of no des in com- m unity c . Mo dularit y compares this v alue to the ob- serv ed num b er of edges m c within the communit y , and simply sums the difference. The measure is usually nor- malized by the total num b er of edges, obtaining Q CM ( V ) = 1 m X c m c − K 2 c 4 m . (8) This random graph null model represents the configura- tion model, where the degree dep endency of the no des is tak en into account. W e therefore refer to it as the CM mo dularit y . Alternativ e deriv ations of mo dularit y hav e b een pro- p osed, some of them with differen t null mo dels [ 17 ]. Sur- prise implicitly assumes a null mo del in which every edge app ears with the same probability p , as in an ER random graph. The n umber of exp ected edges in a comm unity of size c is thus h m c i = p n c 2 . (9) Plugging this null mo del into mo dularit y , we obtain its ER version [ 17 ] Q ER ( V ) = 1 m X c m c − p n c 2 , (10) There is an in teresting relationship b et ween this ER mo dularit y and surprise. Given that p = m/ M , we can write Q ER ( V ) = X c m c m − X c n c 2 M (11) = q − h q i . (12) By Pinsk er’s inequality this is related to the KL diver- gence as q − h q i ≤ r 1 2 D ( q k h q i ) , (13) and, therefore, S ( V ) = mD ( q k h q i ) ≥ 2 m Q ER ( V ) 2 . (14) This implies that whenever surprise is low, mo dularit y is also low. Whenever a go od partition (in the sense of b e- ing differen t from random) cannot b e found b y surprise, it is unlikely that mo dularit y will b e able to find one. While Eq. ( 14 ) is sometimes tigh t, on some partitions surprise can b e m uch larger than mo dularit y , making it more likely to be selected as optimal while escaping the scrutin y of mo dularit y optimization. In this sense, sur- prise is more discriminative than modularity T o illustrate this, consider a one dimensional circular lattice with neigh b ors within distance 3 . In other words, no de i is connected to no des i − 3 mo d n to i + 3 mod n (excluding the self-lo op). W e create partitions consist- ing of r communities by grouping consecutive no des such that n/r no des are in the same comm unity . The ER mo dularit y reaches its maxim um with just a few com- m unities (Fig. 1 ). Mo dularit y indeed often detects only few comm unities, part of the problem of its resolution limit [ 23 , 24 , 29 ]. Both surprise and significance (see next section), still increase whereas ER mo dularit y is already decreasing again. ER mo dularit y may not be able to dis- cern partitions with man y communities, whereas surprise and significance can. On the other hand, when surprise go es to 0 we see that ER mo dularit y indeed also go es to 0 , showing the upper b ound pro vided b y surprise. B. Significance Significance [ 22 ], a recen tly introduced ob jective func- tion to ev aluate comm unit y structure qualit y , presents an approach similar to surprise. Surprise describ es how lik ely it is to observ e m int in ternal links in communities. Significance, on the other hand, looks at how lik ely such dense communities app ear in a random graph. Compar- ing the tw o measures is not immediately straightforw ard. On the one hand, if dense communities are unlikely to b e presen t in a random graph (high significance), then a comm unity is also unlikely to contain many links at ran- dom (high surprise). On the other hand, if a communit y is unlikely to con tain man y links at random (high sur- prise), p erhaps there are still communities elsewhere in the random graph that con tain so many links. Therefore w e should compare the tw o more formally to make more exact statements. Asymptotically , significance is defined as Z ( V ) = X c n c 2 D ( p c k p ) , (15) 5 0 5,000 10,000 15,000 20,000 25,000 30,000 0 2 4 × 10 6 No. Communities r Qualit y Surp rise Significance ER mo dula rity 10 0 10 2 10 4 0 2 4 × 10 6 FIG. 1. (Color online) Comparison of bounds. W e sho w the qualit y of partitions of a lattice in r comm unities. ER mod- ularit y quic kly reac hes a maximum for few comm unities (w e sho w 2 mQ 2 ER rather than Q ER for comparison). Both signifi- cance and surprise reach a maximum for m uch more commu- nities. This illustrates that ER mo dularit y is simply unable to discern partitions with such a high num b er of communities. The inset shows the same data, but on a logarithmic x-axis. where p c = m c / n c 2 is the densit y of comm unit y c , p is the density of the graph and D ( x k y ) is again the KL divergence. Significance also show ed a great p erfor- mance in standard b enc hmarks, and help ed to determine the prop er scale of resolution in multi-resolution me t h- o ds [ 22 ]. Both surprise and significance are based on the KL di- v ergence to compare the actual num b er of internal edges to the exp ected one. How ev er, they do so in differen t w ays. Whereas surprise compares suc h difference using global quan tities, q and h q i , significance compares each comm unity density p c to the a verage graph density p . This implies, among other things, that only signifi- cance is affected by the actual distribution of edges b e- t ween communities. In particular, mo ving edges from a denser comm unity (with a high p c ) to a sparse comm unit y (with a low p c ), generally decreases the v alue of signifi- cance. This means that if all comm unities hav e the same densit y , c eteris p aribus , significance is minimal. This in- tuition is confirmed by conv exity of the KL div ergence (see App endix B ), so that significance is low er-b ounded b y Z ( V ) ≥ M int D ( h p c i k p ) (16) with the w eighted a verage density h p c i = X c n c 2 M int p c = m int M int = p q h q i . (17) Con vexit y of the KL divergence, also sho ws that Z ( V ) ≥ S ( V ) (18) whenev er h q i < p (see App endix B ). T o gain more insight, w e can slightly rewrite h q i to obtain h q i = P c n c 2 n 2 ≈ P c n 2 c n 2 = 1 r h n 2 c i h n c i 2 . (19) Then, in general, h q i will b e inv ersely prop ortional to the n umber of communities, and increases with the v ariance of the communit y sizes n c . Hence, if the n umber of com- m unities is relatively large (small h q i ), or the netw ork is relativ ely dense (large p ), significance is more discrimi- nativ e than surprise. How ev er, in the case that h q i > p , surprise can b e more discriminativ e than significance (see app endix B ). Notice that if h q i = p , then p c = q , so that D ( h p c i k p ) = D ( q k h q i ) and significance and surprise v alues are close to each other. Therefore, the tw o mea- sures are exp ected to b eha v e relatively similar, esp ecially for h q i ≈ p . Nonetheless, in dense netw orks with many comm unities significance w ould b e more discriminative, whereas for fewer communities or sparse graphs, surprise w ould sho w a b etter p erformance. IV. LIMIT A TIONS Although mo dularit y was lauded b y the possibility to detect communities without spec ifying the num b er of comm unities, this came at a certain price. One of the b est kno wn problems in comm unity detection is the res- olution limit [ 23 ], whic h preven ts mo dularit y from de- tecting small communities. It th us tends to underesti- mate the num b er of communities in a graph, and lumps together several smaller comm unities in larger comm uni- ties. Moreov er, this dep ends on the scale of the graph, so that modularity has a problem of scale. It was sho wn that this is the case for b oth ER and CM mo dularit y , and that other null mo dels also suffer from the same dra w- bac ks [ 24 ]. In fact, most metho ds are expected to suf- fer from this problem, and only few methods are able to av oid it completely [ 29 ]. A dditionally , there is also a lo wer coun terpart to the resolution limit, leading to un- necessary splitting of cliques [ 38 , 39 ]. Finally , mo dularit y is also my opic, cutting across long dendrites [ 40 ]. An- other fundamen tal limit in communit y detection is called the detectability threshold [ 32 ], which also has some coun ter-intuitiv e effects [ 41 ]. This preven ts any method from correctly detecting comm unities b ey ond this thresh- old. The asymptotic formulation of surprise enables us to understand b etter how it p erforms with respect to these limitations. A. Resolution limit The resolution limit is traditionally studied through the ring of cliques [ 23 ]. This is a graph consisting of r cliques (i.e. completely connected subgraphs) connected only by one link b et ween tw o cliques to form a ring. This 6 is one of the most mo dular structure p ossible: we cannot delete more than one link b et ween communities and still k eep it connected, while we cannot add any more links within the cliques. When a metho d starts to join the cliques, it can no longer detect the smaller cliques, and so a fortiori , cannot detect less w ell defined subgraphs ei- ther. W e denote by q 1 (and h q 1 i ) the (exp ected) prop or- tion of edges within comm unities for the partition where eac h communit y contains a single clique and use q 2 (and h q 2 i ) for the partition where eac h comm unity con tains t wo cliques. T o facilitate the deriv ation, we w ork with self-lo ops (and directed edges), so that the total n um b er of edges is n 2 c within comm unities resp ectiv ely . Let r de- note the n umber of cliques. Then obviously n = r n c and m = r n 2 c + 2 r . F or the partition of eac h clique in its own comm unity we then obtain q 1 = n 2 c n 2 c + 2 , h q 1 i = 1 r , (20) while for the partition with 2 cliques merged w e obtain q 2 = n 2 c + 1 n 2 c + 2 , h q 2 i = 2 r . (21) Hence, q 2 = q 1 + with = 1 n 2 c +2 and h q 2 i = 2 h q 1 i . The difference of surprise is ∆ S = S 2 − S 1 m = D ( q 2 k h q 2 i ) − D ( q 1 k h q 1 i ) (22) whic h w orks out to ∆ S = q 1 log q 2 h q 2 i h q 1 i q 1 + (1 − q 1 ) log 1 − q 2 1 − h q 2 i 1 − h q 1 i 1 − q 1 + log q 2 h q 2 i 1 − h q 2 i 1 − q 2 . (23) Appro ximating r − 2 ≈ r − 1 ≈ r we obtain ∆ S ≈ − D ( q 1 k q 2 ) − q 1 log 2 + log r 2 q 2 1 − q 2 . (24) Solving for r at the p oin t at which ∆ S = 0 yields r = 2 1 − q 2 q 2 exp 1 D ( q 1 k q 2 ) 2 q 1 (25) whic h scales as r ∼ 2 n 2 c n 2 c so that for larger r surprise starts to merge cliques. W orking out the inequality for b oth CM and ER mo d- ularit y we obtain that r ∼ n 2 c . Hence, the n um b er of cliques r at which mo dularit y starts to merge cliques lies considerably low er than for surprise and gro ws linearly with the square of comm unit y sizes rather than expo- nen tially . So, although surprise shows a similar prob- lem as mo dularit y , it only starts to show at really large graphs, so is unlikely to b e a problem in any empirical graph. Indeed, this demonstrates exactly the key differ- ence b et ween modularity and surprise: The first is unable to detect relativ ely small communities in large graphs, whereas the latter has (nearly) no suc h difficulties. B. Detectabilit y threshold In order to study the detectabilit y threshold, we first in tro duce the planted partition mo del. This means, that w e build a graph such that it will contain a sp ecified par- tition: W e plan t it in the graph. W e create n no des and assign each no de to a certain communit y . An edge within a communit y is created with probability p in , whereas an edge in betw een tw o communities is created with proba- bilit y p out . W e define the probability of an internal edge p in and the probabilit y of an external edge to be resp ec- tiv ely p in = (1 − µ ) k n c − 1 , p out = µk n − n c , (26) so that the av erage degree is k and µ is the probabil- it y that an edge is b et ween communities. When µ = 0 all links are thus placed within the planted communities, whereas for µ = 1 all links are placed b et w een the planted comm unities. Uncov ering the planted communities cor- rectly is trivial for µ = 0 but b ecomes increasingly more difficult for higher µ . The av erage degree within a clus- ter is k in = (1 − µ ) k while the a verage degree betw een clusters is k out = µk . W e denote comm unit y sizes b y n c for the r different comm unities. Notice that, most conv eniently , q = 1 − µ , while h q i = 1 r h n 2 c i h n c i 2 . W e can thus easily calculate S plt the sur- prise for the planted partition. Since S > 0 b y def- inition, communities can th us only b e detected when 1 − µ > 1 r h n 2 c i h n c i 2 . This yields the rather trivial detectability threshold of µ < r − h n 2 c i h n c i 2 r . (27) In the case of equi-sized comm unities, this reduces to the familiar trivial threshold µ < r − 1 r [ 19 ]. Ho wev er, due to stochastic fluc tuat ion, the commu- nities b ecome already ill-defined prior to the threshold. Indeed S = 0 provides a rather naiv e b ound, since S > 0 also in random graphs. In general, S = 0 for b oth trivial partitions of one large communit y and n small commu- nities (since then q = h q i ), so that optimizing surprise in a random graph will yield some partition with strictly p ositiv e surprise. This implies that at some (lo w er) crit- ical µ ∗ the communit y structure is essentially no longer discernible from the communit y structure in a random graph. Hence, w e should not consider when S plt > 0 but when S plt > S rnd where S rnd is the surprise attainable in a random graph. W e first examine the case with r = 2 and n c = n/ 2 . Previous literature found a detectabil- it y threshold for k in − k out ≤ √ k in + k out [ 32 , 42 , 43 ]. Bey ond this threshold, the optimal bisection b ecomes in- discernible from an optimal bisection in a random graph. This threshold thus coincides with the expected n umber of in ternal edges for an optimal bisection in a random graph. W e can use this to calculate S rnd (2) the max- im um surprise for a bisection in a random graph. Let 7 2,000 4,000 6,000 8,000 10,000 1 1.01 No. Nodes n Qualit y ratio Fixed n c 200 400 600 800 1,000 1 1.5 No. Nodes n Qualit y Ratio Fixed r Surp rise ER mo dula rity FIG. 2. (Color online) Limitations on communit y detection. W e construct graphs with a planted partition, with a probability of an edge b et ween comm unities of µ = 0 . 1 . W e show the quality ratio S S plt b et ween the quality of the partition found by optimization S and the quality of the planted partition S plt (and similarly for ER mo dularit y). Hence, if the quality ratio S S plt > 1 , the planted partition is no longer optimal. In th e figure on the left we consider the case for fixed communit y size n c = 10 , but increase the num b er of communities r . The results show that in this case surprise finds the plan ted partitions, whereas ER mo dularit y has more difficulties, in line with our analysis. This is mostly due to the resolution limit in mo dularit y , whic h underestimates the n um b er of comm unities. In the figure on the righ t we consider the case of a fixed n umber of comm unities r = 2 but an increasing comm unity size n c . In this case, surprise quickly finds other partitions than the plan ted partition, whereas mo dularit y remains closer to the planted partition, consistent with our analysis. This is mostly b ecause surprise tends to find substructure in the rather large communities arising from random fluctuations, which thus ov erestimates the num b er of communities. How ever, mo dularit y also has some difficulty in finding the plan ted partition. This figure shows the a verage ov er 5 replications for each setting, and the error bars show the standard deviation. us denote by q rnd (2) the probability an edge is within a communit y in the b est bisection for a random graph. Substituting k in = q rnd (2) k and k out = (1 − q rnd (2)) k and solving for q rnd (2) yields q rnd (2) = 1 2 1 + r 1 k ! . (28) W e thus obtain S rnd (2) = mD ( q rnd (2) k 1 2 ) for the max- im um surprise for a bisection in a random graph. If S plt (2) < S rnd (2) the planted partition is no longer op- timal, and we will likely find an alternative partition with surprise equal to S rnd (2) . The threshold is then µ ∗ = 1 − q rnd (2) , congruen t with previous results. So, in general, surprise is expected to sho w similar b eha vior concerning the detectabilit y threshold as other metho ds. Ho wev er, this analysis restricts itself to finding the same n umber of communities (i.e. tw o in this case), while it is p ossible that an optimal partition w ould split the graph in more comm unities. In other w ords, w e need to compare the surprise of the planted partition to the max- im um surprise in a random graph, while allowing more than tw o comm unities. Although the exp ected v alue of the maxim um surprise in a random graph is not easy to find, a random graph is likely to contain a near p erfect matc hing. Using that, w e can derive a lo wer b ound on the exp ected surprise in a random graph. In such a per- fect matching there are r = n 2 comm unities which con- tain 1 link each. F or a graph that contains m = nk edges, then q = 1 2 k while h q i = 2 n . This leads to a surprise of ap- pro ximately S rnd ( n 2 ) ∼ n 2 log n 4 k . Hence, whenever we ob- tain that S plt ≤ S rnd ( n 2 ) optimization should find another partition than the planted one. In the case of t wo planted comm unities, we require that D (1 − µ k 1 2 ) ≥ log n 4 k 2 k to mak e sure that we still detect the tw o clusters. Although w e cannot solve explicitly for µ , this inequality shows that n is b ounded ab o ve b y n ≤ 4 k e 2 kD ( 1 − µ k 1 2 ) . (29) If n grows large, there is lik ely some structure arising from random fluctuations within the planted communi- ties. Notice that there are likely b etter partitions than a p erfect matching. W e can therefore exp ect the actual critical n for whic h the planted partition is no longer op- timal to b e lo wer. W e can similarly derive such thresholds for ER mo d- ularit y . F or a p erfect matching the ER modularity is Q rnd ( n 2 ) = 1 2 k − 2 n . Then solving Q plt ≤ Q rnd ( n 2 ) gives us an estimate of when ER mo dularit y is likely to find an alternative partition (i.e. a p erfect m a tching in this case). The critical µ ∗ can in this case b e explicitly de- riv ed and yields µ ∗ = 1 2 1 − 1 k + 4 n . Ho w ever, the de- 8 tectabilit y threshold is already reached b efore that p oin t at µ ∗ = 1 2 1 − q 1 k , lea ving n essen tially unbounded. Again, there will b e better partitions than a p erfect matc hing, so that n may still b e b ounded to some ex- ten t. Nonetheless, this sho ws that ER mo dularit y is less affected b y the size of the comm unities than surprise, and is less lik ely to find substructure within the planted comm unities. In summary then, surprise do es not tend to suffer from the resolution limit, but do es quickly find substructure due to random fluctuations. ER mo dularit y on the other hand suffers from a resolution limit, but tends to ignore substructure in comm unities. Stated differently , for a plan ted partition mo del with r comm unities and n = r n c no des, surprise and ER mo dularit y w ork w ell in differen t limits. Whenever r → ∞ with n c fixed, surprise works w ell but ER modularity w orks po orly . Whenev er r is fixed but n c → ∞ , ER mo dularit y works well, but sur- prise works p oorly . An interesting question would con- cern which metho d would work w ell for b oth limits. V. EXPERIMENT AL RESUL TS W e here confirm our theoretical results exp erimen tally . W e first show n umerically that the asymptotic form u- lation of surprise provides an excellen t appro ximation. Secondly , w e v alidate the inequalities b et ween surprise, significance and ER mo dularit y . Thirdly , we sho w the differen t limitations on surprise and mo dularit y . Finally , w e demonstrate that the asymptotic formulation of sur- prise p erforms very well in LFR b enc hmarks [ 44 ]. F or comparing the asymptotic formulation with the ex- act hypergeometrical and binomial form ulation, w e used regular ro oted trees with three children. T o create such trees, we first create the root no de, and add three c hildren to this ro ot no de. W e then keep on adding children to the lea ves of the tree until we obtain the desired num b er of no des. W e use trees to minimize the n umber of edges to prev ent n umerical problems with the h yp ergeometrical and binomial form ulation. Using relatively large num- b ers results in numerical issues, prev enting a comparison to the asymptotic form ulation. W e optimize asymptotic surprise using the Louv ain algorithm to find a partition on this graph. As can b e seen in Fig. 3 , the approxi- mation is quite go o d, and the appro ximation ratio tends to 1 . Notice that the n umber of no des in these graphs is limited to 200 , whereas complex netw orks are usually m uch larger. Hence, we expect the approximation to b e accurate for an y real netw ork. T o demonstrate the limitations on surprise and (ER) mo dularit y w e create some test netw orks with a plan ted partition. W e generate netw orks with av erage degree h k i = 10 and set µ = 0 . 1 . In the first test, w e create net works with fixed communit y sizes n c = 10 and v ary the num b er of comm unities r . In the second test, we hav e fixed the n umber of communities to 2 but v ary the com- 0 20 40 60 80 100 120 140 160 180 200 0 200 400 No. No des n Surp rise S Asymptotic Hyp ergeometric Binomial 0 50 100 150 200 1 Ratio FIG. 3. (Color online) Appro ximation of surprise. The asymptotic formulation of surprise, using the KL diver- gence, approximates well b oth the binomial and the hyper- geometric surprise. The inset shows the approximation ra- tio S asym / S hyper and S asym / S binom , b oth going to 1 for large graphs. m unity size n c from 10 to 500 . W e consider whether the plan ted partition remains optimal by analyzing the qual- it y of the plan ted partition S plt (or Q plt for mo dularit y) and the partition found through optimization S (or Q for mo dularit y). Whenev er S plt < S w e thus kno w that the planted partition remains no longer optimal. The results sho wn in Fig. 2 clearly confirm our theoretical analysis. In the case where r → ∞ with fixed n c , sur- prise does w ell, whereas (ER) modularity suffers from the resolution limit. In the case that r is fixed to r = 2 , but n c → ∞ , surprise do es less w ell, as it tends to find subgraphs within the t wo large comm unities. Mo dular- it y also has problems identifying the optimal bisection. Indeed, the unco vered partitions do not coincide e xactly with the planted partition, even though the mo dularit y v alue remains rather similar. Such partitions are likely to occur b ecause of the degeneracy of modularity [ 20 ]. Nonetheless, our results show that the mo dularit y of the plan ted partition remains (nearly) optimal, whereas sur- prise for the plan ted partition clearly diminishes com- pared to surprise of the uncov ered partitions. W e also tested the v arious metho ds more extensively using benchmark graphs with a more realistic comm u- nit y size and degree distribution [ 44 ]. W e set the a v- erage degree h k i = 20 while the maximum degree is 50 and follows a p o werla w degree distribution with exp o- nen t 2 . Plan ted comm unity sizes range from 10 to 50 for the “small” communities, and from 20 to 100 for “large” comm unities. The planted communit y sizes are also dis- tributed according to a p o werla w, but with an exp onen t of 1 . The parameter µ again con trols the probability of in ternal links. In Fig. 4 we sho w the function v alues for surprise, sig- nificance and ER mo dularit y . This clearly shows that the inequalities hold o ver the whole range of mixing parame- ters. At the same time, they sho w v ery similar b eha vior to each other. Although this could indicate a relatively 9 0.2 0.4 0.6 0.8 1 10 1 10 2 10 3 10 4 10 5 Mixing Pa rameter µ Qualit y Surp rise Significance ER Mo dula rity FIG. 4. (Color online) Inequalities. In most cases significance is more discriminative than surprise, whic h is more discrimi- nativ e than the ER mo dularit y , so that Z > S > Q ER . These inequalities clearly hold ov er the wh o le range of the mixing parameter µ for LFR b enc hmarks ( n = 10 4 ). F or ER modu- larit y we display 2 m Q 2 ER as used in Eq. ( 14 ). similar p erformance, we next sho w this is not the case. In Fig. 5 w e sho w the b enc hmark results for the four differen t methods. Surprise and significance per- formances are very go o d, and clearly muc h b etter than b oth mo dularit y mo dels. Notice that, surprise and ER mo dularit y use the same global quantities. How ever, the use of the KL divergence gives the former a muc h greater adv antage, as exp ected from Eq. ( 14 ). LFR b enchmark graphs hav e a clearer communit y structure for larger graphs. The critical mixing param- eter at which the inner communit y densit y equals the outer comm unity densit y is roughly µ ≈ 1 − n c n , so that with growing n this threshold go es to 1 . Both surprise and significance start to w ork b etter for somewhat larger graphs, consisten t with the clearer communit y structure. This is in a sense the opp osite of both ER and CM mo d- ularit y . Their p erformance is worse for larger graphs, consisten t with our earlier analysis of the limitations of comm unity detection. VI. CONCLUSION Comm unity detection is an imp ortan t topic in the field of complex netw orks, as it can give us a b etter under- standing of real-w orld netw orks. Here we analyzed a re- cen t measure known as surprise. W e dev elop ed an accu- rate asymptotic approximation, based on the KL diver- gence which we use to dev elop a comp etitiv e new algo- rithm. Applying this algorithm to standard b enc hmarks, w e show its great p oten tial. Significance, another qual- it y measure also based on the KL divergence p erforms similar to surprise. W e show ed analytically that surprise is more discrim- inativ e than modularity with an ER null mo del. This is mainly due to the use of the KL divergence to quan tify the difference b et ween the empirical partition and the n ull mo del. The larger the netw ork and the smaller the comm unities, the b etter KL methods p erform with re- sp ect to mo dularit y . Indeed, whereas modularity suffers from the resolution limit, this problems (nearly) do esn’t affect surprise. On the other hand, surprise tends to find substructure in larger communities, arising from random fluctuations, whereas this problems app ears less promi- nen t for modularity . In short, mo dularit y tends to w ork w ell in the limit of communit y sizes n c → ∞ keeping the n umber of comm unities r fixed. Surprise on the other hand w orks well when r → ∞ keeping the communit y sizes n c fixed. Stated differen tly , mo dularit y tends to underestimate the num b er of communities, whereas sur- prise tends to ov erestimate the n umber of communities. The question of which metho d works well in b oth limits deserv es further study . The slight differences b et w een surprise and significance stem from t w o things either the one or the other mea- sure ignores. Significance relies on the fraction of edges that are present within a comm unity . It thus implicitly considers missing edges within communities, b ecause this fraction is relativ e to the total num b er of possible edges within that comm unity , whic h surprise do es not. Sur- prise on the other hand, considers the fraction of total edges that fall within comm unities. It th us implicitly considers edges that fall b et ween communities, whereas significance do es not. Indeed, it should be p ossible to address these shortcomings by also explicitly examining missing links (for surprise) or links betw een communities (for significance). Another shortcoming is that surprise do es not dep end on the actual distribution of the in ternal edges among comm unities. One w a y to address this issue is to con- sider edges for all comm unities separately , by using a m ultiv ariate h yp ergeometric distribution. In that case, w e would b e interested in the probability to observ e m cd edges b et ween comm unities c and d as Pr( X cd = m cd ) = Y cd n c n d m cd M m . (30) Again deriving an asymptotic expression, we arrive at S ( V ) = m X cd q cd log q cd h q cd i = mD ( q k h q i ) (31) where q cd = m cd m is the fraction of edges b et ween com- m unities c and d and h q cd i the exp ected v alue. In terestingly , the extension of surprise in Eq. ( 30 ) is iden tical to a sto c hastic blockmodel (using an ER null mo del) [ 45 , 46 ]. Ho wev er, Karrer and Newman found that this metho d did not w ork satisfyingly [ 45 ]. This migh t b e b ecause the measure do es not fo cus on comm u- nities specifically , but rather on all types of blo c k struc- tures. Hence, there is no reason wh y a communit y struc- ture should maximize this lik eliho od, rather than an y 10 0.2 0.4 0.6 0.8 1 0 0.2 0.4 0.6 0.8 0.2 0.4 0.6 0.8 1 0 0.2 0.4 0.6 0.8 0 0.2 0.4 0.6 0.8 0 0.2 0.4 0.6 0.8 0 0.2 0.4 0.6 0.8 n = 2 000 n = 4 000 n = 6 000 n = 8 000 n = 10 000 Small Comms. La rge Comms. NMI Mixing Pa rameter µ Surp rise Significance ER mo dula rity CM modularit y FIG. 5. (Color online) Benchmark results. The first row shows results for “small” communities, which range from 10 – 50 , while the second row contains results for “large” communities, ranging from 20 – 100 . The communit y sizes are pow erlaw distributed with exponent 1 . W e set the av erage degree h k i = 20 and the maxim um degree is 50 , whic h follo ws a p o werla w degree distribution with exp onen t 2 . Both surprise and significance p erform very well, esp ecially for relatively large graphs, where ER and CM mo dularit y fail. This difference is more notable for smaller communities, for which b oth ER and CM modularity hav e difficulties. This is in part due to the well-kno wn resolution limit and in line with our earlier analysis. other type of blo c k structure. One p ossible w ay to ad- dress this is to compare our partition to the ideal type w e are lo oking for, rather than maximizing the difference to a random null mo del. This would b e an in teresting a ven ue to consider in future researc h. [1] R. Alb ert and A.-L. Barabási, Rev. Mo d. Phys. 74 , 47 (2002) . [2] S. Dorogovtsev, L e ctur es on c omplex networks (Oxford Univ ersity Press, 2010). [3] M. Newman, Networks: An Intr o duction (Oxford Uni- v ersity Press, USA, 2010). [4] A.-L. Barabási and R. Alb ert, Science 286 , 509 (1999) . [5] D. J. W atts and S. H. Strogatz, Nature 393 , 440 (1998) . [6] S. F ortunato, Ph ysics Rep orts 486 , 75 (2010) . [7] M. Girv an and M. E. J. Newman, Pro ceedings of the National A cademy of Sciences of the United States of America 99 , 7821 (2002) . [8] P . M. Gleiser and L. Danon, Adv. Complex Syst. 06 , 565 (2003) . [9] G. P alla and I. Dere, Nature 435 (2005), 10.1038/na- ture03607 . [10] R. Guimerà, S. Mossa, A. T urtsc hi, and L. A. N. Amaral, Pro ceedings of the National Academ y of Sciences of the United States of America 102 , 7794 (2005) . [11] J. M. Olesen, J. Bascompte, Y. L. Dup on t, and P . Jor- dano, Pro c. Natl. A cad. Sci. U. S. A. 104 , 19891 (2007). [12] Y. Lupu and V. T raag, Journal of Conflict Resolution 57 , 1011 (2013) . [13] L. Danon, A. D, and J. Duc h, Journal of Statistical Mec hanics: Theory and Exp erimen t P09008 (2005) . [14] A. Lancichinetti, F. Radicchi, J. J. Ramasco, and S. F or- tunato, PLoS ONE 6 , e18961 (2011) . [15] R. Aldecoa and I. Marín, Scien tific rep orts 3 , 1060 (2013) . [16] M. E. J. Newman and M. Girv an, Physical Review E 69 , 026113 (2004) . [17] J. Reichardt and S. Bornholdt, Physical Review E 74 , 016110+ (2006) . [18] P . Ronho vde and Z. Nussinov, Physical Review E 81 , 046114 (2010) . [19] A. Lancichinetti and S. F ortunato, Physical Review E 80 , 056117 (2009) . [20] B. H. Go od, Y.-A. de Mon tjoy e, and A. Clauset, Physical Review E 81 , 046106 (2010) . [21] R. Aldecoa and I. Marín, Sci. Rep. 3 , 2216 (2013) . [22] V. A. T raag, G. Krings, and P . V an Do oren, Scientific Rep orts 3 , 2930 (2013) . [23] S. F ortunato and M. Barthélemy , Pro ceedings of the Na- tional A cademy of Sciences 104 , 36 (2007) . [24] J. M. Kumpula, J. Saramäki, K. Kaski, and J. Kertész, The European Physical Journal B 56 , 41 (2007) . [25] A. Lancichinetti and S. F ortunato, Physical Review E 84 , 066122 (2011) . [26] J. P . Bagro w, Physical Review E 85 , 066118 (2012) . [27] J. Xiang and K. Hu, Ph ysica A: Statistical Mec hanics and its Applications 391 , 4995 (2012) . [28] A. Kehagias, (2012) . [29] V. A. T raag, P . V an Do oren, and Y. Nesterov, Physi- cal Review E Phys. Rev. E, Stat. Nonlinear Soft Matter Ph ys. (USA), 84 , 016114 (2011) . [30] R. Aldecoa and I. Marín, PLoS ONE 6 , e24195 (2011) . [31] S. Kullback and R. A. Leibler, Ann. Math. Stat. 22 , 79 (1951) . [32] A. Decelle, F. Krzak ala, C. Mo ore, and Z. Lenk a, Phys- 11 ical Review Letters 107 , 065701 (2011) . [33] V. Arnau, S. Mars, and I. Marín, Bioinformatics 21 , 364 (2005) . [34] R. Aldecoa and I. Marín, Bioinformatics 30 , 1041 (2014) . [35] V. D. Blondel, J.-L. Guillaume, R. Lambiotte, and E. Lefeb vre, Journal of Statistical Mec hanics: Theory and Experiment P10008 (2008) . [36] M. A. Porter, J.-p. Onnela, and P . J. Mucha, Notices of the AMS 56 , 1082 (2009) . [37] M. Molloy and B. Reed, Random structures & algorithms 6 , 161 (1995) . [38] G. Krings and V. D. Blondel, (2011) . [39] V. A. T raag, Algorithms and Dynamic al Mo dels for Com- munities and R eputation in So cial Networks , Springer Theses (Springer, Heidelb erg, 2014). [40] M. T. Schaub, J.-C. Delvenne, S. N. Y aliraki, and M. Barahona, PloS one 7 , e32210 (2012) . [41] F. Radicchi, EPL (Europhysics Letters) 106 , 38001 (2014) . [42] R. R. Nadakuditi and M. E. J. Newman, Physical Review Letters 108 , 188701 (2012) . [43] F. Radicchi, Ph ysical Review E 88 , 010801 (2013) , arXiv:1306.1102 [cond-mat, physics:ph ysics]. [44] A. Lancic hinetti, S. F ortunato, and F. Radicchi, Ph ys. Rev. E - Stat. Nonlinear, Soft Matter Ph ys. 78 (2008). [45] B. Karrer and M. E. J. Newman, Ph ysical Review E 83 , 016107 (2011) . [46] P . J. Bick el and A. Chen, Pro ceedings of the National A cademy of Sciences 106 , 21068 (2009) . App endix A: Asymptotic surprise As stated in the main text, q denotes the fraction of in ternal edges, so that we can write m int = q m . Since m = p n 2 = pM , w e thus hav e m int = q pM . Similarly , w e can write M int = h q i M . Hence, w e obtain m = pM , (A1) m int = q pM , (A2) M int = h q i M . (A3) Notice that all quan tities now dep end on M . W e only tak e in to account the dominan t term, so to obtain S ( V ) ≈ − log h q i M pq M (1 − h q i ) M p (1 − q ) M M pM (A4) whic h corresp onds to the probability of observing exactly m int in ternal links. The binomial co efficien t M pM is inde- p enden t of the partition, so we ignore it. W e use Stirling’s appro ximation of the binomial co efficien t which reads n k ≈ n k k . (A5) Hence, for the dominant term, w e obtain S ( V ) = − log h q i M pq M pq M (1 − h q i ) M p (1 − q ) M p (1 − q ) M (A6) = − log p − pN h q i q q 1 − h q i 1 − q 1 − q ! pM . (A7) The term p − pM is indep enden t of the partition and we ignore it, whic h yields S ( V ) = − pM q log h q i q + (1 − q ) log 1 − h q i 1 − q . (A8) Using pM = m , we can rewrite this to S ( V ) = mD ( q k h q i ) (A9) where D ( x k y ) is the KL divergence [ 31 ] D ( x k y ) = x log x y + (1 − x ) log 1 − x 1 − y , (A10) whic h can b e interpreted as the distance b et ween the tw o probabilit y distributions q and h q i . App endix B: Significance W e can calculate the approximate difference of mov- ing an edge from one communit y to another. Assume w e mo ve an edge from communit y r to communit y s . The c hange in the densit y will be approximately p r − 1 n 2 r and p s + 1 n 2 s resp ectiv ely . The corresp onding difference in sig- nificance will b e appro ximately Z ( V 0 ) − Z ( V ) = n 2 s D ( p s + 1 n 2 s k p ) − D ( p s k p ) + n 2 r D ( p r − 1 n 2 r k p ) − D ( p r k p ) (B1) ≈ ∂ ∂ p s D ( p s k p ) − ∂ ∂ p r D ( p r k p ) (B2) = log p s 1 − p s 1 − p r p r = ∆ Z . (B3) This quan tit y is particularly straightforw ard (the loga- rithmic odds ratio), and if p r > p s the difference will b e negativ e, and if p r < p s this quantit y will b e p ositiv e. Mo ving edges from a denser comm unity to a less dense comm unity decreases the significance. In other w ords, making t wo densities more equal decreases the signifi- cance. Rep eating these steps, we should exp ect to find the low est significance when the communities are of equal densit y . 12 Alternativ ely , b y conv exity of the Kullback-Leibler di- v ergence, w e obtain for significance that Z ( V ) ≥ X c n c 2 ! D X c n c 2 P c n c 2 p c k p ! . (B4) Realizing that m c = p c n c 2 , we see that X c n c 2 P c n c 2 p c = m int M int = p q h q i . (B5) Notice that this can b e interpreted as an av erage internal densit y h p c i as stated in the main text. Using this w e arriv e at Z ( V ) ≥ M int D p q h q i k p . (B6) Hence, the significance of a partition with different com- m unity densities p c is generally larger than a partition where all communities ha ve the same av erage density p c = m int M int . Notice that p q h q i should b e b ounded by 1 so that q > h q i > p h q i in general. This p oin ts to a b ound such that Z ( V ) ≥ S ( V ) when h q i < p in the following w ay . Define λ = h q i p so that λ < 1 if h q i < p . Again applying con vexit y , we obtain Z ( V ) ≥ M int D ( pq h q i k p ) (B7) = M int λ λD ( pq h q i k p ) + (1 − λ ) D (0 k 0) (B8) ≥ M int λ D ( λ pq h q i k λp ) (B9) = m int D ( q k h q i ) = S ( V ) . (B10) If there are few er comm unities (i.e. if p > h q i ) the relationship is not entirely clear, but there are cases for whic h surprise may b e larger than significance. F or ex- ample, if w e assume an equi-sized equi-dense partition with r communities, then q = p c h q i p and h q i = 1 r , and the difference can b e written as S ( V ) − Z ( V ) = m (1 − q ) log 1 − q 1 − h q i − M int (1 − p c ) log 1 − p c 1 − p . (B11) Indeed if h q i > p then S ( V ) > Z ( V ) for equi-sized equi- dense partitions. Keep in mind though that an equi-sized equally dense partition will hav e a low er significance in general, so that this do es not hold for h q i > p in general.
Original Paper
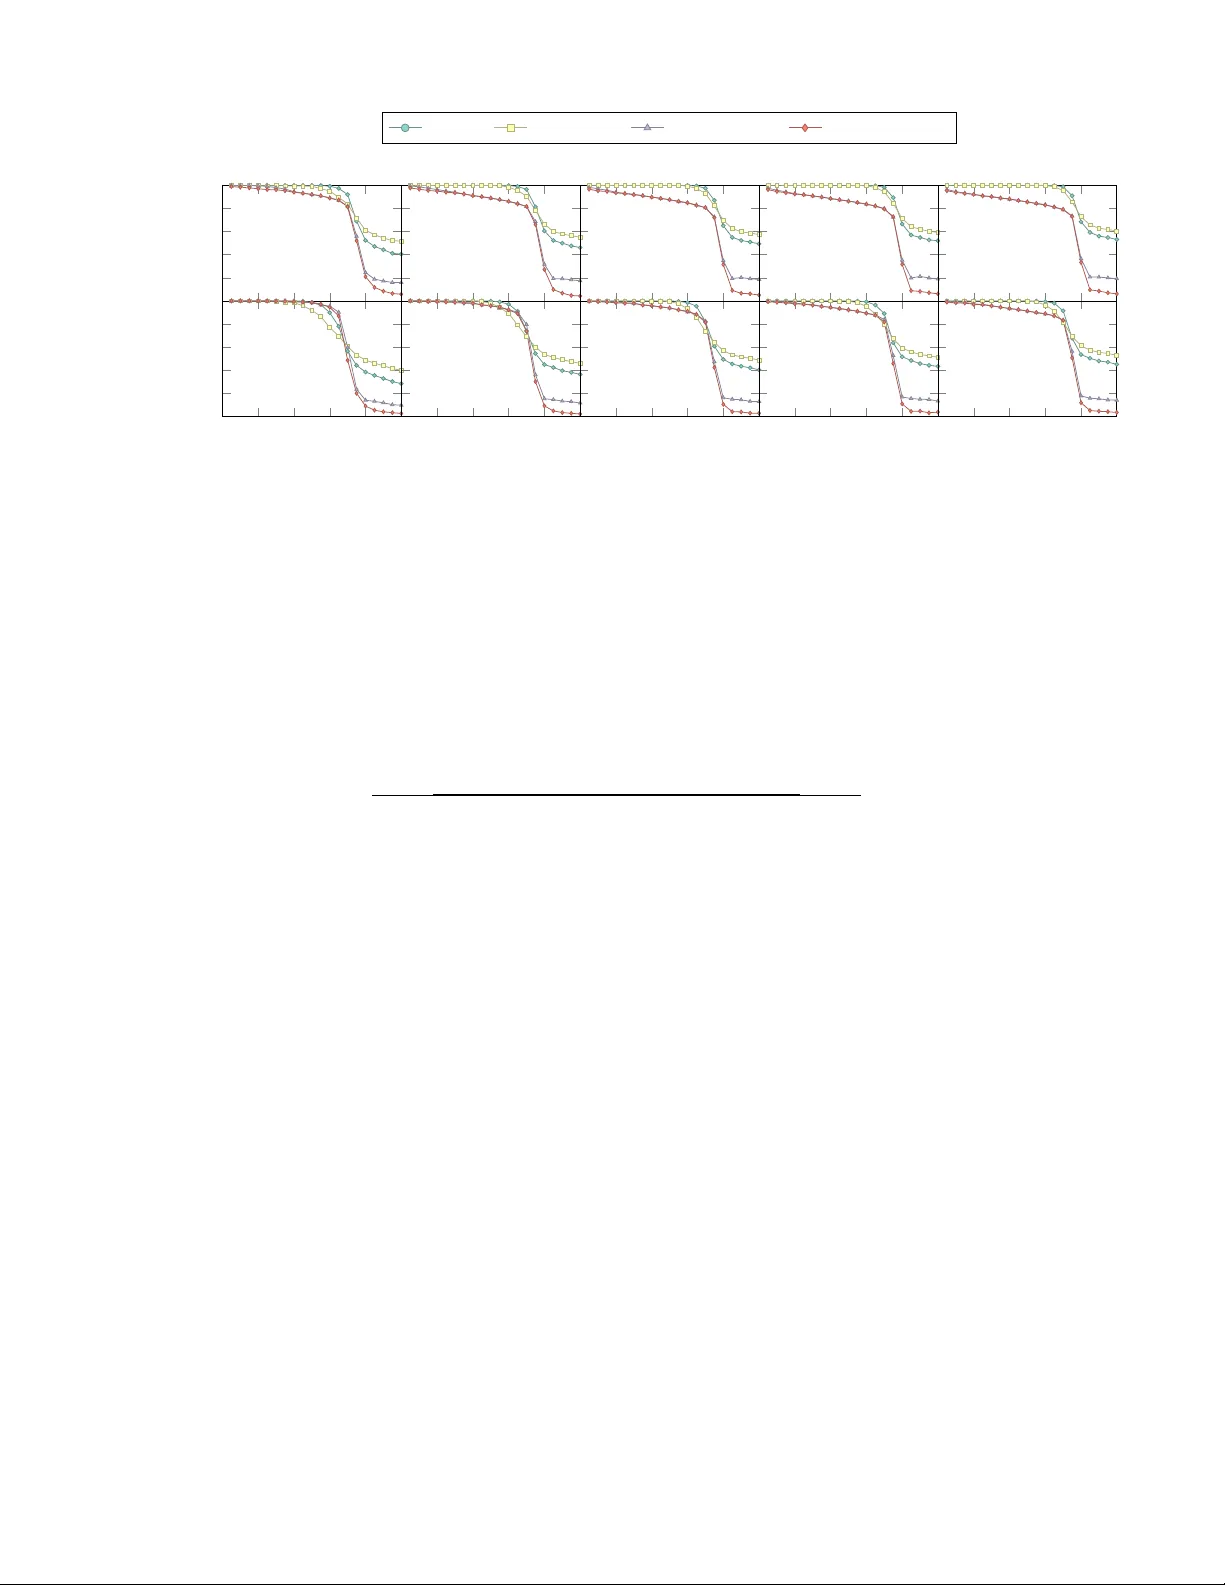
Loading high-quality paper...
Comments & Academic Discussion
Loading comments...
Leave a Comment