A review of heterogeneous data mining for brain disorders
With rapid advances in neuroimaging techniques, the research on brain disorder identification has become an emerging area in the data mining community. Brain disorder data poses many unique challenges for data mining research. For example, the raw da…
Authors: Bokai Cao, Xiangnan Kong, Philip S. Yu
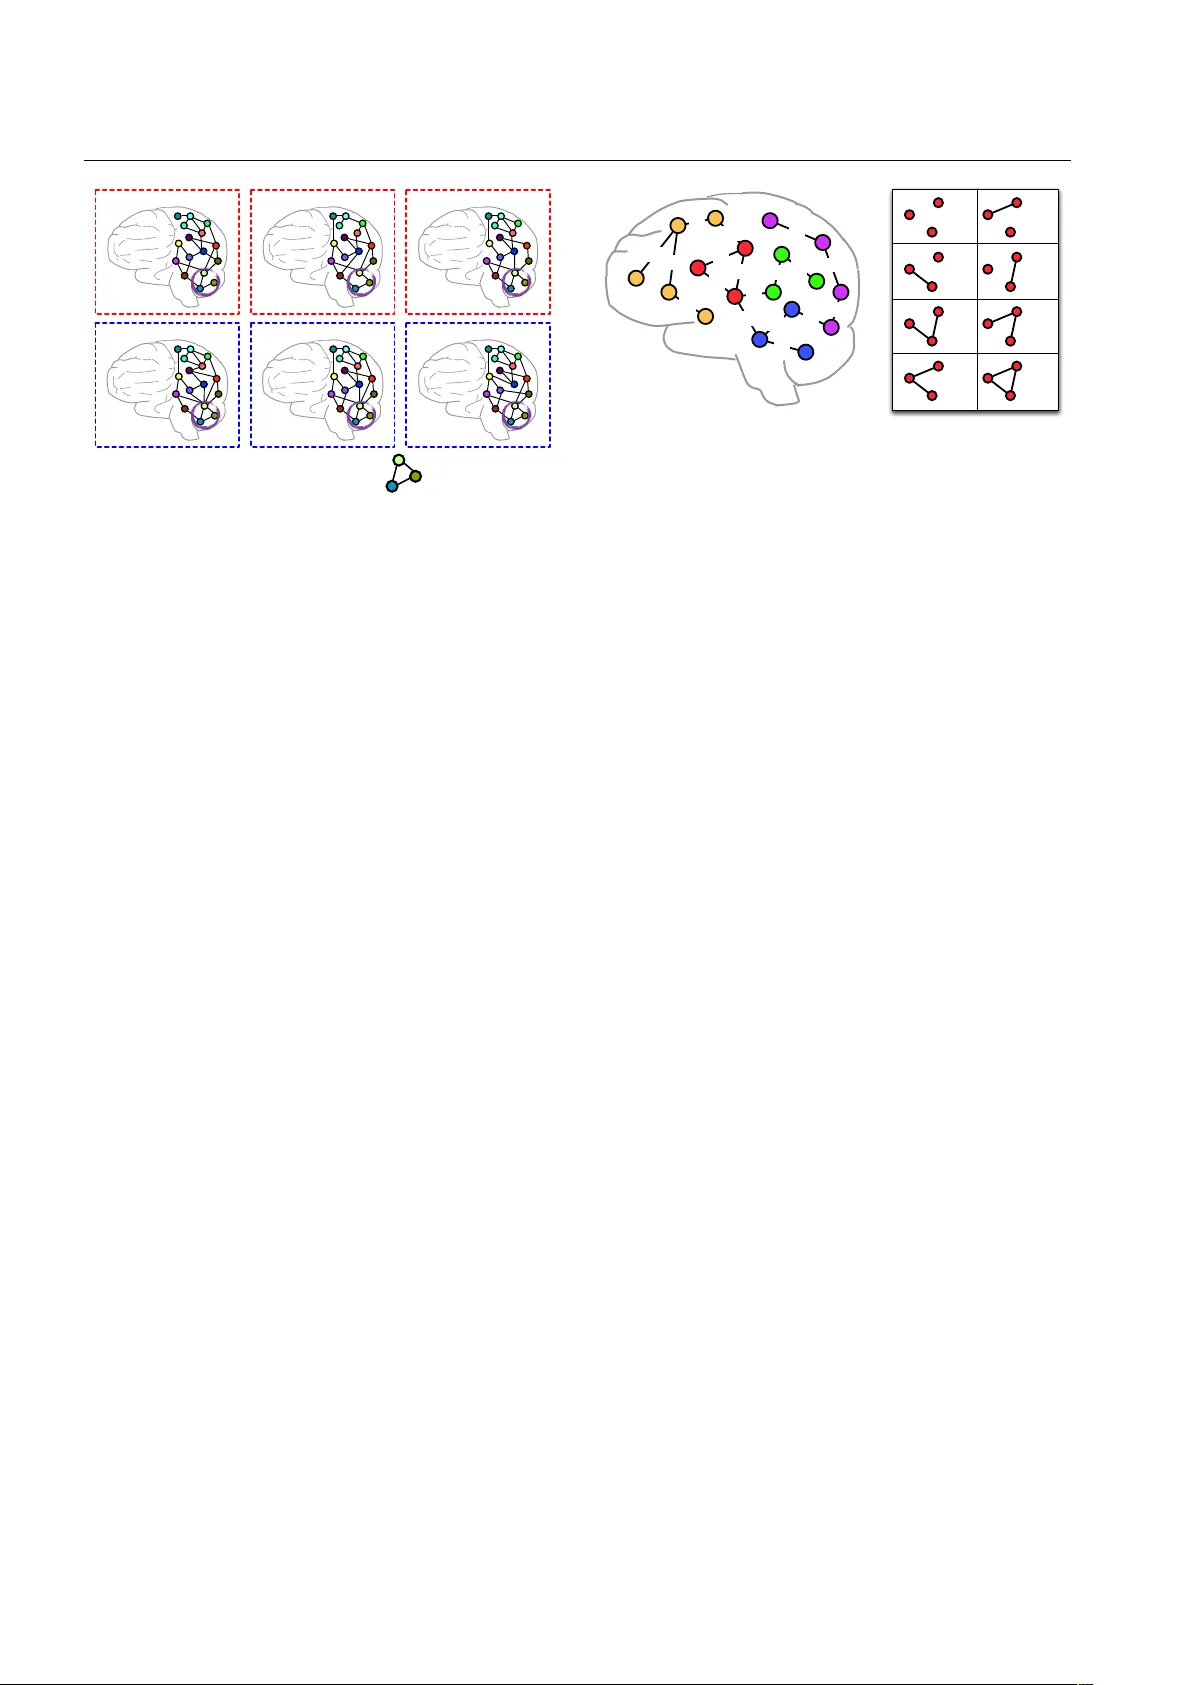
Noname man uscript No. (will b e inserted b y the editor) A review of heterogeneous data mining for brain disorders Bok ai Cao · Xiangnan Kong · Philip S. Y u Abstract With rapid adv ances in neuroimaging tech- niques, the researc h on brain disorder identification has b ecome an emerging area in the data mining comm u- nit y . Brain disorder data p oses many unique challenges for data mining researc h. F or example, the raw data generated b y neuroimaging exp eriments is in tensor rep- resen tations, with t ypical characteristics of high dimen- sionalit y , structural complexit y and nonlinear separa- bilit y . F urthermore, brain connectivity net w orks can b e constructed from the tensor data, embedding subtle in- teractions b etw een brain regions. Other clinical mea- sures are usually av ailable reflecting the disease status from differen t p ersp ectives. It is expected that in tegrat- ing complementary information in the tensor data and the brain net w ork data, and incorp orating other clinical parameters will b e p oten tially transformative for inv es- tigating disease mechanisms and for informing thera- p eutic interv en tions. Man y researc h efforts ha ve b een dev oted to this area. They hav e achiev ed great success in v arious applications, suc h as tensor-based mo deling, subgraph pattern mining, multi-view feature analysis. In this pap er, we review some recen t data mining meth- o ds that are used for analyzing brain disorders. Keyw ords Data mining · Brain diseases · T ensor analysis · Subgraph patterns · F eature selection B. Cao · P .S. Y u Department of Computer Science, Universit y of Illinois at Chicago, Chicago, IL 60607. E-mail: caobok ai@uic.edu, psyu@cs.uic.edu X. Kong Department of Computer Science, W orcester P olytec hnic In- stitute, W orcester, MA 01609. E-mail: xk ong@wpi.edu 1 Introduction Man y brain disorders are characterized by ongoing in- jury that is clinically silent for prolonged p erio ds and irrev ersible b y the time symptoms first present. New approac hes for detection of early changes in sub clin- ical p erio ds will afford p ow erful to ols for aiding clin- ical diagnosis, clarifying underlying mec hanisms and informing neuroprotective interv entions to slow or re- v erse neural injury for a broad sp ectrum of brain disor- ders, including bipolar disorder, HIV infection on brain, Alzheimer’s disease, P arkinson’s disease, etc. Early di- agnosis has the potential to greatly alleviate the burden of brain disorders and the ever increasing costs to fam- ilies and so ciet y . As the identification of brain disorders is extremely c hallenging, many differen t diagnosis to ols and methods ha ve b een developed to obtain a large n umber of mea- suremen ts from v arious examinations and lab oratory tests. Esp ecially , recent adv ances in the neuroimaging tec hnology hav e provided an efficient and noninv asive w ay for studying the structural and functional connec- tivit y of the h uman brain, either normal or in a diseased state [48]. This can b e attributed in part to adv ances in magnetic resonance imaging (MRI) capabilities [33]. T echniques such as diffusion MRI, also referred to as diffusion tensor imaging (DTI), pro duce in viv o images of the diffusion pro cess of water molecules in biological tissues. By leveraging the fact that the water molecule diffusion patterns reveal microscopic details about tis- sue arc hitecture, DTI can b e used to p erform tractog- raph y within the white matter and construct structural connectivit y netw orks [2, 36, 12, 38, 40]. F unctional MRI (fMRI) is a functional neuroimaging procedure that iden tifies lo calized patterns of brain activ ation b y de- tecting asso ciated c hanges in the cerebral blo o d flow. 2 B. Cao et al. The primary form of fMRI uses the blo o d oxygenation lev el dep enden t (BOLD) resp onse extracted from the gra y matter [3, 42, 43]. Another neuroimaging tec hnique is p ositron emission tomography (PET). Using differ- en t radioactive tracers ( e.g. , fluoro deoxyglucose), PET pro duces a three-dimensional image of v arious ph ysio- logical, bio c hemical and metab olic pro cesses [68]. A v ariet y of data representations can b e derived from these neuroimaging exp eriments, whic h present man y unique c hallenges for the data mining comm unity . Con ven tional data mining algorithms are usually dev el- op ed to tackle data in one sp ecific represen tation, a ma- jorit y of which are particularly for vector-based data. Ho wev er, the ra w neuroimaging data is in the form of tensors, from which w e can further construct brain net works connecting regions of interest (ROIs). Both of them are highly structured considering correlations b et ween adjacent v oxels in the tensor data and that b et ween connected brain regions in the brain netw ork data. Moreov er, it is critical to explore interactions b e- t ween measuremen ts computed from the neuroimaging and other clinical exp eriments which describ e sub jects in differen t vector spaces. In this pap er, w e review some recen t data mining methods for (1) mining tensor imag- ing data; (2) mining brain netw orks; (3) mining multi- view feature v ectors. 2 T ensor Imaging Analysis F or brain disorder iden tification, the raw data gener- ated by neuroimging exp eriments are in tensor repre- sen tations [15, 22, 68]. F or example, in contrast to tw o- dimensional X-ray images, an fMRI sample corresp onds to a four-dimensional array by recording the sequential c hanges of traceable signals in each vo xel 1 . T ensors are higher order arra ys that generalize the concepts of vectors (first-order tensors) and matrices (second-order tensors), whose elements are indexed by more than tw o indices. Each index expresses a mo de of v ariation of the data and corresp onds to a co ordinate direction. In an fMRI sample, the first three mo des usu- ally enco de the spatial information, while the fourth mo de enco des the temp oral information. The num b er of v ariables in each mode indicates the dimensionalit y of a mo de. The order of a tensor is determined by the n umber of its mo des. An m th-order tensor can b e rep- resen ted as X = ( x i 1 , ··· ,i m ) ∈ R I 1 ×···× I m , where I i is the dimension of X along the i -th mo de. Definition 1 (T ensor pro duct) The tensor pro duct of three vectors a ∈ R I 1 , b ∈ R I 2 and c ∈ R I 3 , denoted 1 A vo xel is the smallest three-dimensional p oint volume referenced in a neuroimaging of the brain. ≈ + ⋯ + + a 1 c 1 b 1 c 2 b 2 a 2 c R b R a R X Fig. 1 T ensor factorization of a third-order tensor. b y a ⊗ b ⊗ c , represents a third-order tensor with the elemen ts ( a ⊗ b ⊗ c ) i 1 ,i 2 ,i 3 = a i 1 b i 2 c i 3 . T ensor product is also referred to as outer product in some literature. An m th-order tensor is a rank-one tensor if it can b e defined as the tensor pro duct of m v ectors. Definition 2 (T ensor factorization) Giv en a third- order tensor X ∈ R I 1 × I 2 × I 3 and an in teger R , as illus- trated in Figure 1, a tensor factorization of X can be expressed as X = X 1 + X 2 + · · · + X R = R X r =1 a r ⊗ b r ⊗ c r (1) One of the ma jor difficulties brough t by the ten- sor data is the curse of dimensionality . The total num- b er of v o xels con tained in a m ulti-mo de tensor, sa y , X = ( x i 1 , ··· ,i m ) ∈ R I 1 ×···× I m is I 1 × · · · × I m whic h is exp onen tial to the num be r of mo des. If we unfold the tensor into a vector, the num b er of features will b e ex- tremely high [69]. This makes traditional data mining metho ds prone to ov erfitting, esp ecially with a small sample size. Both computational scalability and theo- retical guarantee of the traditional mo dels are compro- mised b y such high dimensionality [22]. On the other hand, complex structural information is embedded in the tensor data. F or example, in the neu- roimaging data, v alues of adjacent vo xels are usually correlated with each other [33]. Such spatial relation- ships among different v o xels in a tensor image can b e v ery important in neuroimaging applications. Conv en- tional tensor-based approac hes focus on reshaping the tensor data into matrices/vectors and thus the original spatial relationships are lost. The in tegration of struc- tural information is expected to impro v e the accuracy and in terpretability of tensor mo dels. 2.1 Classification Supp ose we hav e a set of tensor data D = { ( X i , y i ) } n i =1 for classification problem, where X i ∈ R I 1 ×···× I m is the neuroimaging data represented as an m th-order tensor and y i ∈ {− 1 , +1 } is the corresp onding binary class la- b el of X i . F or example, if the i -th sub ject has Alzheimer’s A review of heterogeneous data mining for brain disorders 3 disease, the sub ject is asso ciated with a p ositive lab el, i.e. , y i = +1. Otherwise, if the sub ject is in the control group, the sub ject is associated with a negative label, i.e. , y i = − 1. Sup ervised tensor learning can b e formulated as the optimization problem of support tensor machines (STMs) [55] which is a generalization of the standard supp ort v ector machines (SVMs) from v ector data to tensor data. The ob jectiv e of such learning algorithms is to learn a hyperplane by which the samples with different lab els are divided as wide as p ossible. Ho wev er, ten- sor data ma y not b e linearly separable in the input space. T o ac hieve a b etter p erformance on finding the most discriminativ e biomarkers or iden tifying infected sub j ects from the control group, in many neuroimaging applications, nonlinear transformation of the original tensor data should b e considered. He et al. study the problem of sup ervised tensor learning with nonlinear k ernels which can preserve the structure of tensor data [22]. The proposed k ernel is an extension of k ernels in the vector space to the tensor space which can take the m ultidimensional structure complexity into account. 2.2 Regression Sligh tly different from classifying disease status (dis- crete lab el), another family of problems use tensor neu- roimages to predict cognitive outcome (contin uous la- b el). The problems can b e formulated in a regression setup b y treating clinical outcome as the real label, i.e. , y i ∈ R , and treating tensor neuroimages as the input. Ho wev er, most classical regression metho ds take vec- tors as input features. Simply reshaping a tensor into a v ector is clearly an unsatisfactory solution. Zhou et al. exploit the tensor structure in imaging data and integrate tensor decomposition within a statis- tical regression paradigm to mo del multidimensional ar- ra ys [69]. By imp osing a low rank appro ximation to the extremely high dimensional complex imaging data, the curse of dimensionality is greatly alleviated, thereb y al- lo wing developmen t of a fast estimation algorithm and regularization. Numerical analysis demonstrates its p o- ten tial applications in identifying regions of in terest in brains that are relev ant to a particular clinical resp onse. 2.3 Net work Discov ery Mo dern im aging techniques hav e allow ed us to study the human brain as a complex system by mo deling it as a netw ork [1]. F or example, the fMRI scans consist of activ ations of thousands of vo xels ov er time embedding a complex interaction of signals and noise [19], which naturally presen ts the problem of eliciting the underly- ing net work from brain activities in the spatio-temporal tensor data. A brain connectivity net work, also called a connectome [52], consists of nodes (gra y matter regions) and edges (white matter tracts in structural netw orks or correlations b et ween t wo BOLD time series in func- tional net works). Although the anatomical atlases in the brain hav e b een extensively studied for decades, task/sub ject sp e- cific netw orks hav e still not b een completely explored with consideration of functional or structural connec- tivit y information. An anatomically parcellated region ma y con tain subregions that are c haracterized by dra- matically different functional or structural connectivit y patterns, thereb y significantly limiting the utilit y of the constructed net w orks. There are usually trade-offs b e- t ween reducing noise and preserving utility in brain par- cellation [33]. Thus inv estigating how to directly con- struct brain net w orks from tensor imaging data and understanding ho w they dev elop, deteriorate and v ary across individuals will b enefit disease diagnosis [15]. Da vidson et al. p ose the problem of netw ork discov- ery from fMRI data whic h in v olves simplifying spatio- temp oral data in to regions of the brain (no des) and re- lationships b etw een those regions (edges) [15]. Here the no des represent collections of v oxels that are known to b eha ve cohesively ov er time; the edges can indicate a n umber of prop erties b etw een no des such as facilita- tion/inhibition (increases/decreases activit y) or proba- bilistic (sync hronized activit y) relationships; the w eigh t asso ciated with each edge encodes the strength of the relationship. A tensor can b e decomp osed in to several factors. Ho wev er, unconstrained tensor decomp osition results of the fMRI data may not b e go o d for node disco very b ecause each factor is typically not a spatially contigu- ous region nor do es it necessarily match an anatomi- cal region. That is to say , man y spatially adjacent v ox- els in the same structure are not active in the same factor which is anatomically imp ossible. Therefore, to ac hieve the purp ose of disco vering nodes while preserv- ing anatomical adjacency , known anatomical regions in the brain are used as masks and constraints are added to enforce that the discov ered factors should closely matc h these masks [15]. Ov erall, current researc h on tensor imaging analysis presen ts tw o directions: (1) sup ervised: for a particular brain disorder, a classifier can be trained b y modeling the relationship b etw een a set of neuroimages and their asso ciated lab els (disease status or clinical resp onse); (2) unsup ervised: regardless of brain disorders, a brain net work can b e discov ered from a given neuroimage. 4 B. Cao et al. 3 Brain Netw ork Analysis W e hav e briefly introduced that brain net works can b e constructed from neuroimaging data where no des corre- sp ond to brain regions, e.g. , insula , hipp o c ampus , thala- mus , and links corresp ond to the functional/structural connectivit y betw een brain regions. The link age struc- ture in brain net works can encode tremendous informa- tion ab out the mental health of human sub jects. F or ex- ample, in brain netw orks derived from functional mag- netic resonance imaging (fMRI), functional connections can enco de the correlations b etw een the functional ac- tivities of brain regions. While structural links in diffu- sion tensor imaging (DTI) brain netw orks can capture the num b er of neural fib ers connecting different brain regions. The complex structures and the lac k of vector represen tations for the brain net work data raise ma jor c hallenges for data mining. Next, we will discuss different approaches on how to conduct further analysis for constructed brain net- w orks, which are also referred to as graphs hereafter. Definition 3 (Binary graph) A binary graph is rep- resen ted as G = ( V , E ), where V = { v 1 , · · · , v n v } is the set of vertices, E ⊆ V × V is the set of deterministic edges. 3.1 Kernel Learning on Graphs In the setting of sup ervised learning on graphs, the tar- get is to train a classifier using a given set of graph data D = { ( G i , y i ) } n i =1 , so that we can predict the lab el ˆ y for a test graph G . With applications to brain netw orks, it is desirable to iden tify the disease status for a sub- ject based on his/her uncov ered brain netw ork. Recent dev elopment of brain netw ork analysis has made c har- acterization of brain disorders at a whole-brain connec- tivit y level p ossible, thus providing a new direction for brain disease classification. Due to the complex structures and the lack of vector represen tations, graph data can not b e directly used as the input for most data mining algorithms. A straight- forw ard solution that has been extensively explored is to first derive features from brain netw orks and then construct a k ernel on the feature vectors. W ee et al. use brain connectivity net works for dis- ease diagnosis on mild cognitive impairment (MCI), whic h is an early phase of Alzheimer’s disease (AD) and usually regarded as a go o d target for early diag- nosis and therap eutic interv entions [61, 62, 63]. In the step of feature extraction, weigh ted lo cal clustering co- efficien ts of each R OI in relation to the remaining ROIs are extracted from all the constructed brain netw orks to quan tify the prev alence of clustered connectivity around the R OIs. T o select the most discriminative features for classification, statistical t-test is p erformed and features with p-v alues smaller than a predefined threshold are selected to construct a kernel matrix. Through the em- plo yment of the multi-k ernel SVM, W ee et al. integrate information from DTI and fMRI and achiev e accurate early detection of brain abnormalities [63]. Ho wev er, such strategy simply treats a graph as a collection of no des/links, and then extracts lo cal mea- sures ( e.g. , clustering co efficient) for each no de or per- forms statistical analysis on each link, thereby blind- ing the connectivity structures of brain net w orks. Mo- tiv ated by the fact that some data in real-w orld appli- cations are naturally represented b y means of graphs, while compressing and con vertin g them to vectorial rep- resen tations w ould definitely lose structural informa- tion, kernel methods for graphs hav e b een extensively studied for a decade [5]. A graph kernel maps the graph data from the orig- inal graph space to the feature space and further mea- sures the similarit y b etw een tw o graphs b y comparing their topological structures [49]. F or example, pro duct graph kernel is based on the idea of counting the num- b er of w alks in pro duct graphs [18]; marginalized graph k ernel works by comparing the lab el sequences gener- ated by synchronized random walks of lab eled graphs [30]; cyclic pattern k ernels for graphs count pairs of matc hing cyclic/tree patterns in tw o graphs [23]. T o identify individuals with AD/MCI from health y con trols, instead of using only a single property of brain net works, Jie et al. integrate multiple prop erties of fMRI brain netw orks to improv e the disease diagnosis p erfor- mance [27]. Tw o differen t y et complemen tary net w ork prop erties, i.e. , lo cal connectivit y and global top ologi- cal properties are quantified by computing tw o differen t t yp es of kernels, i.e. , a vector-based k ernel and a graph k ernel. As a lo cal netw ork prop erty , w eighted cluster- ing coefficients are extracted to compute a v ector-based k ernel. As a top ology-based graph kernel, W eisfeiler- Lehman subtree k ernel [49] is used to measure the topo- logical similarit y b etw een paired fMRI brain netw orks. It is shown that this t ype of graph kernel can effec- tiv ely capture the top ological information from fMRI brain net w orks. The m ulti-kernel SVM is employ ed to fuse these tw o heterogeneous kernels for distinguishing individuals with MCI from health y controls. 3.2 Subgraph P attern Mining In brain netw ork analysis, the ideal patterns w e wan t to mine from the data should tak e care of b oth lo cal and global graph topological information. Graph kernel A review of heterogeneous data mining for brain disorders 5 + Alzheimer's disease + Alzheimer's disease + Alzheimer's disease - Normal - Normal - Normal A discriminative subgraph pattern Fig. 2 An example of discriminative subgraph patterns in brain netw orks. metho ds seem promising, which how ever are not inter- pretable. Subgraph patterns are more suitable for brain net works, whic h can sim ultaneously mo del the netw ork connectivit y patterns around the no des and capture the c hanges in lo cal area [33]. Definition 4 (Subgraph) Let G 0 = ( V 0 , E 0 ) and G = ( V , E ) be t wo binary graphs. G 0 is a subgraph of G (denoted as G 0 ⊆ G ) iff V 0 ⊆ V and E 0 ⊆ E . If G 0 is a subgraph of G , then G is sup ergraph of G 0 . A subgraph pattern, in a brain netw ork, represents a collection of brain regions and their connections. F or ex- ample, as shown in Figure 2, three brain regions should w ork collab oratively for normal p eople and the absence of any connection b etw een them can result in Alzheimer’s disease in different degree. Therefore, it is v aluable to understand which connections collectively play a signifi- can t role in disease mechanism by finding discriminative subgraph patterns in brain net works. Mining subgraph patterns from graph data has b een extensiv ely studied b y many researchers [29, 13, 56, 66]. In general, a v ariet y of filtering criteria are prop osed. A typical ev aluation criterion is frequency , which aims at searc hing for frequen tly appearing subgraph features in a graph dataset satisfying a presp ecified threshold. Most of the frequent subgraph mining approaches are unsup ervised. F or example, Y an and Han develop a depth-first search algorithm: gSpan [67]. This algorithm builds a lexicographic order among graphs, and maps eac h graph to an unique minimum DFS co de as its canonical lab el. Based on this lexicographic order, gSpan adopts the depth-first search strategy to mine frequen t connected subgraphs efficien tly . Man y other approaches for frequent subgraph mining hav e also b een prop osed, e.g. , AGM [26], FSG [34], MoF a [4], FFSM [24], and Gaston [41]. 0.8 0.6 0.3 0.2 0.5 0.3 0.8 0.9 0.2 0.9 0.5 0.6 0.8 0.5 0.6 0.8 0.9 0.6 0.016 0.004 0.036 0.016 0.064 0.144 0.576 0.144 Fig. 3 An example of fMRI brain net works (left) and all p os- sible instantiations of link age structures b etw een red no des (righ t) [10]. Moreo ver, the problem of sup ervised subgraph min- ing has been studied in recen t work which examines ho w to improv e the efficiency of searc hing the discrim- inativ e subgraph patterns for graph classification. Y an et al. in tro duce tw o concepts structur al le ap se ar ch and fr e quency-desc ending mining , and prop ose LEAP [66] whic h is one of the first w ork in discriminativ e sub- graph mining. Thoma et al. prop ose CORK which can yield a near-optimal solution using greedy feature selec- tion [56]. Ranu and Singh prop ose a scalable approach, called GraphSig, that is capable of mining discrimi- nativ e subgraphs with a low frequency threshold [46]. Jin et al. prop ose COM which takes into account the co-o ccurences of subgraph patterns, thereby facilitat- ing the mining pro cess [28]. Jin et al. further prop ose an evolutionary computation metho d, called GAIA, to mine discriminativ e subgraph patterns using a random- ized searc hing strategy [29]. Zhu et al. design a div er- sified discrimination score based on the log ratio whic h can reduce the ov erlap b etw een selected features by con- sidering the em b edding ov erlaps in the graphs [70]. Con ven tional graph mining approaches are b est suited for binary edges, where the structure of graph ob jects is deterministic, and the binary edges represent the pres- ence of link ages b etw een the no des [33]. In fMRI brain net work data how ev er, there are inheren tly weigh ted edges in the graph link age structure, as shown in Fig- ure 3 (left). A straightforw ard solution is to threshold w eighted netw orks to yield binary net w orks. How ever, suc h simplification will result in great loss of informa- tion. Ideal data mining metho ds for brain net w ork anal- ysis should b e able to ov ercome these metho dological problems by generalizing the netw ork edges to p ositive and negative weigh ted cases, e.g. , probabilistic weigh ts in fMRI brain netw orks, in tegral w eigh ts in DTI brain net works. Definition 5 (W eigh ted graph) A weigh ted graph is represen ted as e G = ( V , E , p ), where V = { v 1 , · · · , v n v } 6 B. Cao et al. is the set of vertices, E ⊆ V × V is the set of nondeter- ministic edges. p : E → (0 , 1] is a function that assigns a probabilit y of existence to each edge in E . fMRI brain netw orks can b e mo deled as weigh ted graphs where eac h edge e ∈ E is associated with a probabilit y p ( e ) indicating the likelihoo d of whether this edge should exist or not [32, 10]. It is assumed that p ( e ) of differen t edges in a weigh ted graph are indep en- den t from eac h other. Therefore, by en umerating the p ossible existence of all edges in a weigh ted graph, we can obtain a set of binary graphs. F or example, in Fig. 3 (righ t), consider the three red no des and links b etw een them as a weigh ted graph. There are 2 3 = 8 binary graphs that can b e implied with different probabilities. F or a weigh ted graph e G , the probability of e G con tain- ing a subgraph feature G 0 is defined as the probabilit y that a binary graph G implied by e G contains subgraph G 0 . Kong et al. prop ose a discriminative subgraph fea- ture selection metho d based on dynamic programming to compute the probability distribution of the discrim- ination scores for each subgraph pattern within a set of w eighted graphs [32]. F or brain netw ork analysis, usually w e only hav e a small num b er of graph instances [32]. In these applica- tions, the graph view alone is not sufficien t for mining imp ortan t subgraphs. F ortunately , the side information is a v ailable along with the graph data for brain disor- der identification. F or example, in neurological studies, h undreds of clinical, immunologic, serologic and cogni- tiv e measures ma y b e a v ailable for eac h sub ject, apart from brain netw orks. These measures comp ose multi- ple side views which contain a tremendous amount of supplemen tal information for diagnostic purp oses. It is desirable to extract v aluable information from a plu- ralit y of side view s to guide the pro cess of subgraph mining in brain net works. Figure 4(a) illustrates the pro cess of selecting sub- graph patterns in conv en tional graph classification ap- proac hes. Obviously , the v aluable information em b ed- ded in side views is not fully lev eraged in feature se- lection pro cess. T o tackle this problem, Cao et al. in- tro duce an effective algorithm for discriminative sub- graph selection using m ultiple side views [9], as illus- trated in Figure 4(b). Side information consistency is first v alidated via statistical hypothesis testing whic h suggests that the similarity of side view features b e- t ween instances with the same lab el should ha ve higher probabilit y to b e larger than that with different lab els. Based on such observ ations, it is assumed that the sim- ilarit y/distance betw een instances in the space of sub- graph features should be consisten t with that in the space of a side view. That is to say , if t wo instances are similar in the space of a side view, they should also Subgraph Patterns Graph Classification Side Views Brain Networks Mine (a) T reating side views and subgraph patterns separately . Subgraph Patterns Graph Classification Side Views Brain Networks Guide Mine (b) Using side views as guidance for the pro cess of selecting subgraph patterns. Fig. 4 Two strategies of levera ging side views in feature se- lection pro cess for graph classification. b e close to each other in the space of subgraph fea- tures. Therefore the target is to minimize the distance b et ween subgraph features of each pair of similar in- stances in eac h side view [9]. In con trast to existing subgraph mining approaches that fo cus on the graph view alone, the proposed method can explore m ultiple v ector-based side views to find an optimal set of sub- graph features for graph classification. F or graph classification, brain netw ork analysis ap- proac hes can generally b e put into three groups: (1) extracting some lo cal measures ( e.g. , clustering co effi- cien t) to train a standard vector-based classifier; (2) di- rectly adopting graph k ernels for classification; (3) find- ing discriminativ e subgraph patterns. Differen t types of metho ds mo del the connectivit y em b edded in brain net- w orks in different wa ys. 4 Multi-view F eature Analysis Medical science witnesses everyda y measurements from a series of medical examinations do cumented for eac h sub ject, including clinical, imaging, immunologic, sero- logic and cognitive measures [7], as sho wn in Figure 5. Eac h group of measures characterize the health state of a sub ject from different asp ects. This type of data is named as multi-view data , and each group of measures form a distinct view quan tifying sub jects in one specific feature space. Therefore, it is critical to combine them to improv e the learning p erformance, while simply con- catenating features from all views and transforming a m ulti-view data into a single-view data, as the metho d ( a ) shown in Figure 6, w ould fail to leverage the under- lying correlations b et ween different views. A review of heterogeneous data mining for brain disorders 7 H I V / s er o n eg a t i v e V i e w 1 V i ew 3 V i e w 2 V i e w 6 V i ew 4 V i ew 5 I m m u n o l o g i c m e a s u r e s C l i n i c a l m e a s u r e s Se r o l o gi c m e a s u r e s M R I s e q u e n c e B M R I s e q u e n c e A C o gn i t i ve m e a s u r e s Fig. 5 An example of multi-view learning in medical studies [6]. 4.1 Multi-view Learning Supp ose we hav e a multi-view classification task with n lab eled instances represented from m different views: D = n x (1) i , x (2) i , · · · , x ( m ) i , y i o n i =1 , where x ( v ) i ∈ R I v , I v is the dimensionality of the v -th view, and y i ∈ {− 1 , +1 } is the class lab el of the i -th instance. Represen tative methods for multi-view learning can b e categorized in to three groups: co-training, mu ltiple k ernel learning, and subspace learning [65]. Generally , the co-training style algorithm is a classic approac h for semi-sup ervised learning, which trains in alterna- tion to maximize the mutual agreemen t on different views. Multiple kernel learning algorithms com bine k er- nels that naturally corresp ond to different views, either linearly [35] or nonlinearly [58, 14] to improv e learn- ing p erformance. Subspace learning algorithms learn a laten t subspace, from whic h multiple views are gener- ated. Multiple kernel learning and subspace learning are generalized as co-regularization st yle algorithms [53], where the disagreement betw een the functions of differ- en t views is taken as a part of the ob jectiv e function to b e minimized. Overall, b y exploring the consistency and complemen tary prop erties of different views, multi-view learning is more effectiv e than single-view learning. In the m ulti-view setting for brain disorders, or for medical studies in general, a critical problem is that there may b e limited sub jects av ailable ( i.e. , a small n ) y et in tro ducing a large n umber of measurements ( i.e. , a large P m i =1 I i ). Within the multi-view data, not all features in different views are relev an t to the learning task, and some irrelev an t features may introduce un- exp ected noise. The irrelev ant information can even b e exaggerated after view combinations thereby degrad- ing p erformance. Therefore, it is necessary to take care of feature selection in the learning pro cess. F eature se- lection results can also b e used by researchers to find biomark ers for brain diseases. Such biomarkers are clin- ically imperative for detecting injury to the brain in the earliest stage b efore it is irrev ersible. V alid biomark ers can be used to aid diagnosis, monitor disease progres- sion and ev aluate effects of interv ention [32]. Con ven tional feature selection approaches can b e di- vided into three main directions: filter, wrapp er, and em b edded metho ds [20]. Filter metho ds compute a dis- crimination score of eac h feature indep enden tly of the other features based on the correlation b etw een the feature and the lab el, e.g. , information gain, Gini in- dex, Relief [44, 47]. W rapp er metho ds measure the use- fulness of feature subsets according to their predictiv e p o wer, optimizing the subsequent induction pro cedure that uses the resp ective subset for classification [21, 45, 50, 37, 6]. Embedded metho ds p erform feature selection in the pro cess of mo del training based on sparsity reg- ularization [17, 16, 59, 60]. F or example, Miranda et al. add a regularization term that p enalizes the size of the selected feature subset to the standard cost function of SVM, thereby optimizing the new ob jective function to conduct feature selection [39]. Essentially , the pro cess of feature selection and learning algorithm interact in em b edded metho ds which means the learning part and the feature selection part can not b e separated, while wrapp er methods utilize the learning algorithm as a blac k b ox. Ho wev er, directly applying these feature selection approac hes to eac h separate view would fail to lever- age multi-view correlations. By taking in to account the laten t in teractions among views and the redundancy triggered b y multiple views, it is desirable to com bine m ulti-view data in a principled manner and p erform feature selection to obtain consensus and discrimina- tiv e low dimensional feature representations. 4.2 Mo deling View Correlations Recen t y ears hav e witnessed man y research efforts de- v oted to the integration of feature selection and multi - view learning. T ang et al. study m ulti-view feature se- lection in the unsupervised setting by constraining that similar data instances from each view should hav e sim- ilar pseudo-class lab els [54]. Considering brain disorder iden tification, differen t neuroimaging features ma y cap- ture different but complementary characteristics of the 8 B. Cao et al. data. F or example, the v oxel-based tensor features con- v ey the global information, while the R OI-based Auto- mated Anatomical Lab eling (AAL) [57] features sum- marize the lo cal information from multiple represen- tativ e brain regions. Incorporating these data and ad- ditional non-imaging data sources can p otentially im- pro ve the prediction. F or Alzheimer’s disease (AD) clas- sification, Y e et al. prop ose a k ernel-based metho d for in tegrating heterogeneous data, including tensor and AAL features from MRI images, demographic informa- tion and genetic information [68]. The k ernel framew ork is further extended for selecting features (biomarkers) from heterogeneous data sources that play more signif- ican t roles than others in AD diagnosis. Huang et al. prop ose a sparse comp osite linear dis- criminan t analysis mo del for identification of disease- related brain regions of AD from multiple data sources [25]. Tw o sets of parameters are learned: one represen ts the common information shared by all the data sources ab out a feature, and the other represents the sp ecific information only captured by a particular data source ab out the feature. Exp eriments are conducted on the PET and MRI data whic h measure structural and func- tional asp ects, resp ectively , of the same AD pathology . Ho wev er, the proposed approac h requires the input as the same set of v ariables from multiple data sources. Xiang et al. inv estigate multi-source incomplete data for AD and introduce a unified feature learning model to handle blo c k-wise missing data whic h ac hieves simul- taneous feature-lev el and source-level selection [64]. F or mo deling view correlations, in general, a co effi- cien t is assigned for eac h view, either at the view-level or feature-lev el. F or example, in multiple kernel learn- ing, a k ernel is constructed from each view and a set of k ernel co efficients are learned to obtain an optimal com- bined kernel matrix. These approaches, ho w ev er, fail to explicitly consider correlations b et ween features. 4.3 Mo deling F eature Correlations One of the k ey issues for multi-view classification is to c ho ose an appropriate to ol to mo del features and their correlations hidden in m ultiple views, since this directly determines how information will b e used. In contrast to mo deling on views, another direction for mo deling m ulti-view data is to directly consider the correlations b et ween features from multiple views. Since taking the tensor pro duct of their resp ectiv e feature spaces cor- resp onds to the interaction of features from multiple views, the concept of tensor serves as a backbone for incorp orating multi-view features into a consensus rep- resen tation b y means of tensor product, where the com- plex multiple relationships among views are embedded V i e w 3 V i e w 2 V i e w 1 Mod e l i n g Fe a t u r e s elect i o n Met h o d ( a ) Me t h od ( b ) Me t h od ( c ) Fig. 6 Sc hematic view of the key differences among three strategies of multi-view feature selection [ 6]. within the tensor structures. By mining structural in- formation con tained in the tensor, knowledge of m ulti- view features can b e extracted and used to establish a predictiv e mo del. Smalter et al. formulate the problem of feature selec- tion in the tensor product space as an in teger quadratic programming problem [51]. How ev er, this metho d is computationally intractable on man y views, since it di- rectly selects features in the tensor pro duct space re- sulting in the curse of dimensionalit y , as the method ( b ) sho wn in Figure 6. Cao et al. prop ose to use a tensor- based approac h to mo del features and their correlations hidden in the original multi-view data [6]. The opera- tion of tensor pro duct can b e used to bring m -view feature vectors of eac h instance together, leading to a tensorial representation for common structure across m ultiple views, and allowing us to adequately diffuse re- lationships and enco de information among multi-view features. In this manner, the multi-view classification task is essen tially transformed from an independent do- main of each view to a consensus domain as a tensor classification problem. By using X i to denote Q m v =1 ⊗ x ( v ) i , the dataset of lab eled multi-view instances can be represen ted as D = { ( X i , y i ) } n i =1 . Note that each m ulti-view instance X i is an m th-order tensor that lies in the tensor pro duct space R I 1 ×···× I m . Based on the definitions of inner pro d- uct and tensor norm, multi-view classification can b e form ulated as a global conv ex optimization problem in the framew ork of supervised tensor learning [55]. This mo del is named as multi-view SVM [6], and it can be solv ed with the use of optimization tec hniques devel- op ed for SVM. F urthermore, a dual metho d for multi-view feature selection is prop osed in [6] that leverages the relation- ship b et w een original m ulti-view features and recon- structed tensor pro duct features to facilitate the im- A review of heterogeneous data mining for brain disorders 9 plemen tation of feature selection, as the method ( c ) in Figure 6. It is a wrapp er mo del whic h selects useful features in conjunction with the classifier and simulta- neously exploits the correlations among m ultiple views. F ollowing the idea of SVM-based recursiv e feature elim- ination [21], m ulti-view feature selection is consistently form ulated and implemented in the framework of multi- view SVM . This idea can extend to include low er order feature interactions and to employ a v ariet y of loss func- tions for classification or regression [11]. 5 F uture W ork The human brain is one of the most complicated bi- ological structures in the known universe. While it is v ery challenging to understand how it works, especially when disorders and diseases o ccur, dozens of leading tec hnology firms, academic institutions, scien tists, and other key contributors to the field of neuroscience hav e dev oted themselves to this area and made significan t impro vemen ts in v arious dimensions 2 . Data mining on brain disorder identification has b ecome an emerging area and a promising researc h direction. This pap er provides an ov erview of data mining ap- proac hes with applications to brain disorder identifica- tion which hav e attracted increasing attention in both data mining and neuroscience comm unities in recent y ears. A taxonomy is built based up on data represen- tations, i.e. , tensor imaging data, brain netw ork data and multi-view data, follo w ing which the relationships b et ween different data mining algorithms and different neuroimaging applications are summarized. W e briefly presen t some p otential topics of interest in the future. Bridging heterogeneous data representations. As introduced in this pap er, we can usually derive data from neuroimaging exp eriments in three representations, including raw tensor imaging data, brain net work data and multi-view v ector-based data. It is critical to study ho w to train a model on a mixture of data representa- tions, although it is very c hallenging to combine data that are represen ted in tensor space, v ector space and graph space, resp ectively . There is a straightforw ard idea of defining different k ernels on different feature spaces and com bing them through multi-k ernel algo- rithms. Ho w ev er it is usually hard to interpret the re- sults. The concept of side view has been introduced to facilitate the pro cess of mining brain netw orks, which ma y also b e used to guide sup ervised tensor learning. It is even more interesting if we can learn on tensors and graphs sim ultaneously . 2 h ttp://www.whitehouse.gov/BRAIN Fig. 7 A bioinformatics heterogeneous information net work schema. In tegrating m ultiple neuroimaging mo dalities. There are a v ariety of neuroimaging techniques a v ail- able characterizing sub jects from different p ersp ectives and providing complementary information. F or exam- ple, DTI contains local microstructural characteristics of water diffusion; structural MRI can b e used to delin- eate brain atrophy; fMRI records BOLD resp onse re- lated to neural activity; PET measures metab olic pat- terns [63]. Based on suc h m ultimo dalit y representation, it is desirable to find useful patterns with rich seman- tics. F or example, it is imp ortan t to know which connec- tivit y b etw een brain regions is significant in the sense of b oth structure and functionality . On the other hand, b y leveraging the complementary information embed- ded in the multimodality representation, b etter p erfor- mance on disease diagnosis can b e exp ected. Mining bioinformatics information netw orks. Bioinformatics netw ork is a ric h source of heterogeneous information inv olving disease mec hanisms, as shown in Figure 7. The problems of gene-disease asso ciation and drug-target binding prediction ha ve b een studied in the setting of heterogeneous information netw orks [8, 31]. F or example, in gene-disease asso ciation prediction, dif- feren t gene sequences can lead to certain diseases. Re- searc hers would like to predict the asso ciation relation- ships b etw een genes and diseases. Understanding the correlations b etw een brain disorders and other diseases and the causality b et ween certain genes and brain dis- eases can b e transformativ e for yielding new insights concerning risk and protective relationships, for clar- ifying disease mec hanisms, for aiding diagnostics and clinical monitoring, for biomarker discov ery , for iden- tification of new treatment targets and for ev aluating effects of in terven tion. 10 B. Cao et al. References 1. O. Ajilore, L. Zhan, J. GadElk arim, A. Zhang, J. D. F eusner, S. Y ang, P . M. Thompson, A. Kumar, and A. Leow. Constructing the resting state structural con- nectome. F r ontiers in neur oinformatics , 7, 2013. 2. P . J. Basser and C. Pierpaoli. Microstructural and ph ys- iological features of tissues elucidated by quantitativ e- diffusion-tensor MRI. Journal of Magnetic R esonanc e, Se- ries B , 111(3):209–219, 1996. 3. B. Biswal, F. Zerrin Y etkin, V. M. Haughton, and J. S. Hyde. F unctional connectivity in the motor cortex of resting human brain using echo-planar MRI. Magnetic r esonance in me dicine , 34(4):537–541, 1995. 4. C. Borgelt and M. R. Berthold. Mining molecular frag- ments: Finding relev ant substructures of molecules. In ICDM , pages 51–58. IEEE, 2002. 5. F. Camastra and A. Petrosino. Kernel methods for graphs: A comprehensiv e approach. In Know le dge-Based Intel ligent Information and Engine ering Systems , pages 662–669. Springer, 2008. 6. B. Cao, L. He, X. Kong, P . S. Y u, Z. Hao, and A. B. Ragin. T ensor-based multi-view feature selection with applications to brain diseases. In ICDM , pages 40–49. IEEE, 2014. 7. B. Cao, X. Kong, C. Kettering, P . S. Y u, and A. B. Ragin. Determinants of HIV-induced brain c hanges in three dif- feren t p erio ds of the early clinical course: A data mining analysis. Neur oImage: Clinic al , 2015. 8. B. Cao, X. Kong, and P . S. Y u. Collective prediction of multiple t yp es of links in heterogeneous information netw orks. In ICDM , pages 50–59. IEEE, 2014. 9. B. Cao, X. Kong, J. Zhang, P . S. Y u, and A. B. Ragin. Mining brain netw orks using multiple side views for neu- rological disorder identification. 10. B. Cao, L. Zhan, X. Kong, P . S. Y u, N. Vizueta, L. L. Altshuler, and A. D. Leow. Identification of discrimina- tive subgraph patterns in fMRI brain netw orks in bip o- lar affective disorder. In Brain Informatics and He alth . Springer, 2015. 11. B. Cao, H. Zhou, and P . S. Y u. Multi-view machines. arXiv , 2015. 12. T. L. Chenevert, J. A. Brun b erg, and J. Pipe. Anisotropic diffusion in h uman white matter: demonstration with mr techniques in vivo. R adiolo gy , 177(2):401–405, 1990. 13. H. Cheng, D. Lo, Y. Zhou, X. W ang, and X. Y an. Identi- fying bug signatures using discriminative graph mining. In ISST A , pages 141–152. ACM, 2009. 14. C. Cortes, M. Mohri, and A. Rostamizadeh. Learning non-linear combinations of kernels. In NIPS , pages 396– 404, 2009. 15. I. Davidson, S. Gilpin, O. Carmichael, and P . W alker. Netw ork discov ery via constrained tensor analysis of fMRI data. In KDD , pages 194–202. ACM, 2013. 16. Z. F ang and Z. M. Zhang. Discriminative feature selection for multi-view cross-domain learning. In CIKM , pages 1321–1330. ACM, 2013. 17. Y. F eng, J. Xiao, Y. Zhuang, and X. Liu. Adaptiv e un- sup ervised m ulti-view feature selection for visual concept recognition. In ACCV , pages 343–357, 2012. 18. T. G¨ artner, P . Flach, and S. W rob el. On graph kernels: Hardness results and efficient alternatives. In L e arning The ory and Kernel Machines , pages 129–143. Springer, 2003. 19. C. R. Geno vese, N. A. Lazar, and T. Nic hols. Threshold- ing of statistical maps in functional neuroimaging using the false disco v ery rate. Neur oimage , 15(4):870–878, 2002. 20. I. Guy on and A. Elisseeff. An in tro duction to v ariable and feature selection. The Journal of Machine L earning R esear ch , 3:1157–1182, 2003. 21. I. Guyon, J. W eston, S. Barnhill, and V. V apnik. Gene se- lection for cancer classification using supp ort vector ma- c hines. Machine le arning , 46(1-3):389–422, 2002. 22. L. He, X. Kong, P . S. Y u, A. B. Ragin, Z. Hao, and X. Y ang. DuSK: A dual structure-preserving kernel for supervised tensor learning with applications to neuroim- ages. In SDM . SIAM, 2014. 23. T. Horv´ ath, T. G¨ artner, and S. W rob el. Cyclic pattern k ernels for predictive graph mining. In KDD , pages 158– 167. ACM, 2004. 24. J. Huan, W. W ang, and J. Prins. Efficient mining of frequen t subgraphs in the presence of isomorphism. In ICDM , pages 549–552. IEEE, 2003. 25. S. Huang, J. Li, J. Y e, T. W u, K. Chen, A. Fleisher, and E. Reiman. Identifying Alzheimer’s disease-related brain regions from m ulti-modality neuroimaging data us- ing sparse comp osite linear discrimination analysis. In NIPS , pages 1431–1439, 2011. 26. A. Inokuchi, T. W ashio, and H. Moto da. An apriori- based algorithm for mining frequen t substructures from graph data. In Principles of Data Mining and Know le dge Disc overy , pages 13–23. Springer, 2000. 27. B. Jie, D. Zhang, W. Gao, Q. W ang, C. W ee, and D. Shen. In tegration of netw ork top ological and connectivity prop- erties for neuroimaging classification. Biome dic al Engi- ne ering , 61(2):576, 2014. 28. N. Jin, C. Y oung, and W. W ang. Graph classification based on pattern co-o ccurrence. In CIKM , pages 573– 582. ACM, 2009. 29. N. Jin, C. Y oung, and W. W ang. GAIA: graph classifica- tion using evolutionary computation. In SIGMOD , pages 879–890. ACM, 2010. 30. H. Kashima, K. Tsuda, and A. Inokuchi. Marginalized k ernels b etw een lab eled graphs. In ICML , volume 3, pages 321–328, 2003. 31. X. Kong, B. Cao, and P . S. Y u. Multi-label classification b y mining lab el and instance correlations from hetero- geneous information netw orks. In KDD , pages 614–622. A CM, 2013. 32. X. Kong, A. B. Ragin, X. W ang, and P . S. Y u. Discrimi- nativ e feature selection for uncertain graph classification. In SDM , pages 82–93. SIAM, 2013. 33. X. Kong and P . S. Y u. Brain netw ork analysis: a data mining p ersp ective. ACM SIGKDD Explor ations Newslet- ter , 15(2):30–38, 2014. 34. M. Kuramo chi and G. Karypis. F requent subgraph dis- co very . In ICDM , pages 313–320. IEEE, 2001. 35. G. R. Lanckriet, N. Cristianini, P . Bartlett, L. E. Ghaoui, and M. I. Jordan. Learning the kernel matrix with semidefinite programming. The Journal of Machine L earn- ing R esear ch , 5:27–72, 2004. 36. D. Le Bihan, E. Breton, D. Lallemand, P . Grenier, E. Ca- banis, and M. La v al-Jeantet. Mr imaging of intra vo xel in- coheren t motions: application to diffusion and p erfusion in neurologic disorders. R adiolo gy , 161(2):401–407, 1986. 37. S. Maldonado and R. W eb er. A wrapp er method for fea- ture selection using support v ector machines. Information Scienc es , 179(13):2208–2217, 2009. 38. M. J. McKeown, S. Makeig, G. G. Brown, T.-P . Jung, S. S. Kindermann, A. J. Bell, and T. J. Sejno wski. Anal- ysis of fMRI data b y blind separation into indep endent spatial comp onents. Human Br ain Mapping , 6:160–188, 1998. A review of heterogeneous data mining for brain disorders 11 39. J. Miranda, R. Monto ya, and R. W eb er. Linear p enal- ization supp ort vector machines for feature selection. In Pattern R e c o gnition and Machine Intel ligenc e , pages 188– 192. Springer, 2005. 40. M. E. Moseley , Y. Cohen, J. Kucharczyk, J. Min torovitc h, H. Asgari, M. W endland, J. Tsuruda, and D. Norman. Diffusion-weigh ted mr imaging of anisotropic w ater diffu- sion in cat cen tral nerv ous system. R adiolo gy , 176(2):439– 445, 1990. 41. S. Nijssen and J. N. Kok. A quickstart in frequent struc- ture mining can make a difference. In KDD , pages 647– 652. ACM, 2004. 42. S. Ogaw a, T. Lee, A. Kay , and D. T ank. Brain magnetic resonance imaging with con trast dependent on bloo d oxy- genation. Pr o c e e dings of the National Ac ademy of Sciences , 87(24):9868–9872, 1990. 43. S. Ogaw a, T.-M. Lee, A. S. Nay ak, and P . Glynn. Oxygenation-sensitiv e contrast in magnetic resonance image of ro den t brain at high magnetic fields. Magnetic r esonance in me dicine , 14(1):68–78, 1990. 44. H. Peng, F. Long, and C. Ding. F eature selection based on mutual information criteria of max-dep endency , max- relev ance, and min-redundancy . Pattern A nalysis and Ma- chine Intel ligenc e , 27(8):1226–1238, 2005. 45. A. Rakotomamonjy . V ariable selection using SVM- based criteria. The Journal of Machine L e arning R ese ar ch , 3:1357–1370, 2003. 46. S. Ranu and A. K. Singh. Graphsig: A scalable approach to mining significant subgraphs in large graph databases. In ICDE , pages 844–855. IEEE, 2009. 47. M. Robnik- ˇ Siko nja and I. Kononenk o. Theoretical and empirical analysis of relieff and rrelieff. Machine le arning , 53(1-2):23–69, 2003. 48. M. Rubinov and O. Sp orns. Complex netw ork measures of brain connectivit y: uses and interpretations. Neur oim- age , 52(3):1059–1069, 2010. 49. N. Sherv ashidze, P . Sch weitzer, E. J. V an Leeu wen, K. Mehlhorn, and K. M. Borgw ardt. W eisfeiler-lehman graph kernels. The Journal of Machine Le arning R esear ch , 12:2539–2561, 2011. 50. M.-D. Shieh and C.-C. Y ang. Multiclass SVM-RFE for product form feature selection. Exp ert Systems with Ap- plic ations , 35(1):531–541, 2008. 51. A. Smalter, J. Huan, and G. Lushington. F eature selec- tion in the tensor pro duct feature space. In ICDM , pages 1004–1009, 2009. 52. O. Sp orns, G. T ononi, and R. K¨ otter. The human connec- tome: a structural description of the human brain. PLoS c omputational biology , 1(4):e42, 2005. 53. S. Sun. A survey of multi-view mac hine learning. Neur al Computing and Applic ations , 23(7-8):2031–2038, 2013. 54. J. T ang, X. Hu, H. Gao, and H. Liu. Unsupervised feature selection for multi-view data in social media. In SDM , pages 270–278. SIAM, 2013. 55. D. T ao, X. Li, X. W u, W. Hu, and S. J. Ma ybank. Sup er- vised tensor learning. Know le dge and Information Systems , 13(1):1–42, 2007. 56. M. Thoma, H. Cheng, A. Gretton, J. Han, H.-P . Kriegel, A. J. Smola, L. Song, S. Y. Philip, X. Y an, and K. M. Borgw ardt. Near-optimal sup ervised feature selection among frequent subgraphs. In SDM , pages 1076–1087. SIAM, 2009. 57. N. Tzourio-Mazoy er, B. Landeau, D. Papa thanassiou, F. Crivello, O. Etard, N. Delcroix, B. Mazoy er, and M. Joliot. Automated anatomical labeling of activ a- tions in SPM using a macroscopic anatomical parcella- tion of the MNI MRI single-sub ject brain. Neuroimage , 15(1):273–289, 2002. 58. M. V arma and B. R. Babu. More generality in efficient multiple kernel learning. In ICML , pages 1065–1072, 2009. 59. H. W ang, F. Nie, and H. Huang. Multi-view clustering and feature learning via structured sparsity . In ICML , pages 352–360, 2013. 60. H. W ang, F. Nie, H. Huang, and C. Ding. Heterogeneous visual features fusion via sparse multimodal machine. In CVPR , pages 3097–3102, 2013. 61. C.-Y. W ee, P .-T. Y ap, K. Denny , J. N. Bro wndyke, G. G. Potter, K. A. W elsh-Bohmer, L. W ang, and D. Shen. Resting-state multi-spectrum functional con- nectivity net works for iden tification of mci patients. PloS one , 7(5):e37828, 2012. 62. C.-Y. W ee, P .-T. Y ap, W. Li, K. Denn y , J. N. Bro wndyke, G. G. Potter, K. A. W elsh-Bohmer, L. W ang, and D. Shen. Enric hed white matter connectivity net w orks for accurate iden tification of mci patien ts. Neur oimage , 54(3):1812–1822, 2011. 63. C.-Y. W ee, P .-T. Y ap, D. Zhang, K. Denny , J. N. Bro wndyke, G. G. P otter, K. A. W elsh-Bohmer, L. W ang, and D. Shen. Identification of mci individuals using struc- tural and functional connectivity netw orks. Neur oimage , 59(3):2045–2056, 2012. 64. S. Xiang, L. Y uan, W. F an, Y. W ang, P . M. Thompson, and J. Y e. Multi-source learning with block-wise missing data for Alzheimer’s disease prediction. In KDD , pages 185–193. ACM, 2013. 65. C. Xu, D. T ao, and C. Xu. A survey on multi-view learn- ing. arXiv , 2013. 66. X. Y an, H. Cheng, J. Han, and P . S. Y u. Mining signif- icant graph patterns by leap search. In SIGMOD , pages 433–444. ACM, 2008. 67. X. Y an and J. Han. gspan: Graph-based substructure pattern mining. In ICDM , pages 721–724. IEEE, 2002. 68. J. Y e, K. Chen, T. W u, J. Li, Z. Zhao, R. Patel, M. Bae, R. Janardan, H. Liu, G. Alexander, et al. Heterogeneous data fusion for Alzheimer’s disease study . In KDD , pages 1025–1033. ACM, 2008. 69. H. Zhou, L. Li, and H. Zhu. T ensor regression with ap- plications in neuroimaging data analysis. Journal of the Americ an Statistical Asso ciation , 108(502):540–552, 2013. 70. Y. Zhu, J. X. Y u, H. Cheng, and L. Qin. Graph classi- fication: a diversified discriminativ e feature selection ap- proac h. In CIKM , pages 205–214. ACM, 2012.
Original Paper
Loading high-quality paper...
Comments & Academic Discussion
Loading comments...
Leave a Comment