Partial Transfer Entropy on Rank Vectors
For the evaluation of information flow in bivariate time series, information measures have been employed, such as the transfer entropy (TE), the symbolic transfer entropy (STE), defined similarly to TE but on the ranks of the components of the recons…
Authors: Dimitris Kugiumtzis
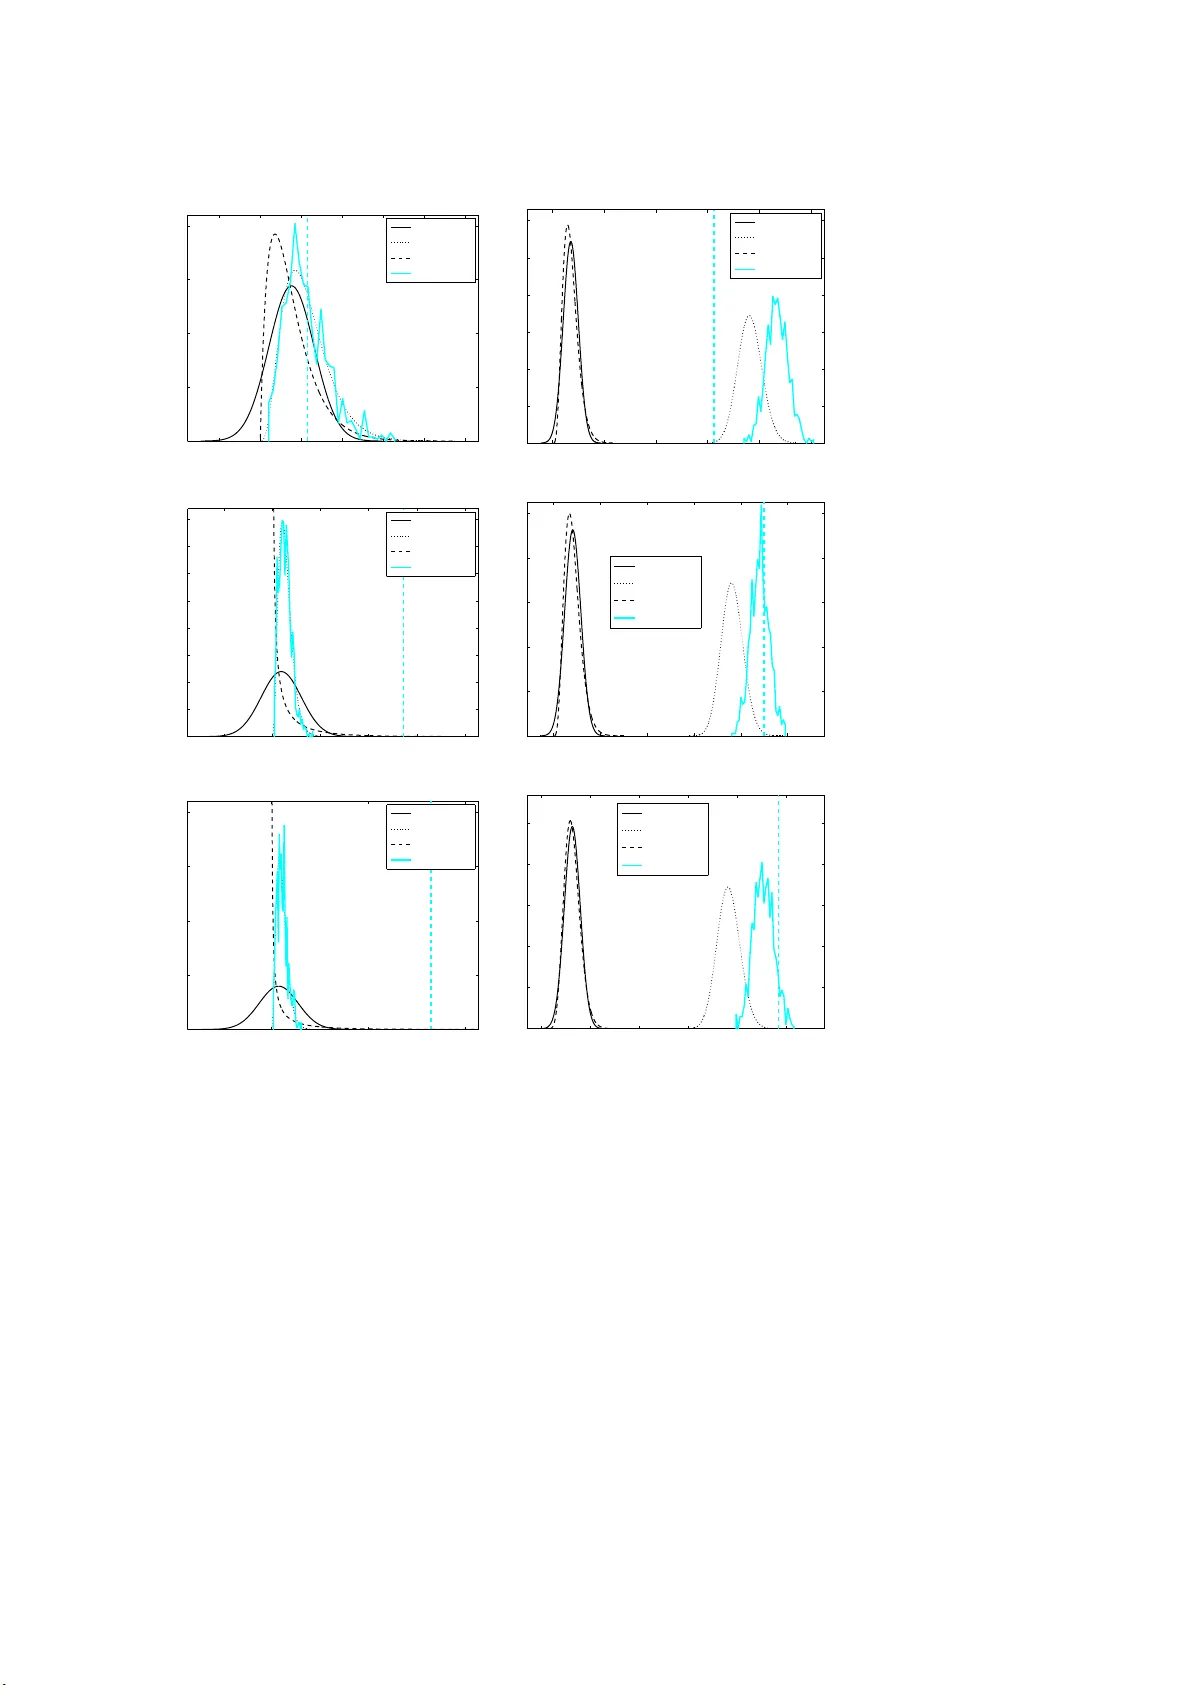
EPJ man uscript No. (will be inserted b y the editor) P a rtial T ransfer Entrop y on Rank V ecto rs Dimitris Kugiumtzis a Department of Mathematical, Physica l and Computational Sciences, F aculty of Engineering, Aristotle Universit y of Thessaloniki, Thessaloniki 54124, Greece Abstract. F or the eva luation of in formation fl o w in biva riate time se- ries, information measures have been emp lo yed, such as the transfer entrop y (TE), t h e sy m b olic transfer entrop y (STE), defi ned similarly to TE but on the ranks of the comp onents of the reco nstructed vectors , and the t ransfer entrop y on rank vectors (TER V), similar to STE but forming the rank s for the futu re samples of the resp onse system with regard t o t h e current reconstructed vector. Here we extend TER V for multiv ariate time series , and acc ount for the presence of confounding v ariables, called partial transfer entrop y on ranks (PTER V). W e in- vestig ate the asymptotic properties of PTER V, and also partial STE (PSTE), construct parametric significance t ests u nder app ro ximations with Gaussian and gamma null distributions, and show that the para- metric tests cannot achieve the p ow er of the rand omization test u sing time-shifted surrogates. Using si mulations on known coupled dyn am- ical systems and applying parametric and randomization significance tests, we sho w that PTER V p erforms b etter th an PSTE but wor se than the p artial transfer entropy (PTE). H o wev er, PTER V, unlike PTE, is robust to the p resence of d rifts in the time series and it is also n ot affected by th e lev el of detrending. 1 Intro duction A fundamental concept when s tudying coupled s ystems, a nd dynamical systems in general, is the depe ndence of one v ar iable X measured ov er time on another v a riable Y measured synchronously , where bo th X and Y ma y be considered as v ar iables of one single system or r epresentativ e v ariables of coupled subsystems. The b est k nown concept of in terdep endence in time s eries is Gra nger causalit y , defined in terms of pre- dictability of linear sto chastic systems [14], i.e. X Gr anger causes Y if it impr ov es the prediction of Y when included in the autoregres s ive mo del. Grang er causalit y has b een quantified with measures based on linear models in the time and frequency doma in [12,5,11]. Bes ide s the direct e xtension of Granger caus ality to nonlinear pr ediction mo dels [40], the idea of Gr anger causality has b e e n formulated focusing on sp ecific system dynamics pro per ties, ranging from p oint distance interdependence [4 ,10] to phase synchronization [37,46]. Here, we consider the form ulation o f Granger causa lit y in terms of information flow from X to Y , which encompa s ses linear and nonlinear dynamic s y stems as well as sto chastic pro cesses (for a very rec e n t controv ers ial stand on Gr anger c a usality see [45]). a e-mail: dkugiu@g en.auth.gr 2 Will b e inserted by t h e editor The most prominent quantification of informa tion flow fro m X to Y is by the conditional m utual information (CMI), expressing the amount of info rmation o f the future state of Y expla ined by the current state of X accounting for the curr ent state of Y . This was first pro po sed by Schreiber [41] under the name transfer entropy (TE ) using standard dela y em b edding of the current states, and w as further modified for non-uniform em b edding [5 0 ,39]. CMI and subsequently m utual information (MI) a nd ent ropy b e ar differ en t ex pr essions for discrete and c o nt inuous v ariables, the for mer being simpler to estimate. Conv ersion from con tinu ous to discrete v aria bles b y bin- ning techniques is not recommended when the v aria bles are high-dimensional bec a use the estimation o f infor mation mea s ures b ear s the same problems of estimating high dimensional density with a binning metho d [43]. A differ e nt and mor e efficien t dis- cretization can be obtained b y using the rank or der o f the delay co mpo nen ts of the high-dimensional v a r iables obtained b y delay embedding, an idea first formulated fo r the en tropy , called p ermutation en tr opy [7 ,52]. Similar approaches have be e n devel- op ed for TE, s uch as the symbo lic transfer ent ropy (STE) [44], which was further corrected to the s o -called transfer entropy on ra nk vectors (TER V) [24], and the momentary information transfer [35] (see also [6] for a combination of per m utation ent ropy and the directiona l synchronization index). A first contribution of this w o rk is to extend TER V to be able to quan tify the direct information flow fr o m X to Y in the presence o f other interacting v aria bles ca lled confounding v aria bles, stacked in the v a riable Z , ter med par tial TER V (PTE R V). The extensio n is str aightforw ard and is the same as for TE, the partial TE (PTE) [48,32], and fo r STE , the partial STE (PSTE) [33]. F or discrete v ariables and pro cess es, the equiv alence of entrop y , in the for m o f Kolmogo rov-Sinai entropy , and p ermutation entrop y has b een established theor e ti- cally under different conditions [2,18,21,1]. A recen t study car ries the equiv a lence to TE a nd TER V (a s w ell a s STE) but at the asympto tic rate [17]. These res ults pav e the wa y to take asymptotic prop erties of estimates of en tro p y and MI o f discrete v ariables ov er to the estimates of entrop y and MI of ranked versions of con tinuous v ar iables, the la tter b eing the p oints obtained from time series b y dela y em b edding. A second contribution of this w ork is to deriv e estimates for the bias and v ariance of rank-based coupling measures (TER V, STE as well a s PTER V and P STE), form parametric tests of sig nificance of TE R V and STE and co mpare them with ra ndo mization tests using time-shifted surrog ates, a common approa ch for nonlinear coupling measure s [36]. Comparative studies hav e fo und that TE , and subsequently PTE, p erform con- sistently w ell, [26,28,30]. Therefo re w e compar e PTER V to PSTE using pa rametric and randomization significance tests and also to PTE using the ra ndomization test on simulated known coupled chaotic systems. W e consider also the presence of sto chastic trends in the time series, a situation met often in many applications. The structure of the paper is as follows. In Sectio n 2, w e pres en t first the measures of information flow for biv aria te and multiv ar iate time s eries a nd then the par tial transfer entrop y on rank v ectors (PTER V). W e pre s ent the as ymptotic sta tistical prop erties of P TER V and the para metric and rando mization significance tests for PTER V in Section 3. Then in Sec tion 4, the significa nc e tests for PTER V and PSTE are compa red on simulated systems and the tw o measur es are further co mpared to PTE as well. Discussion o f the res utls and concluding remarks are g iven in Sectio n 5. 2 T ransfer Entropy and Rank Vecto rs W e briefly present first the information measures for biv ar iate time s e r ies { x t , y t } N t =1 , i.e. transfer ent ropy (TE), sym b olic transfer entrop y (STE) and transfer en tropy o n Will b e inserted by t h e editor 3 rank vectors (TER V). Assuming standar d delay embedding with the same embed- ding dimensio n m a nd delay τ , a fav orable choice for inv estigating coupling [31 ], the reconstructed points from the tw o time series are x t = [ x t , x t − τ , . . . , x t − ( m − 1) τ ] and y t = [ y t , y t − τ , . . . , y t − ( m − 1) τ ], resp ectively . W e define the measures for the informa- tion flow, o r Grang e r causa lity , fro m X to Y , denoted X → Y , ass uming the driving system being represented b y X and the resp onse system b y Y . The future state of the resp onse is defined in terms of T times ahead denoted y T t = [ y t +1 , . . . , y t + T ], where often the future horizon is limited to T = 1 ( y T t = y t +1 ). 2.1 T ra nsfer Entrop y T rans fer entropy (TE) is the conditional mutual infor mation I ( y T t ; x t | y t ) and qua n- tifies the information about the future of the resp onse system, y T t , obtained b y the current state of the driving system, x t , that is not already con tained in the current state o f the resp onse sy stem, y t . In ter ms of entropy , TE is defined as TE X → Y = I ( y T t ; x t | y t ) = − H ( y T t , x t , y t ) + H ( x t , y t ) + H ( y T t , y t ) − H ( y t ) , (1) where H ( x ) = R X f ( x ) ln f ( x )d x is the differential entropy o f a contin uous v aria ble x with doma in X , a nd f ( x ) is the pro bability densit y function of x . In estimating TE X → Y one can assume discr etization of the obse rved v a riables x t and y t and use the Shannon entropy H ( x ) = P p ( x ) ln p ( x ) for the dis crete v aria ble x , whe r e the sum is over the p ossible bins of x and p ( x ) is the probability mass function (pmf ) of x . How ever, binning methods are found to b e more dema nding on data siz e than other metho ds a pproximating directly the densit y function, and subsequently the differential entropy . In particular, for high dimensions, i.e. lar g e m , the k -near est neighbor estima te turns out to be the most robust to time series length [23,50], and we apply this in the c omparative study in Section 4. The inefficiency of the binning metho ds for es timating en tro pies is attributed to the bias due to the es timation of bin probability with the relative frequency o f o ccur - rence of entries in the bin, a nd the v ariance due to having a num b er o f unpo pulated or po or ly p opulated bins. The latter increases with the embedding dimensio n m , and it is noted that for the discre tization of x t and y t in b bins the v a riable of highes t dimension [ y T t , x t , y t ] in eq.(1 ) regards b 2 m + T bins. 2.2 S y mb olic T ran sfer En t ropy A differe nt disc retization that pro duces far less bins for the high dimensiona l v ariables is provided by the rank order ing of the c ompo nent s of vector v ariables . F or each po in t y t , the ranks of its co mpo nen ts, say in asce nding orde r , form a ra nk vector ˆ y t = [ r t, 1 , r t, 2 , . . . , r t,m ], wher e r t,j ∈ { 1 , 2 , . . . , m } for j = 1 , . . . , m , is the rank o r der of the comp onent y t − ( j − 1) τ . F or tw o equal comp onents of y t the sma lle st rank is assigned to the comp onent app ear ing first in y t . Substituting r ank vectors to sample vectors in the expressio n for Shannon e ntropy gives the so - called p ermutation en tropy H ( ˆ x ) = P p ( ˆ x ) ln p ( ˆ x ), where the sum is ov er m ! p os s ible p er mutations of the m comp onents of ˆ x [7]. The same conv ersion has b een sugge s ted fo r TE. In [44], the arg uments in the CMI of TE X → Y in eq.(1) are mo dified as follows: x t and y t are substituted by the resp ective rank v ectors ˆ x t and ˆ y t , and the future resp onse v e c to r y T t is replaced by the resp onse rank vector at time t + T , ˆ y t + T . This conv er sion of TE is called symbolic transfer entrop y (STE) defined as STE X → Y = I ( ˆ y t + T ; ˆ x t | ˆ y t ) = − H ( ˆ y t + T , ˆ x t , ˆ y t ) + H ( ˆ x t , ˆ y t ) + H ( ˆ y t + T , ˆ y t ) − H ( ˆ y t ) . (2) 4 Will b e inserted by t h e editor 2.3 T ra nsfer Entrop y on Rank V ect o rs STE is not the direct a nalogue to TE in terms of ra nks. While the corr e spo ndence of y t to ˆ y t (and the same for x t and ˆ x t ) is direct and preserves the v ector dimension, the vector y T t = [ y t +1 , . . . , y t + T ] of dimensio n T is mapp ed to ˆ y t + T = [ r t + T , 1 , . . . , r t + T ,m ] of dimension m , the rank vector o f y t + T = [ y t + T , . . . , y t + T − ( m − 1) τ ]. This indire c t corres p ondence has implications in the computation of the entrop y terms and thus the CMI. In par ticula r, supp osing τ = 1 , the joint vector [ y t + T , y t ] present in tw o ent ropy terms of eq.(1) has m + T consecutive comp onents, and the p ossible rank orders of the corre s po nding rank vector are ( m + T )!. Using the approa ch in STE, [ y t + T , y t ] is mapp ed to [ ˆ y t + T , ˆ y t ] having m ! · m ! ( m − T )! po ssible ra nk o rders (for details see [24]). In [24], a correc tio n o f STE termed transfer entrop y on rank v ectors (TER V) is prop osed. TER V ass ig ns for the future respo nse sample vector y T t = [ y t +1 , . . . , y t + T ] in TE the future resp ons e rank v ector ˆ y T t = [ r t,m +1 , . . . , r t,m + T ] containing the ranks of [ y t +1 , . . . , y t + T ] in the augmented vector [ y t , y T t ]. TE R V is th us defined as TER V X → Y = I ( ˆ y T t ; ˆ x t | ˆ y t ) = − H ( ˆ y T t , ˆ x t , ˆ y t ) + H ( ˆ x t , ˆ y t ) + H ( ˆ y T t , ˆ y t ) − H ( ˆ y t ) . (3) W e note that there is o ne-to-one mapping be tween the ranks of y t and the ranks of the firs t m comp onents of the augment ed vector [ y t , y T t ] 1 . Th us the pmf for the first m compo nent s of the rank vector of [ y t , y T t ] is the same a s the pmf for the ranks of y t , defined on m ! p ossible rank vectors. F or the rest T compo nent s of the rank v ector of [ y t , y T t ], there are Q T i =1 ( m + i ) p ossible combinations, giv ing a total nu mber of ( m + T )! combinations fo r the ra nk vector of [ y t , y T t ]. This is larger than the num b er of combinations STE a s signs for [ y t , y T t ], ( m + T )! > m ! · m ! ( m − T )! , and th us the ent ropy terms H ( y T t , x t , y t ) and H ( y T t , y t ) for the contin uous v ariable s in eq.(1) for TE a re corr ectly estima ted by TER V but underes timated by STE , having H ( ˆ y t + T , ˆ x t , ˆ y t ) < H ( ˆ y T t , ˆ x t , ˆ y t ) and H ( ˆ y t + T , ˆ y t ) < H ( ˆ y T t , ˆ y t ) [24]. 2.4 Pa rtial T ransf er Ent rop y on Rank V ectors (PTERV) Now we suppos e we ha ve K mult iv ar iate time series, denoted { x t , y t , z 1 ,t , . . . , z K − 2 , t } N t =1 , in o rder to preserve the no tation for the relation of in terest X → Y in the presence of K − 2 other obser ved v a riables Z 1 , . . . , Z K − 2 . F or direct Granger ca usality or di- rect information flow fro m X to Y , one has to a c c ount for the confounding v ariables Z = { Z 1 , . . . , Z K − 2 } . The dela y e mbedding for ea ch Z i , i = 1 , . . . , K − 2 , gives z i,t = [ z i,t , z i,t − τ , . . . , z i,t − ( m − 1) τ ], and for conv enience we stack a ll the reconstr ucted po in ts z i,t to one z t = [ z 1 ,t , . . . , z K − 2 , t ] of dimension ( K − 2) m . TE ha s b een extended to include the effect of the curr ent state o f Z on the future of the resp onse Y and the current state of X , simply b y a dding it to the co nditioning term of CMI. The so-calle d partial tr ansfer ent ropy (PTE) is defined as [48,32] PTE X → Y | Z = I ( y T t ; x t | y t , z t ) = − H ( y T t , x t , y t , z t ) + H ( x t , y t , z t ) + H ( y T t , y t , z t ) − H ( y t , z t ) . (4) The same formulation can be co nsidered for STE and the par tial symbolic transfer ent ropy (PSTE) is defined as [33] PSTE X → Y | Z = I ( ˆ y t + T ; ˆ x t | ˆ y t , ˆ z t ) = − H ( ˆ y t + T , ˆ x t , ˆ y t , ˆ z t ) + H ( ˆ x t , ˆ y t , ˆ z t ) + H ( ˆ y t + T , ˆ y t , ˆ z t ) − H ( ˆ y t , ˆ z t ) . (5) 1 F or b oth th ere is a b ijection to the same rank sequ ence as d efined in [2,17]. Will b e inserted by t h e editor 5 Here we extend als o TER V to the par tial transfer entropy o n rank vectors (PTE R V) defined analogo usly as PTER V X → Y | Z = I ( ˆ y T t ; ˆ x t | ˆ y t , ˆ z t ) = − H ( ˆ y T t , ˆ x t , ˆ y t , ˆ z t ) + H ( ˆ x t , ˆ y t , ˆ z t ) + H ( ˆ y T t , ˆ y t , ˆ z t ) − H ( ˆ y t , ˆ z t ) . (6) The dimensio n of the v aria bles in the ent ropy terms for all expres sions (PTE , PSTE and PTER V) incr ease with the nu mber of v a riables K and the em b edding dimension m . F or PSTE and PTER V the possible rank per m utations of z t = [ z 1 ,t , . . . , z K − 2 , t ] are ( m !) K − 2 , which s hows that the demand for data size increas es sha rply with b oth K a nd m . 3 Statistical Significance of PTERV A ma in disadv antage of nonlinea r mea s ures of Grang e r ca usality as oppo sed to linear causality measures is the lack of established asymptotic prop erties . How ever, deal- ing with discretized v a riables, as for TER V a nd PTER V (and resp ectively STE a nd PSTE), it is p ossible to do so, ba sed on the estimation of Shannon ent ropy . There ha ve bee n a num b er o f works on estimates of Shannon entrop y and their sta tis tica l prop er- ties, and subsequently for m utual informatio n [27,16,34,38,3,1 5,29,42,13,19,9,25,49]. 3.1 Bia s a nd va r iance in the estimation of entropy Here we follow the approximation for the bias and v a riance of Shannon entrop y in [27] and [38], and further e x tend it including higher order terms of the T aylor series expansion. Let us supp ose that for the discrete v aria ble X there are B states. F or our setting X can b e, say , x t , and then B = m !. Let the true proba bility fo r each state i = 1 , . . . , B , be p i , the observed frequency o f state i b e n i , and the estimated pro babilit y of state i b e q i = n i / N , wher e N is the data s iz e. The relative erro r in the es tima tion of the pro bability o f state i is ǫ i = ( q i − p i ) /p i . The following a pproach is based o n the assumption that n i is a binomial random v aria ble , n i ∼ B ( N , p i ). The o bs erved Sha nnon entrop y is H obs = − B X i =1 q i ln q i = − B X i =1 p i (1 + ǫ i ) ln( p i (1 + ǫ i )) = − B X i =1 p i ln p i − B X i =1 ( p i ǫ i ln p i + p i (1 + ǫ i ) ln(1 + ǫ i )) , where the first ter m in the last expression is the true entropy H ∞ . Using the T aylor expansion up to third or de r of ln(1 + ǫ i ), a nd taking exp ecta tio n we arrive at the expression for the bias B( H obs ) = h H obs i − H ∞ = − B X i =1 p i 2 h ǫ 2 i i − p i 6 h ǫ 3 i i . (7) Making use of the first three momen ts of the binomial distribution, w e have h ǫ 2 i i = (1 − p i ) / ( N p i ) and h ǫ 3 i i = (1 − 3 p i + 2 p 2 i ) / ( N 2 p 2 i ), and s ubstituting them in eq.(7 ) we 6 Will b e inserted by t h e editor get B( H obs ) = − B ∗ − 1 2 N − 3 B ∗ − 2 6 N 2 + 1 6 N B ∗ X i =1 1 n i , (8) where B ∗ is the num b er of sta tes with p ositive observed frequency . The first term in the rhs o f eq.(8) is the expressio n added to H obs to give the bias-c orrected en tr opy estimate of Miller-Ma dow [27], which we expand here to thir d order T aylor a pproxi- mation. The infor ma tion from the observed v ariable e n ters in the bias approximation of Miller- Madow only in terms of the num b er of observed sta tes B ∗ , but in eq.(8) also the obser ved frequencies a re considered. Ho wev er, the e ffect of the tw o addi- tional terms is down weighted by the data size N , a nd the bias in eq.(8) conv erges to − ( B ∗ − 1) / (2 N ) with the increas e of N . F or the v ar iance of the Shannon entrop y estimate, we adopt the approximation given in [38], where the erro r propaga tio n formula V ar( H obs ) = B X i =1 ∂ H obs ∂ n i 2 V ar( n i ) is invok ed to arrive at the expressio n V ar( H obs ) = 1 N B X i =1 (ln q i + H obs ) 2 q i (1 − q i ) . (9) W e note that for b oth bias and v ariance form ulas in e q .(8) a nd eq.(9), r esp ectively , the independenc e of the binomial v ar iables n i is a ssumed. 3.2 Bia s a nd va r iance of PTERV In order to derive the bias for PTER V, we firs t r ecall that the num b er of p ossible states for ˆ y T t is B 1 = Q T i =1 ( m + i ), for ˆ x t is B 2 = m !, for ˆ y t is B 3 = m !, and for ˆ z t is B 4 = ( m !) K − 2 . These v ar iables enter joint ly in the entropy ter ms of the expression of PTER V in eq.(6), and the po ssible states of the join t v ector v ariables are as follows: B 1234 = B 1 B 2 B 3 B 4 for [ ˆ y T t , ˆ x t , ˆ y t , ˆ z t ], B 234 = B 2 B 3 B 4 for [ ˆ x t , ˆ y t , ˆ z t ], B 134 = B 1 B 3 B 4 for [ ˆ y T t , ˆ y t , ˆ z t ], and B 34 = B 3 B 4 for [ ˆ y t , ˆ z t ]. The o bserved frequency and the estimated pro babilit y for [ ˆ y T t , ˆ x t , ˆ y t , ˆ z t ] are de no ted a s n ij k l and q ij k l = n ij k l / ( N − m − T ), resp ectively , where the index i = 1 , . . . , B 1 , de no tes the sta te of ˆ y T t , and respectively for the other indices. T he observed frequency and estimated probability for the other three v aria bles of s maller dimension are denoted in terms of the resp ective marginal distributions, e.g. n ..kl and q ..kl for [ ˆ y t , ˆ z t ]. F o r each vector v ariable, the num b er of states with p ositive obser ved frequency is denoted with an asterisk in sup e rscript, e.g. B ∗ 34 for the active states of [ ˆ y t , ˆ z t ]. Substituting the bias expr ession in e q .(8) for each entropy term in the express io n for PTER V in eq.(6), we ge t the expres sion for the bias of PTE R V B( I obs ( ˆ y T t ; ˆ x t | ˆ y t , ˆ z t )) = h I obs ( ˆ y T t ; ˆ x t | ˆ y t , ˆ z t ) i − I ∞ ( ˆ y T t ; ˆ x t | ˆ y t , ˆ z t ) = B ∗ 1234 − B ∗ 234 − B ∗ 134 + B ∗ 34 − 4 2( N − m − T ) + 3 B ∗ 1234 − 3 B ∗ 234 − 3 B ∗ 134 + 3 B ∗ 34 − 8 6( N − m − T ) 2 (10) + 1 6( N − m − T ) B ∗ 3 X k =1 B ∗ 4 X l =1 − B ∗ 1 X i =1 B ∗ 2 X j =1 1 n ij k l + B ∗ 2 X j =1 1 n .j kl + B ∗ 1 X i =1 1 n i.kl − 1 n ..kl . Will b e inserted by t h e editor 7 F or the v ariance of PTER V, w e use the error propaga tion for mu la for I obs ( ˆ y T t ; ˆ x t | ˆ y t , ˆ z t ) V ar( I obs ( ˆ y T t ; ˆ x t | ˆ y t , ˆ z t )) = B ∗ 1 X i =1 B ∗ 2 X j =1 B ∗ 3 X k =1 B ∗ 4 X l =1 ∂ I obs ( ˆ y T t ; ˆ x t | ˆ y t , ˆ z t ) ∂ n ij k l 2 V ar( n ij k l ) . F ollowing the sa me a pproximation as for the mutual infor mation of scalar v a riables in [38], we arrive at the expression for the v ariance V ar( I obs ( ˆ y T t ; ˆ x t | ˆ y t , ˆ z t )) = 1 N − m − T B ∗ 1 X i =1 B ∗ 2 X j =1 B ∗ 3 X k =1 B ∗ 4 X l =1 ( − ln q ij k l + ln q .j kl + ln q i.kl − ln q ..kl + I obs ( ˆ y T t ; ˆ x t | ˆ y t , ˆ z t ) 2 q ij k l (1 − q ij k l ) . (11) 3.3 Pa rametric Sign ificance T est for PTERV W e consider now parametric tests for the significance o f PTER V, i.e. for the null hypothesis H 0 : I ∞ ( ˆ y T t ; ˆ x t | ˆ y t , ˆ z t ) = 0, indicating tha t the v a riables ˆ y T t and ˆ x t are independent conditioned on the v ar iable ( ˆ y t , ˆ z t ). A natural choice for the asymptotic distribution of the estimate of m utual infor mation is Gaussian, e.g. se e [29,19], a nd employing the results fo r the bias in e q .(10) and v a riance in eq .(11), we hav e the firs t candidate for the n ull distribution of the PTER V s tatistic I obs ( ˆ y T t ; ˆ x t | ˆ y t , ˆ z t ) ∼ N B( I obs ( ˆ y T t ; ˆ x t | ˆ y t , ˆ z t )) , V ar( I obs ( ˆ y T t ; ˆ x t | ˆ y t , ˆ z t )) . (12) The mutual informa tion of t wo independent discrete v ar iables X and Y is re- lated to the Chi-squa re statistic for the independence test with the expressio n χ 2 = 2 N I obs ( X ; Y ), where the Chi-square distribution has ( | X | − 1)( | Y | − 1) degrees of freedom (dof ), | X | is the num b er of states of X a nd N is the n umber of obser v a- tions of X and Y [34,13]. Ba sed on this r esult, Go eb el e t al [13] proved that the statistic I obs ( X ; Y ) follows Gamma distribution. They e x tended their result to the conditional mutual information, and pr oved that I ( X ; Y | Z ) when X and Y are in- depe ndent conditioned on Z follows also Gamma distribution with shap e par ameter κ = | Z | ( | X | − 1 )( | Y | − 1) / 2 a nd s cale pa rameter θ = 1 / N . This result adapted to our setting constitutes the second candidate for the null distribution of PTER V I obs ( ˆ y T t ; ˆ x t | ˆ y t , ˆ z t ) ∼ Γ B ∗ 34 2 ( B ∗ 1 − 1)( B ∗ 2 − 1) , 1 ( N − m − T ) . (13) If instead we trust the bias and v aria nce approximation in e q .(10) and eq.(11), we can der ive the s ha pe and scale pa rameter of the Gamma n ull distribution fro m these, and then w e have the third ca ndidate for the null dis tr ibution of P TER V I obs ( ˆ y T t ; ˆ x t | ˆ y t , ˆ z t ) ∼ Γ B( I obs ( ˆ y T t ; ˆ x t | ˆ y t , ˆ z t )) 2 V ar( I obs ( ˆ y T t ; ˆ x t | ˆ y t , ˆ z t ) , V ar( I obs ( ˆ y T t ; ˆ x t | ˆ y t , ˆ z t )) B( I obs ( ˆ y T t ; ˆ x t | ˆ y t , ˆ z t )) . (14) W e note that the Ga mma approximation of the null distribution of PTER V in eq.(14), termed Gamma-2, conv er ges to the Gaussian distribution in eq.(1 2) with the increase of bias, while the Ga mma appro ximation in eq.(13), termed Gamma-1, can differ in mean fr o m Gamma-2 a nd Gauss ian distr ibutions. W e show the differences of Gaussia n, Gamma-1 and Gamma-2 distributions in approximating the tr ue PT E R V distribution with a s imple example repr esenting the nu ll hypothesis of conditional indep e ndence. W e genera te the conditioning v aria ble 8 Will b e inserted by t h e editor 0 0.01 0.02 0.03 0 20 40 60 80 100 120 140 160 PTERV(X−>Y|Z) pdf (a) Gaussian Gamma−1 Gamma−2 MC 0 0.1 0.2 0.3 0.4 0.5 0 5 10 15 20 25 30 PTERV(X−>Y|Z) pdf (b) Gaussian Gamma−1 Gamma−2 MC Fig. 1. The true distribution of PTER V and the three approximations, as given in th e legend, formed from 1000 Monte Carlo realizatio ns of the exemplary system of tw o indep end ent v ariables conditioned on a third vari able. The p arameters are T = 1, N = 1024, m = 2 in (a) and m = 3 in (b). Z from a first o r der a utoregres sive pr o c ess and let the other tw o v aria bles dep end linearly on Z x t = az t + ǫ x,t y t = b z t + c x t − 1 + ǫ y ,t (15) z t = dz t − 1 + ǫ z ,t where a = 2, b = − 1, d = 0 . 8, and ǫ x,t , ǫ y ,t , ǫ z ,t are Ga ussian white noise with standard deviation (SD) 1, 2 and 1, resp ectively . W e s et c = 0 to hav e X and Y conditionally indep endent . In Fig . 1, we show the approximate true distribution of PTER V ( T = 1) fr o m 1 000 Monte Ca rlo r ealizations. W e compute the av erage par am- eter v alues from the 100 0 realizations for the three distr ibutions in eq.(1 2), eq.(13) and eq.(14), and draw the three a pproximating distributions. Gamma- 1 ma tches b est the true distr ibution of PTE R V for m = 2, but for m = 3 it lies a t the right o f the true distributio n. F or m = 3, Gaussian and Gamma-2 distr ibutions converge but lie bo th far to the left of the true distribution. The deviation of all three approximations from the true distribution is larg er when we further inc r ease m or employ a mor e inv olved setting, e.g. using nonlinear dep endence of X and Y on Z . First, w e attempt to explain the shortcoming of Ga mma-1 approximation for increasing m . Consider ing the Chi- square indep endence test in the setting of joint rank v a riables, we expect to have zer o cells and inc o mplete contingency table, so that the degrees of fr eedom B ∗ 34 ( B ∗ 1 − 1)( B ∗ 2 − 1) o f the Chi-squa re dis tr ibution asso ciated with the Gamma-1 distr ibutio n in eq.(13) may be ov er estimated. I n turn, this leads to ov erestimation o f the bias B( I obs ( ˆ y T t ; ˆ x t | ˆ y t , ˆ z t )), b ecause the mean of the null Gamma distribution is the pro duct o f the shap e and scale parameter. T o the b est of our knowledge there is no sta ndard a pproach to determine the deg r ees o f fr eedom for the Chi-square statistic for incomplete contingency tables, especia lly when the zero cells depend on the corr elation structure o f the inv olved v ariables, e.g. see [22,20]. Regarding the Gaussian and Gamma-2 approximations, we firs t note that the shap e of the a pproximating distribution to the tr ue null distribution of PTER V do es not constitute an issue. The bia s of PTER V is large (compared to the width of the distribution) even for small m and K and the distribution of PTER V beco mes esse n- tially Ga ussian [29]. The estimation of the bias of P TER V, even when extending the T aylor a pproximation to third order terms (see eq.(10)), is not accura te and deviates Will b e inserted by t h e editor 9 at an extent tha t dep ends on the pa r ameters inv o lved in the definition of PTE R V ( m , K and T ), and also on the inter-depe ndence of the co mpo nents in ( ˆ y t , ˆ z t ) and the dependence o f ˆ y T t and ˆ x t on ( ˆ y t , ˆ z t ). These dependencies ca use violation o f the assumption o f independence of the binomial v ariables n ij k l in the computation o f the bia s and the effect is larger when the n umber of states of the inv o lved v ariables increase, i.e. either of m , K and T increases. 3.4 Ran domizatio n Significa nce T est fo r PTER V The insufficiency of the analytic approximation of the true null distribution for the significance test for PTER V pav es the wa y for employing r esampling approaches. W e consider here the randomization test making use of the time-shifted surr ogates [36]. F or P TER V, this is s ucceeded by c ircular shifting the components of the time se r ies of the driving v ariable, { ˆ x t } = { ˆ x ( m − 1) τ +1 , ˆ x ( m − 1) τ +2 , . . . , ˆ x N − T } , by a r andom time step w producing the surro gate time series { ˆ x ∗ t } = { ˆ x ( m − 1) τ + w +1 , . . . , ˆ x N − T , ˆ x ( m − 1) τ +1 , . . . , ˆ x ( m − 1) τ + w } . The tuple { ˆ y T t , ˆ x ∗ t , ( ˆ y t , ˆ z t ) } represents H 0 as the in trinsic dynamics o f eac h v a riable are preserved but the co upling betw een the dr iving v aria ble ˆ x ∗ t and the resp ons e v ariable ˆ y T t is destr oy ed, s o that it holds I ∞ ( ˆ y T t ; ˆ x ∗ t | ˆ y t , ˆ z t ) = 0 . How ever, the time displacement o f ˆ x t destroys a lso the po ssible dependence structure of ˆ x t on the condi- tioning v ar iable ( ˆ y t , ˆ z t ). This is a p oint of inconsistency that may affect the matching of the sa mple distributio n of PTER V, computed on an ensemble of sur rogate tu- ples { ˆ y T t , ˆ x ∗ t , ( ˆ y t , ˆ z t ) } , to the true null distribution o f I ∞ ( ˆ y T t ; ˆ x t | ˆ y t , ˆ z t ). On the other hand, the co nstruction of surro gate tuples { ˆ y T t , ˆ x ∗ t , ( ˆ y t , ˆ z t ) } that preser ve all the orig- inal inter-dep endencies and destroys only the coupling of ˆ y T t and ˆ x ∗ t is an open, yet unsolved, problem. The rando miza tion test is compared with the parametric tests on the basis o f the example in eq.(15). F o r one r ealization of the s ame system, the three para met- ric null distributions a nd the n ull distribution formed by the PTE R V v alues fro m 1000 s urroga tes ar e shown in Fig. 2. F or c = 0 the v a riables X and Y a re condi- tionally indep endent and H 0 holds. F or this case and m = 2, a s shown in Fig. 2a, we obtain no rejection for a n y o f the four one-sided tests, where the test statistic is I obs ( ˆ y T t ; ˆ x t | ˆ y t , ˆ z t ) and the r ejection regions are formed fro m each a pproximate null distribution. In this case the surroga te distribution is well matched by the Gamma- 1 distribution. How ever, for m = 3, I obs ( ˆ y T t ; ˆ x t | ˆ y t , ˆ z t ) lie s well on the r ight of the Gaussian and Gamma-2 distributions giv ing false rejection, and on the left of the Gamma-1 and surroga te distributions giving corr e c tly no rejection (see Fig. 2b). The failure of the surrog ate distributio n to c o nt ain I obs ( ˆ y T t ; ˆ x t | ˆ y t , ˆ z t ) is attributed to the inconsistency that the origina l X v aria ble dep e nds on Z but the sur rogate X do es not. When X drives Y ( c = 1), all four approaches give correctly confident rejectio n of H 0 for m = 2 (see Fig. 2c), but for m = 3 the r esults a re the same a s for c = 0 (Fig. 2d). Thu s the inconsistency mentioned above affects the p ow er of the surrog ate data test, when there is dep endence b et ween the driving v ar iable and the conditioning v aria ble. When we remov e this dep endence, setting a = 0, the sur rogate data test p erforms well for b oth m = 2 and m = 3 (see Fig. 2 e and f ). Indeed for m = 3, the estimated probability of rejection of H 0 at the s ignificance level α = 0 . 0 5 fro m 1 000 r ealizations is 99.8 for the test with Gamma-1 approximation, 6 8.6 for the randomization test and 1.0 for Gaussian a nd Gamma-2 a pproximations. W e a rgued in Sec. 2.4 that PSTE is sub optimal for its purp ose and advo cated for using PTE R V instead. Having ˆ y t + T as re s po nse v ariable in PSTE (instead of 10 Will b e inserted by t h e editor −5 0 5 10 15 20 25 x 10 −3 0 50 100 150 200 PTERV(X−>Y|Z) pdf (a) Gaussian Gamma−1 Gamma−2 Surrogate 0 0.1 0.2 0.3 0.4 0.5 0 5 10 15 20 25 30 PTERV(X−>Y|Z) pdf (b) Gaussian Gamma−1 Gamma−2 Surrogate −0.02 0 0.02 0.04 0.06 0.08 0 20 40 60 80 100 120 140 160 PTERV(X−>Y|Z) pdf (c) Gaussian Gamma−1 Gamma−2 Surrogate 0 0.1 0.2 0.3 0.4 0.5 0 5 10 15 20 25 PTERV(X−>Y|Z) pdf (d) Gaussian Gamma−1 Gamma−2 Surrogate 0 0.05 0.1 0 50 100 150 200 PTERV(X−>Y|Z) pdf (e) Gaussian Gamma−1 Gamma−2 Surrogate 0 0.1 0.2 0.3 0.4 0.5 0 5 10 15 20 25 PTERV(X−>Y|Z) pdf (f) Gaussian Gamma−1 Gamma−2 Surrogate Fig. 2 . The th ree p arametric appro ximations of the null distribution of PTER V ( T = 1) and the distribution formed by 1000 time-shifted surrogates, as given in the legend, for one realization of length N = 1024 from the system in eq.(15) with b = − 1, d = 0 . 8. The other parameters differ in the six panels as fol low s: (a) a = 2, c = 0, m = 2, (b) a = 2, c = 0, m = 3, ( c) a = 2, c = 1, m = 2, (d ) a = 2, c = 1, m = 3, (e) a = 0, c = 1, m = 2, (f ) a = 0, c = 1, m = 3. The observed v alue of PTER V is sho wn by a vertical line. Will b e inserted by t h e editor 11 ˆ y T t used in PT E R V) introduces stronger dependence of the r esp o nse v ariable o n the conditioning v a riable b ecause ˆ y t + T and ˆ y t are for med from sample vectors that may hav e common co mp onents. In turn this pro duces smalle r v alues of CMI and th us it is harder to iden tify sig nificant causal effects. In pa rticular, the pow er of the ra ndom- ization test with PSTE (quantified by the relative frequency of r e jections o f the null hypothesis of no coupling when there are true direct causal co nnections) is smaller even when there is no dep endence b etw een the driving v aria ble X a nd the condi- tioning v ar ia ble Z . F or example, fo r the last setting of the system in eq .(15) ( a = 0, b = 1, c = 1, m = 3), using P STE as test statis tic ther e are no r ejections for the randomizatio n test and the test with Gamma- 1 approximation bec ause PSTE lies alwa ys on the left tail of bo th n ull distributions. 4 Simulations and Results W e asse s s the a bilit y of PTER V to ident ify the corr ect direct causal effects in multi- v ariate time series and compare it to PSTE and PTE (using the k - nearest neighbo r estimate a nd k = 5). F o r P TER V and PSTE w e apply the parametric tests and the randomizatio n test, and for PTE only the randomization test. T o acco unt for multi- ple testing, the co rrection o f false discov ery rate (FDR) is employ ed [8]. Acco rding to FDR, w e order the p -v a lues of the K ( K − 1) tests, p 1 ≤ p 2 ≤ ... ≤ p K ( K − 1) , and if p k is the large s t p -v alue for which p k ≤ αk / ( K ( K − 1)) holds, then a ll H 0 regar ding p 1 , . . . , p k are rejected at the significance level α . Thus the la rger the K , the sma ller the p -v alue has to b e to give rejectio n. The implica tio n of this for the randomizatio n test is that the num b er M of s urroga tes has to b e la rge b ecause the smallest p - v alue that can be obtained from rank ordering is roughly 1 / ( M + 1). 2 In the sim ulations we use K up to 5 and setting M = 1 00 we did no t encounter any insufficiency of the randomizatio n test due to the requirements of the FDR corr ection. 4.1 S t ationary t ime series W e first consider the stationar y multiv a riate time s eries fr om the sys tem o f K coupled H ´ enon ma ps, defined a s x i,t = 1 . 4 − x 2 i,t − 1 + 0 . 3 x i,t − 2 , i = 1 , K x i,t = 1 . 4 − 0 . 5 C ( x i − 1 ,t − 1 + x i +1 ,t − 1 ) + (1 − C ) x 2 i,t − 1 + 0 . 3 x i,t − 2 , i = 2 , . . . , K − 1 where the para meter C deter mines the strength of co upling. The results for weak coupling ( C = 0 . 2) and for K = 3 a nd K = 5 are shown in T able 1. The r e sults for Gamma-2 tes t are very similar to those of Gaussian tes t and are no t shown. F or a ll non-existing or indirect couplings, all measure s and with a ll tests give none or only few rejections using FDR at the lev el of sig nificance α = 0 . 05 (5 out of 100 rea lizations), except the Gaussian approximation that g ives alwa ys s ignificant rejections for K = 5. The randomizatio n test with PTE de tec ts b est the true direct causal effects, fo llowed clo sely b y the ra ndomization test with PTE R V, while using PSTE the p ower of the ra ndomization test is decr eased for K = 5 a nd even nu llified for K = 3. The parametric test with Gamma-1 approximation has smaller power than the randomizatio n test using P TER V and the opposite is obser ved using PSTE (the latter only fo r K = 5). 2 Using the correction for the empirical cu mulative function in [51], we compute the p - v alue for the one-sided test as 1 − ( r 0 − 0 . 326) / ( M + 1 + 0 . 348), where r 0 is the rank of the original measure v alue in the ordered list of M + 1 val ues. 12 Will b e inserted by t h e editor PTER V PSTE PTE K = 3 Gaussian Gamma-1 Surrogate Gaussian Gamma-1 Su rrogate Surrogate X 1 → X 2 94 81 94 32 6 7 100 X 2 → X 1 1 0 3 1 0 0 2 X 1 → X 3 0 0 2 0 0 1 6 X 3 → X 1 1 0 3 1 0 0 1 X 2 → X 3 0 0 2 0 0 1 5 X 3 → X 2 94 77 90 34 8 7 100 K = 5 X 1 → X 2 100 40 77 95 9 30 69 X 2 → X 1 13 0 2 13 0 1 3 X 1 → X 3 59 0 3 80 0 1 2 X 3 → X 1 14 0 4 8 0 2 4 X 1 → X 4 59 0 0 72 0 2 0 X 4 → X 1 14 0 0 9 0 0 1 X 1 → X 5 20 0 1 11 0 1 3 X 5 → X 1 10 0 2 9 0 2 0 X 2 → X 3 97 46 51 100 52 33 69 X 3 → X 2 98 32 39 98 32 23 67 X 2 → X 4 70 12 6 90 15 4 2 X 4 → X 2 66 10 3 85 13 3 2 X 2 → X 5 12 0 2 8 0 1 4 X 5 → X 2 54 0 0 67 1 0 3 X 3 → X 4 98 28 39 100 32 18 68 X 4 → X 3 96 48 52 99 46 35 67 X 3 → X 5 11 0 5 10 0 5 1 X 5 → X 3 68 0 3 79 0 1 5 X 4 → X 5 17 0 6 7 0 4 3 X 5 → X 4 100 50 69 98 13 21 69 T able 1. The num b er of rejections (using the FDR correction) of the parametric tests, denoted as Gaussian and Gamma-1, with PTER V and PSTE and the randomization tests, denoted as Surrogate, w ith PTER V, PSTE and PTE for 100 realizations of th e system of K = 3 and K = 5 coup led H´ enon maps with C = 0 . 2, N = 1024. The other parameters are m = 2, τ = 1 an d T = 1. The ex tension of the simulations to different coupling str engths C r eveals the sup e riority of P TE a nd insufficiency of PSTE in detecting direct causal effects when the coupling is weak. In Fig. 3 , PTER V, PSTE a nd PTE as w ell as the num ber of rejections in 1 00 realizations o f the ra ndomization tests a re drawn fo r a rang e of C . Though the three mea sures are drawn at the sa me s c ale, their ra ng e is not comparable beca use PTE is estima ted by near est neighbors on the contin uous-v alued time series and its bias has different r ange than the bias of PTE R V and PSTE, and the bias o f PTE R V and PSTE a lso differ due to different n umber of states of ˆ y T t and ˆ y t + T , re spec tiv ely . How ever, for the true co upling in Fig. 3a , one can note that PTE tends to increase steeper than PTE R V, which in turn increas es steep er than PSTE. Accordingly , PTE and PTER V are likely to b e fo und significant for as s mall C a s 0.1, while PSTE gets sig nificant o nly for strong co upling ( C ≥ 0 . 4). The lower level of PTE is negative, so that zero PTE is actually found significa n t (see for C = 0 . 1 in Fig. 3a), which is counterin tuitive. There a re even some few rejections o f H 0 of no co upling when PTE is negativ e, as sho wn for large C for the er roneous causa lit y X 2 → X 1 in Fig . 3b. F or the latter setting, PTE R V is found s tatistically s ignificant Will b e inserted by t h e editor 13 0 0.1 0.2 0.3 0.4 0.5 −0.05 0 0.05 0.1 0.15 0.2 0.25 0.3 C q(X 1 → X 2 ) (a) PTERV PSTE PTE 0 0.1 0.2 0.3 0.4 0.5 −0.03 −0.02 −0.01 0 0.01 0.02 0.03 0.04 0.05 C q(X 2 → X 1 ) (b) PTERV PSTE PTE Fig. 3. PTER V, PSTE and PTE measures (denoted collectiv ely q ) are give n as functions of the coupling strength C for the true direct causality X 1 → X 2 in (a) and the n on - existing coupling X 2 → X 1 in (b) for the coupled H´ enon maps of 3 v ariables ( m = 2, τ = 1, T = 1). The num b er of rejections in 100 realizations of the randomization test det ermines the size of a symbol displa yed for each measure and C , where in the legend the size of th e symbols regards 100 rejections. showing the tendency to detect coupling in the wr ong directio n when the coupling strength is large . F or the sim ulation setting abov e, it w as found that the Gaussian and Ga mma-2 parametric tes ts hav e decreas ed power co mpared to the Gamma-1 para metric test and the ra ndo mization test. F urther simulations sho wed tha t this holds only for m = 2 and for lar ger m the bias is undere stimated giving re jectio ns for the Ga ussian and Gamma-2 parametr ic tests, and on the o ther ha nd the Ga mma-1 parametric test tends to b e overly co ns erv ative. F or example for K = 3, C = 0 . 2 and m = 3 , Gauss ian and Gamma-2 para metric tests give alwa ys r ejection and Gamma -1 parametric test gives alwa ys no rejection for any pair of v a riables. On the other hand, the randomization test gives optimal results for b oth PTER V and P STE, i.e. 100 r ejections when there is true dir ect caus a lit y and no rejections when there is not, and the same is obtained with PTE . W e note also that PTER V and PSTE converge in their per formance as m gets larger b ecause then the effect of defining the r esp onse rank vector differently weak e ns. W e asse s s the measures on a s ystem of thr ee coupled Lorenz subsystems ˙ x 1 = − 10 x 1 + 1 0 y 1 ˙ y 1 = − x 1 z 1 + 2 8 x 1 − y 1 ˙ z 1 = x 1 y 1 − 8 / 3 z 1 ˙ x i = − 10 x i + 1 0 y i + C ( x i − 1 − x i ) ˙ y i = − x i z i + 2 8 x i − y i ˙ z i = x i y i − 8 / 3 z i i = 2 , 3 (16) The system is solved using the explicit Runge- Kutta (4,5) method implemented in the solver o de45 in Matlab and the time series are gene r ated at a sampling time of 0 .01 time units. W e observ e the firs t v ar iable of each of the three systems, i.e. the tuple of observed v ariables ( X , Y , Z ) is ass igned to ( x 1 , x 2 , x 3 ), so the direct couplings are X → Y and Y → Z . W e use the same coupling streng th C for b oth couplings . F or the flow system, longer time series are required to detect the information flow and in T able 2 we show the r esults for N = 4096 and N = 16 384 for w ea k coupling ( C = 2). Again the para metr ic tests fail for b oth PTE R V and P STE. F o r N = 4096 , the randomizatio n tests with PTER V and P STE hav e go o d significance (we use again α = 0 . 05 and FDR corr ection) but almo s t no p ow er, while the rando mization test with PTE has optimal pow er and significance. It seems that the r ank measures are more data dema nding and as we increased N we could improve the p ow e r of their 14 Will b e inserted by t h e editor PTER V PSTE PTE N = 4096 Gamma-1 Su rrogate Gamma-1 Surrogate S urrogate X → Y 0 11 0 9 100 Y → X 0 0 0 0 3 X → Z 0 1 0 1 6 Z → X 0 0 0 0 2 Y → Z 0 3 0 2 100 Z → Y 0 1 0 1 2 N = 16384 X → Y 0 99 0 92 100 Y → X 0 0 0 0 9 X → Z 0 2 0 3 43 Z → X 0 1 0 1 8 Y → Z 0 90 0 77 100 Z → Y 0 30 0 29 7 T able 2. The number of rejections (using the FDR correction) of the Gamma-1 parametric test with PTER V and PSTE and the randomization (surrogate) test with PTER V, PSTE and PTE for 100 realizations of the K = 3 coupled Lorenz systems with C = 2, for N = 4096 and N = 16384. The other p arameters are m = 4, τ = 1 and T = 1. randomizatio n test, as shown in T able 2 for N = 163 84. How ever, bo th PTER V a nd PSTE tend to falsely detect the coupling Z → X , while P TE detects also falsely and with higher estimated probability the indirect coupling X → Z . Note that for this setting having a larg er embedding dimensio n ( m = 4) PSTE p er fo rms as well as PTER V. F urther simulations for differen t coupling strengths reveal sho r tcomings of all mea - sures. As sho wn in Fig. 4 for N = 40 96, PTER V and PSTE incr ease with C in the same way as PTE for the tw o tr ue dir ect coupling s . How ever, the power of the r an- domization tests fo r the tw o rank measur es is muc h smaller tha n for PTE for the fir st true direct coupling ( X → Y in Fig. 4a) and at the zero level for the second true direct coupling ( Y → Z in Fig . 4b). On the other hand, b oth P TER V and P STE ar e at the zero level when there is indirect o r no coupling a nd the ra ndomization test has the co rrect sig nificance, unlike the randomizatio n test with P TE that tends to reject with la rger pr obability than the significa nce level, which incre a ses with C . The latter is more pr onounced for the indirect coupling ( X → Z in Fig . 4c), while for no coupling, sig nificant r ejections ar e observed for large C (a s for Y → X shown in Fig. 4d). Other s im ulations not shown here suggest that it is difficult to estimate the correct causality structure in this system and the results are sensitive to the choice of the parameters m , τ a nd T . W e note that whe n we added observ a tio nal noise to the time series of the H´ enon a nd Lo renz c o upled system we observed that the p ow e r of the randomizatio n tests w er e reduced accordingly a nd in the same way for all causality measures. 4.2 No n-stationary time series The simulation results show e d that PTER V cannot reach the per formance of PTE in detecting cor rectly the direct causa l effects. How ever, there is a pr a ctical situation that PTER V ca n indeed be more useful than P TE, na mely in the presence of drifts Will b e inserted by t h e editor 15 0 1 2 3 4 5 6 −0.05 0 0.05 0.1 0.15 0.2 0.25 0.3 C q(X 1 → X 2 ) (a) PTERV PSTE PTE 0 1 2 3 4 5 6 −0.05 0 0.05 0.1 0.15 0.2 0.25 0.3 C q(X 2 → X 3 ) (b) PTERV PSTE PTE 0 1 2 3 4 5 6 −0.1 −0.05 0 0.05 0.1 0.15 0.2 0.25 0.3 C q(X 1 → X 3 ) (c) PTERV PSTE PTE 0 1 2 3 4 5 6 −0.1 −0.05 0 0.05 0.1 0.15 0.2 0.25 0.3 C q(X 2 → X 1 ) (d) PTERV PSTE PTE Fig. 4. As Fig. 3 but for the three coup led Lorenz systems, m = 4, τ = 1, T = 1, 4096, and the couplings X → Y in (a), Y → Z in (b), X → Z in ( c), and Y → X in (d). in the tim e ser ies, a common data condition in man y applications. PTE a long with many other measures of Gr a nger causality as s ume s tationarity o f the time ser ies. On the other hand, the measures a pplied to the ra nks r ather than the samples are little affected by non-sta tionarity in the mea n. This is so b ecause in the es timation of the effect of the driving v a riable o n the resp onse v ariable the level of their magnitudes is disregar ded and only the relative magnitude ordering counts. W e demonstr ate the a ppropriateness of PTER V as compared to PTE on synthet- ically constructed no n-stationary time serie s. W e assume the co upled H´ enon maps in three v aria bles and add to ea ch time ser ie s a s tochastic tr end that is computed as follows. First, a Gaussian r andom walk time s eries of the s ame leng th as the or iginal time series is g enerated, where the SD of the random steps is the same as the SD of the H´ enon time series. Then a moving average smo othing of order 100 is applied to the rando m walk time series. This tim e s eries of smo othed s to chastic trend is a dded to the time serie s of the firs t v aria ble, X 1 , of the coupled H ´ enon maps, and the same pro cess is rep eated for X 2 and X 3 . An example is shown in Fig. 5. There are no stan- dard metho ds to remove sto chastic trends and dep ending on the employ ed appr oach different time ser ies ma y b e derived and the orig inal dynamics ma y be altered [47]. F or example, the fit of a polyno mial of order 15 seems to matc h well the slo w drift (Fig. 5a), but the deriv ed time series after detr e nding, seems to hav e v a riations not exp ected in the origina l time series g enerated by the coupled H´ enon map (Fig. 5b). W e co mpute the meas ures PTER V, PSTE and PTE a nd conduct the Gamma- 1 parametric test and ra ndomization tes t on 100 non-stationa ry multiv ar iate time series from the coupled H ´ eno n maps with C = 0 . 2 , and also on the detrended time series subtracting the p olynomial fit (se e T a ble 3). F or the non-stationar y time series, 16 Will b e inserted by t h e editor 0 200 400 600 800 1000 1200 0 10 20 30 40 50 60 t X 1 (t) (a) 0 200 400 600 800 1000 1200 −3 −2 −1 0 1 2 3 t X 1 (t) (b) Fig. 5. (a) A time series of the v ariable X 1 of the coupled H´ enon maps ( K = 3) after adding to it a sto c hastic tren d. Sup erimp osed is th e fit of a p olynomial of degree 15. (b ) The time series in (a) detrended by sub tracting the p olynomial fit. PTER V PSTE PTE Gamma-1 Su rrogate Gamma-1 Surrogate S urrogate time series with slow d rifts X 1 → X 2 56 67 8 13 1 X 2 → X 1 3 2 5 3 4 X 1 → X 3 2 3 3 4 0 X 3 → X 1 4 3 5 5 2 X 2 → X 3 1 3 0 3 2 X 3 → X 2 56 67 14 13 3 time series after detrending X 1 → X 2 81 89 8 13 100 X 2 → X 1 0 1 0 0 16 X 1 → X 3 1 3 1 2 9 X 3 → X 1 0 2 1 2 6 X 2 → X 3 0 3 0 2 18 X 3 → X 2 76 89 8 14 100 T able 3. The number of rejections (using the FDR correction) of the Gamma-1 parametric test with PTER V and PSTE and the randomization ( surrogate) tests with PTER V , PS TE and PTE for 100 realizations of K = 3 coupled H´ enon maps with C = 0 . 2, N = 1024. The other parameters are m = 2, τ = 1 and T = 1. The up p er p art is for the non-stationary time series (after a smo othed slow drift is added) and the low er part for t he time series obtained after detrending with a p olynomial of order 15. as expec ted, PTE fails to detect a n y co upling. On the other hand, PTER V and PSTE p er fo rm similarly to the case of no drifts with somehow smaller p ower of the ra ndo mization and Gamma-1 tests (compare T able 3 to T able 1). Again PSTE has no power to detect the true direct ca usal effects. When PTE is a pplied to the detrended time s e r ies, it regains detection o f the true dir ect ca usal effects, but it falsely e s timates also the oppos ite causal effects with a n e s timated pr obability clos e to 0.2 . On the other hand, the par ametric and randomizatio n test with PTE R V gains almost the same p ower as if there was no drift to b e detrended, while the tests with PSTE show again no p ower. Will b e inserted by t h e editor 17 0 200 400 600 800 1000 1200 −5 0 5 10 15 20 25 30 35 t X 1 (t) (a) X 1 MA(5) MA(100) MA(250) 0 50 100 150 200 250 0 0.02 0.04 0.06 0.08 0.1 P q(X 1 → X 2 ) (b) PTERV PSTE PTE 0 50 100 150 200 250 −0.01 0 0.01 0.02 0.03 0.04 P q(X 2 → X 1 ) (c) PTERV PSTE PTE Fig. 6. (a) A time series of the v ariable X 1 of the coupled H´ enon maps ( K = 3) after adding to it a sto chastic trend and sup erimp osed is the moving a verage smoothing of different orders P , as sho wn in the legend. (b) and (c) PTER V, PSTE and PTE measures (denoted collectiv ely q ) as functions of the order P of the mo ving a verage smoothin g used to detrend eac h t ime series from th e coupled H´ enon maps of 3 va riables ( N = 1024, C = 0 . 2, m = 2, τ = 1, T = 1). The number of rejections in 100 realizations of the randomization t est determines th e size of a symbol display ed for eac h measure and P , where in the legend the size of the symbols regards 100 rejections. The panel in (b) is for the coupling X 1 → X 2 and in (c) for X 2 → X 1 . The t yp e of detre nding turns out to have very little effect on the ra nk measures but it has o n PTE. F or the same exa mple, and a weak er sto chastic trend with the SD o f the random walk increments b eing 0.6 times the SD of the coupled H´ enon time series, we a pply smo othing with moving a verage of different orders P . As shown in Fig. 6a, a small P (but not as s mall to w as h out the true dyna mics , say o ne or tw o) ov er fits the sto chastic trend while a large P leav es some drift in the time serie s . A bes t P is ha rd to find, a nd even w he n us ing the sa me P a s for the g eneration o f the sto chastic trend ( P = 100 ), some small dr ift ca n b e seen to r emain, knowing that the true time se ries do es not contain an y slow fluctuations. W e co mputed PTER V, PSTE and PTE and made r andomization tests on 100 realizations f or a r ange o f o rders P of moving av erage detrending, and the r esults for the tr ue direct coupling X 1 → X 2 and the no n-existing c o upling X 2 → X 1 are shown in Fig. 6b and c, resp ectively . PTER V has striking robustness to the level of detrending a nd b oth its v alue and the per centage of rejections for the randomization test are at the sa me lev el for any P , including P = 0 that regards no detrending. PSTE is equal stable but fails to detect the true direct co upling as was the cas e with sta tionary time ser ies. PTE is affected by P a nd b ecomes very irreg ular. F o r the true coupling X 1 → X 2 , PTE increases 18 Will b e inserted by t h e editor with P for small P up to a p eak and then decre ases with P . Accordingly , the p ow er of the randomization test decreases down to the zer o level for P = 250 reach ing the same p er fo rmance a s for the gener ated non-statio na ry time series . Remark ably , for the no n-existing coupling X 2 → X 1 , the pattern o f the dependence of PTE on P is the opp osite, and for the r ange of P the tr ue coupling w as b est detected, a larger num be r of rejectio ns than the nominal significance lev el is obser ved for the r andomization test. These results show that PTER V, unlike P TE, ca n dir ectly be applied to multiv a riate time series with trends and av oid th us detrending that may alter the dyna mics and int er-dep endencies. 5 Discussion The r ank measur e s of causa lit y of partia l transfer entrop y on ra nk vectors (PTER V) and partial symbolic tra nsfer ent ropy (P STE) extend the biv ar iate causality mea- sures TER V and STE , resp ectively , to a ccount for the presence of other obser ved confounding v ariables . In the same wa y that TER V was develop ed to mo dify the fu- ture resp onse vector in STE in order to co r resp ond exactly to transfer entropy (TE), PTER V is the direct analogue of pa rtial transfer en tro py (P T E ), substituting samples with r anks. PTER V has a clear adv antage ov er PTE if the latter is estimated b y bin- ning metho ds b ecause the domain of joint probabilities for PTER V is generally muc h smaller (for a dimension m the size of the domain for ranks is m ! and for the binning is b m where b is the num b er o f bins). Therefore in our simulation study we compare d PTER V and PSTE with P TE using an adv anced es timate of nearest neighbors that is found to be muc h more efficient than any binning estimate. W e a ttempted to determine the asymptotic pr op erties o f PTER V, and subse- quently PSTE, approximating first the bias and v ar iance, a nd then the distribution of PTE R V when there is no coupling. W e considered a pproximations with Gaussian and Gamma dis tributions expres s ing their para meters in terms of the estimated bias and v aria nce, and also using known re s ults on Ga mma approximation of conditional m utual informatio n. W e consider ed these a pproximations for the null distributio n of parametric tests for the significance of P TER V (and P STE). How ever, for the prob- lem of asses sing direct coupling, there are often cer tain dep endence structures of the driving and the r e spo nse v a riable on the confounding v aria bles, which the analytic approximations do not enco mpa ss and thus the pa rametric tests are likely to fail. W e confirmed this with simulations that show ed also that the randomization test using time-shifted surr ogates, though it canno t encompas s all types of dep endencies, is sup erior to the par ametric tests. More work is nee ded to improv e the a nalytic a p- proximation of the dis tr ibution of PTER V, a nd direc t causa lit y meas ur es in gener al, so as to make the pa rametric tests more accur a te. The corr e ct detection of the true direct causa lit y is a difficult task, a nd depending on the underlying intrinsic dynamics of each subsystem a nd the coupling structure o f them, one has to search for the optimal setting o f the reconstructio n par a meters for all inv o lved v aria bles (resp onse, driving, conditioning ) as well as the horizon of the time ahead. The rank measures were found to b e particularly sens itiv e to the choice of the reconstructio n pa rameters. The em b e dding dimensio n has significant effect on the per formance of the r ank causality measur es in the same w ay that the estimation of the probability mas s function dep end heavily o n the dimension of the discrete v a riable. Moreov er, while PTER V can estimate better direct c ausal e ffects than PSTE for small m , a s m increases the tw o measur es conv erge b ecause the difference in the definition of the future resp onse vector is small in the context of larg e embedding vectors. The sim ulations o n chaotic coupled systems s howed that PTER V p erforms alwa ys better than or equally g o o d as PSTE. Compare d to P TE using the neare s t neighbor Will b e inserted by t h e editor 19 estimate, PTER V is mor e data demanding and thus the p ow e r o f the rando mization test using PTER V is smaller. PTER V is robus t to drifts in the time series and the simulations s how ed that bo th the p ow er a nd significance of the r a ndomization test with PTER V remains stable when sto chastic trend is added in the time ser ies, as well a s under differe nt levels of detrending. F or these data co nditions, PT E is found inappropr iate and the same holds fo r a n y causality measur e based on samples rather than ranks . References 1. J. M. Amig´ o. The eq ualit y of Kolmogoro v -Sinai entrop y and metric p ermutation entrop y generalized. Physic a D: Nonline ar Phenomena , 241(7):789–7 93, 2012. 2. J. M. Amig´ o, M. B. Kennel, and L. Ko carev. The p ermutation entrop y rate eq u als the metric entrop y rate for ergo dic information sources and ergodic dyn amical systems. Physic a D: Nonline ar Phenomena , 210(1–2):77–95, 2005. 3. A. Antos and I . Konto yiannis. Co nv ergence prop erties of functional estimates for discrete distributions. R andom Structur es and Algorithms , 19(3-4):163– 193, 2001. 4. J. Arnhold, P . Grassb erger, K . Lehnertz, and C. E. Elger. A robust method for d etectin g interdependences: Application to intracraniall y recorded EEG. Phy sic a D , 134:419 –430, 1999. 5. L. Baccala and K. Sameshima. P artial directed coherence: a new concept in neural structure determination. Biolo gic al Cyb ernetics , 84(6):463 – 474, 2001. 6. A. Bahraminasab, F. Ghasemi, A . Stefanovsk a, P . V. E. McClintock, and H. K antz. Direction of coupling from phases of interacting oscillators: A p ermutation information approac h. Physic al Re view L etters , 100(8):08 4101, 2008. 7. C. Bandt and B. Pompe. P ermutatio n entrop y : a natural complexity measure for time series. Physic al R eview L etters , 88:174102, 2002. 8. Y. Benjamini and Y. Hoch b erg. Controlling the false disco very rate: A practical and p o wer ful app roac h to multiple testing. Journal of the R oyal Statistic al So ciety. Series B (Metho dolo gic al) , 57(1):289– 300, 1995. 9. J. A . Bonachela , H. Hinric hsen, an d M. A. M ˜ uoz. Entrop y estimates of small d ata sets. Journal of Physics A: Mathematic al and The or etic al , 41(20):20200 1, 20 08. 10. D. Chicharro and R.G. And rzejak. Reliable d etection of directional couplings using rank statistics. Physic al R eview E , 80:026 217, 2009. 11. L. F aes, S. Erla, and G. Nollo. Measuring connectivity in linear multiv ariate p rocesses: Definitions, interpretation, and practical analysis. Computational and Mathematic al Metho ds in Me di ci ne , 2012:1 40513, 2012. 12. J. Gew eke. Measuremen t of linear d ep en d ence an d feedbac k b etw een multiple time series. Journal of the Americ an Statistic al Asso ciation , 77(378):304– 313, 19 82. 13. B. Goeb el, Z. Dawy , J. H agenauer, and J.C . Mueller. An app ro ximation to the distribu- tion of finite sample size m utual information estimates. IEEE International C onfer enc e on Communi c ations , 2:1102–110 6, 20 05. 14. J. Granger. Investig ating causal relations by econometric mo dels and cross-sp ectral metho d s. A cta Physic a Poloni c a B , 37:424–43 8, 19 69. 15. P . Grassb erger. En tropy estimates from insufficient samplings. arXiv:physics/ 0307138v2. 16. P . Grassberger. Finite sample corrections to entrop y and dimension estimates. Physics L etters A , 128(6,7):36 9–373, 1988 . 17. T. Haruna and K. Nak a jima. Sy mbolic transfer en tropy rate is equal to trans- fer entrop y rate for biv ariate finite-alphab et stationary ergodic Mark ov processes. arXiv:1112.24 93 v2. 18. T. Haruna and K. Nak a jima. P ermutation complexity via d ualit y betw een v alues and orderings. Physic a D: Nonline ar Phenomena , 240(17):13 70–1377, 20 11. 19. M. Hu t ter and M. Zaffalon. Distribution of mutual information from complete and incomplete data. Computational Statistics & Data Ana lysis , 48:633–657 , 200 5. 20 Will b e inserted by t h e editor 20. S.-S. Kang and M. D. Larsen. T ests of indep endence in incomplete multi-w a y tables using likeli ho od functions. Journal of the Kor e an Statistic al So ciety , 41(2):189–19 8, 2012. 21. K. Keller, A. M. Unak afo v, and V. A . Unak afov a. On th e relation of KS entropy and p erm utation entrop y . Physic a D: Nonline ar Phenomena , 241(18):1477–148 1, 2012. 22. D. K im and A. Agresti. Nearly exact tests of conditional ind ep endence and marginal homogeneit y for sparse contingency t ables. Com putational Statistics & Data Analysis , 24(1):89–1 04, 1997. 23. A. Krasko v, H. St¨ ogbauer, and P . Grassb erger. Estimating m utual information. Physic al R eview E , 69(6):06613 8, 20 04. 24. D. Kugium tzis. T ransfer en tropy on rank vectors. Journal of Nonline ar Systems and Applic ations , 3(2):73–81, 2012. 25. A. Lesne, J-L. Blanc, and L. Pezard. Entrop y estimation of very short symbolic se- quences. Physic al R eview E , 79:046 208, 2009. 26. M. Lungarell a, K. Ishiguro, Y. Kuniyos hi, and N. Ot su. Methods for quantifying the causal structu re of b iva riate time series. Journal of Bif ur c ation and Chaos , 17(3):903– 921, 2007. 27. G. A. Miller. Note on the b ias of information estimates. In Information The ory i n Psycholo gy: Pr oblems and Metho ds , pages 95–100. The F ree Press, Monticello, IL, 1955. 28. M. P alu ˇ s and M. V ejmelk a. Directionality of coupling from biv ariate time series: Ho w to a void false causalities and missed connections. Physic al R eview E , 75(5):0562 11, 2007. 29. L. Paninski. Estimation of entropy and mutual information. Neur al Computation , 15:1191 –1253, 2003. 30. A. Pa pana and D. Kugiumtzis. Detection of d irectionality of information t ransfer in nonlinear dynamical systems. In C. H . S k iadas, I. D imotik alis, and C. Skiadas, editors, T opi cs on Chaotic Syste ms, Sele cte d Pap ers fr om C H AOS 2008 International Confer- enc e , pages 251–266. W orld Scientific, 2009. 31. A. P apana, D. Kugiumtzis, and P . G. Larsson. Reducing the bias of causality measures. Physic al R eview E , 83:036207, 2011. 32. A. P apana, D. Kugium tzis, and P . G. Larsso n. Detection of direct causal effects and application in the analysis of electroencephalograms from patients with epilepsy . I nter- national Journal of Bif ur c ation and Chaos , 22(9):1250222, 2012. 33. A. Papana, C. Kyrtsou, D. Kugiumtzis, and C. Diks. P artial symbolic transfer entrop y . manuscri pt. 34. J. A. Pardo. Some aplications of th e useful mutual information. Applie d Math ematics and Computation , 72:33–5 0, 1995. 35. B. P omp e and J. Runge. Momentary information transfer as a coup ling measure of time series. Physic al R eview E , 83:051 122, 2011. 36. R. Quian Quiroga, A. Krasko v , T. Kreuz, and P . Grassberger. Performance of d ifferent synchronizatio n measures in real data: A case stud y on electroencephalographic signals. Physic al R eview E , 65(4):041903, 2002. 37. M.G. Rosenblum and A.S. Piko vski. Detecting direction of coupling in interacting os- cillators. Physic al R eview E , 64(4):04520 2, 2001. 38. M. S. R oulston. Estimating the errors on measured en tropy and mutual informati on. Physic a D , 125:285–29 4, 19 99. 39. J. Runge, J. Heitzig, V. Petoukho v, and J. Kurt hs. Escaping the curse of dimensionality in estimating multiv ariate transfer entropy . Physic al R eview L etters , 108(25):258701, 2012. 40. S.J. Schiff, P . So, T. C hang, R.E. Burke, and T. Sauer. D etecting d ynamical interde- p endence and generalized syn chron y through m utual prediction in a neu ral ensemble. Physic al R eview E , 54:6708–6724 , 1996. 41. T. Schreib er. Measuring information transfer. Physic al R eview L etters , 85(2):461– 464, 2000. 42. T. Sc h ¨ urmann. Bias analysis in entrop y estimation. Journal of Physics A: Mathematic al and Gener al , 37(27):L295–L301 , 20 04. Will b e inserted by t h e editor 21 43. D. W. Scott and S . R. Sain. Multidimensional density estimation. In C. R. R ao, E. J. W egman, and J. L. Solka , editors, Data Mining and Data Visualization , volume 24 of Handb o ok of Statistics , pages 229–261. Elsevier, 2005. 44. M. Staniek and K. Lehnertz. Sym b olic transfer entrop y . Physic al R eview L etters , 100(15):15 8101, 2008. 45. G. Sugihara, R . Ma y , H. Y e, C. Hsieh, E. Deyle, M. F ogarty , and S. Munch. Detecting causalit y in complex ecosystems. Scienc e , 338(6106):496– 500, 201 2. 46. J. Sun, Z. Li, and S. T ong. Inferring functional neu ral connectivity with phase synchro- nization analysis: A review of metho dology . Computational and Mathematic al Metho ds in M e dicine , 2012:23921 0, 20 12. 47. J. Theiler and S. Eubank. Don’t bleach chao tic data. Chaos , 3(4):771–782, 1993. 48. V. A. V ako rin, O. A . Krako v sk a, and A. R . McIntosh. Confounding effects of ind irect connections on causalit y estimation. Journal of Neur oscienc e Metho ds , 184:152– 160, 2009. 49. M. Vinc k, F. P . Battagl ia, V. B. Bala kirsky , A. J. H. V inc k, and C. M. A. P ennartz. Estimation of th e entrop y based on its p olynomial represen t ation. Physic al R eview E , 85:0511 39, 2012. 50. I. Vlachos and D. Kugiumtzis. Non-u niform state space reconstruction and coupling detection. Physic al R eview E , 82:01620 7, 2010. 51. G.-H. Y u and C.-C. Huang. A d istribution free plotting p osition. Sto chastic Envir on- mental R ese ar ch and Risk Assessment , 15:462–476, 2001. 52. M. Zanin, P . Sousa, D . Papo, R. Ba jo, J. Garc ´ ıa-Prieto, F. Pozo, E. Menasalv as, and S. Bo ccaletti. Optimizing functional n etw ork representatio n of multiv ariate time series. Scientific Re p orts , 2:630, 2012.
Original Paper
Loading high-quality paper...
Comments & Academic Discussion
Loading comments...
Leave a Comment