Brain Network Analysis: Separating Cost from Topology using Cost-integration
A statistically principled way of conducting weighted network analysis is still lacking. Comparison of different populations of weighted networks is hard because topology is inherently dependent on wiring cost, where cost is defined as the number of …
Authors: Cedric E. Ginestet, Thomas E. Nichols, Ed T. Bullmore
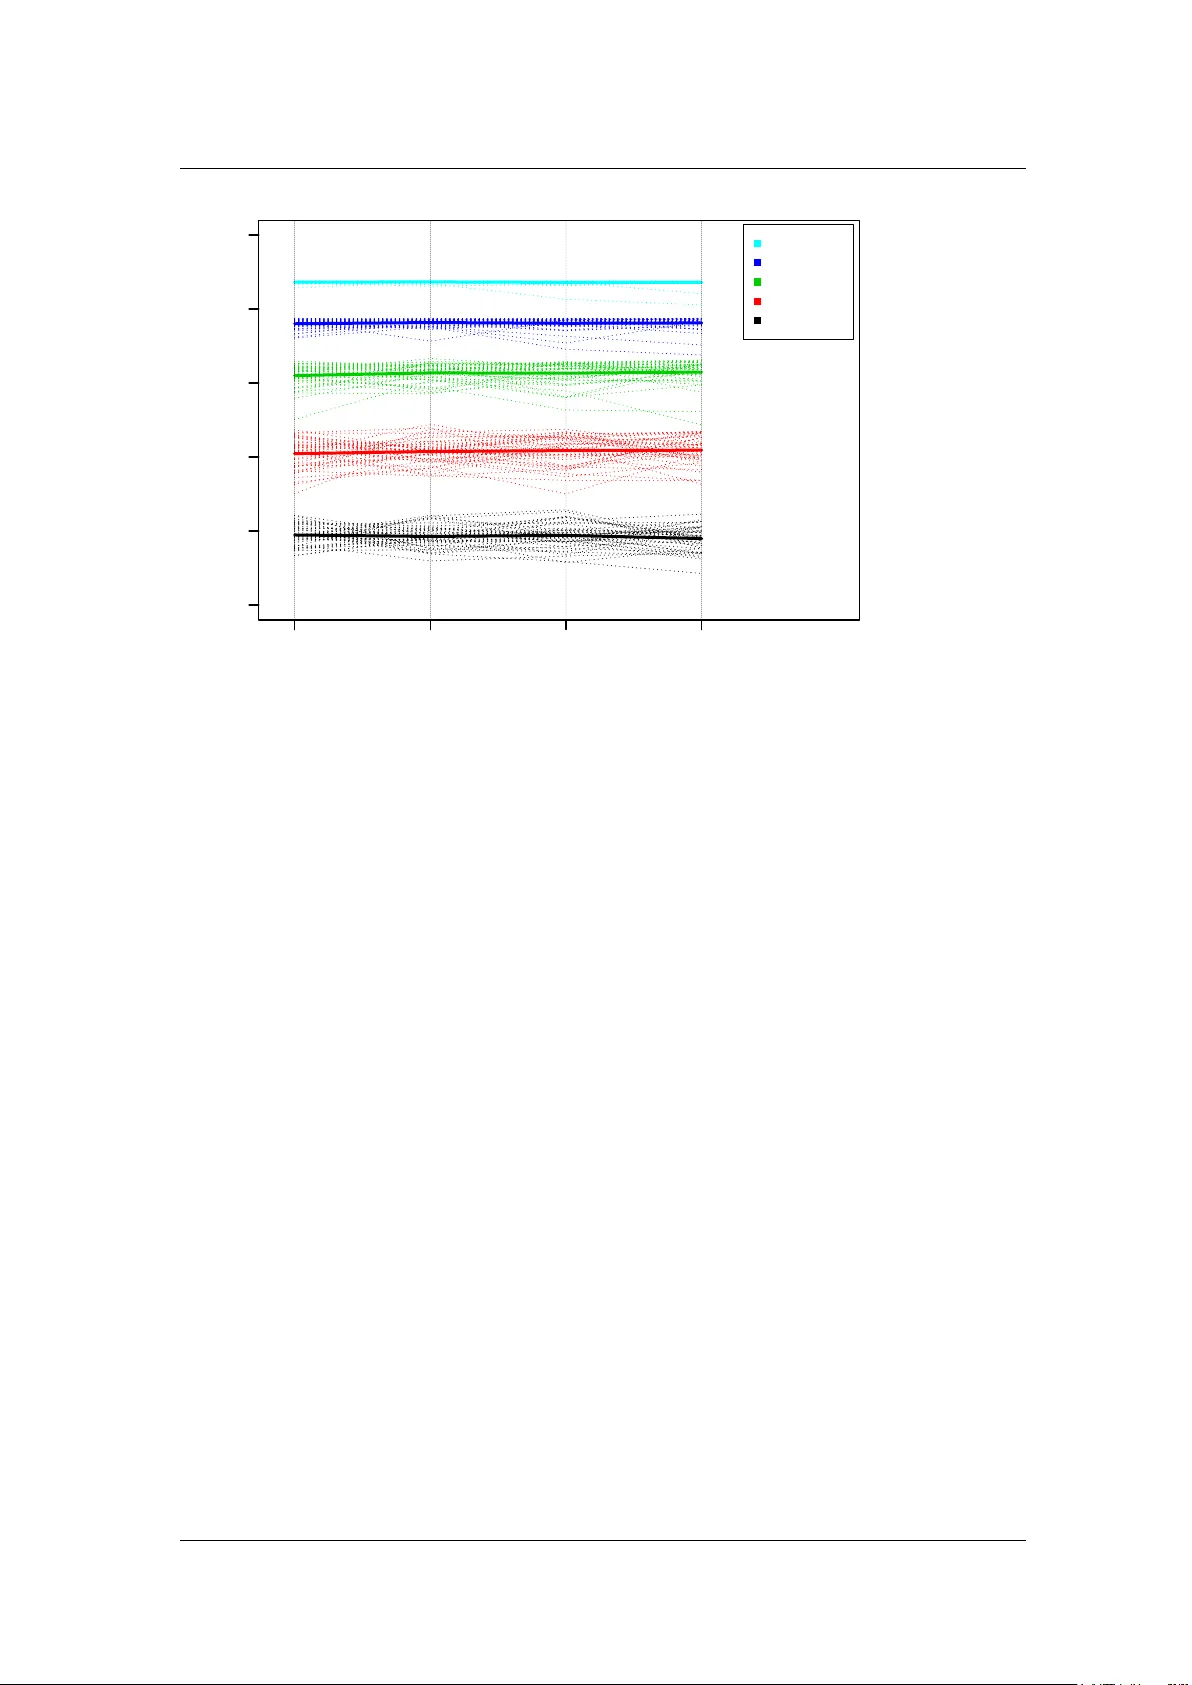
W eigh ted Net w ork Analysis Running Head: WEIGHTED NETW ORK ANAL YSIS W eigh ted Net w ork Analysis: Separating Cost from T op ology using Cost-in tegration. Cedric E. Ginestet ab , Thomas E. Nic hols c , Ed T. Bullmore d and Andrew Simmons ab a King’s College London, Institute of Psyc hiatry , Departmen t of Neuroimaging b National Institute of Health Researc h (NIHR) Biomedical Research Cen tre for Men tal Health at South London and King’s College London Institute of Psychiatry c Departmen t of Statistics, Univ ersit y of W arwic k, Cov en try . d Brain Mapping Unit, Departmen t of Psyc hiatry , Sc ho ol of Clinical Medicine, Univ ersit y of Cam bridge. Corresp ondence concerning this article should be sent to Cedric Ginestet at the Cen tre for Neuroimaging Sciences, NIHR Biomedical Researc h Cen tre, Institute of Psyc hiatry , Box P089, King’s College London, De Crespign y Park, London, SE5 8AF, UK. Email may b e sent to cedric.ginestet@kcl.ac.uk Ginestet, Nic hols, Bullmore and Simmons 1 W eigh ted Net w ork Analysis Abstract A statistically principled w a y of conducting w eigh ted net w ork analysis is still lacking. Comparison of differen t p opulations of weigh ted net w orks is hard b ecause top ology is inher- en tly dep enden t on wiring cost, where cost is defined as the n um ber of edges in an unw eigh ted graph. In this pap er, we ev aluate the b enefits and limitations asso ciated with using cost- in tegrated top ological metrics. Our fo cus is on comparing populations of weigh ted undirected graphs using global efficiency . W e ev aluate differen t approac hes to the comparison of w eighted net works that differ in mean asso ciation w eight. Our key result shows that integrating ov er cost is equiv alen t to controlling for any monotonic transformation of the weigh t set of a w eighted graph. That is, when integrating ov er cost, we eliminate the differences in topology that may b e due to a monotonic transformation of the weigh t set. Our result holds for any un weigh ted topological measure. Cost-integration is therefore helpful in disentangling differ- ences in cost from differences in top ology . By con trast, w e sho w that the use of the w eigh ted v ersion of a top ological metric do es not constitute a v alid approac h to this problem. Indeed, w e prov e that, under mild conditions, the use of the weigh ted version of global efficiency is equiv alen t to simply comparing weigh ted costs. Th us, we recommend the reporting of (i) differences in weigh ted costs and (ii) differences in cost-integrated top ological measures. W e demonstrate the application of these techniques in a re-analysis of an fMRI working memory task. W e also provide a Monte Carlo metho d for approximating cost-integrated top ological measures. Finally , w e discuss the limitations of in tegrating topology ov er cost, whic h ma y pose problems when some weigh ts are zero, when multiplicities exist in the ranks of the weigh ts, and when one exp ects subtle cost-dep endent top ological differences, which could b e masked b y cost-integration. KEYW ORDS: Connectivity , Correlation matrix, Cost-integration, Global Efficiency , Monte Carlo in tegration, Net w orks, Small-w orld. 1 In tro duction In the last decade, the biological and physical sciences ha ve witnessed a proliferation of publications adopting a net work approac h to a wide range of questions. This interest in net works w as originally stim ulated by the seminal works of W atts and Strogatz (1998) and Barabasi and Alb ert (1999), who introduced the concepts of small-world and scale-free netw orks, resp ectively . Some of these ideas ha ve b een adopted in neuroscience at b oth a theoretical (Sp orns et al., 2000, 2004) and exp erimen tal level (Eguiluz et al., 2005). Most of the research in this area has attempted to classify the top ology of brain netw orks based on anatomical or functional data (see, for example, Ac hard et al., 2006, Ac hard and Bullmore, 2007, He et al., 2007). A question that naturally arises from such applications of graph theory is whether or not the top ological prop erties of these brain netw orks are stable across differen t p opulations of sub jects or across different cognitive and b ehavioral tasks. A common hypothesis that neuroscientists ma y wish to test is whether the small-w orld prop erties of a given brain net work are conserved when comparing patien ts and health y controls. Bassett et al. (2008), for example, hav e studied differences in anatomical brain netw orks betw een health y con trols and patients with sc hizophrenia. Other authors hav e ev aluated whether the top ological prop erties of functional netw orks v ary with differen t b ehavioral tasks (v an den Heuvel et al., 2009, De Vico F allani et al., 2008, Cecchi et al., 2007, Astolfi et al., 2009). The prop erties of brain netw ork top ology hav e also b een studied at differen t spatial scales (Bassett et al., 2006) and using different mo dalities, suc h as EEG (P achou et al., 2008, Salv ador et al., 2008), and fMRI (Ac hard et al., 2006, Achard and Bullmore, 2007). There is therefore considerable in terest in comparing p opulations of netw orks –which ma y represent differen t groups of sub jects, several conditions of an exp erimen t, or the use of different levels of spatial or temp oral resolution. W e note that such research questions are more lik ely to arise when sub ject-sp ecific netw orks can b e directly constructed. This has b een done in the context of b oth functional and structural MRI (Hagmann et al., 2008, Gong et al., 2009). The p ossibilit y of conducting rigorous statistical comparison of sev eral populations of net w orks, ho w ev er, has been hindered by a series of metho dological issues, which ha ve not been hitherto sat- isfactorily resolv ed. When considering the question of comparing sev eral p opulations of net w orks, Ginestet, Nic hols, Bullmore and Simmons 2 W eigh ted Net w ork Analysis (a) (b) Figure 1. How can one disen tangle differences in connectivity strength from differences in top ology? In panel (a), tw o correlation matrices for tw o w eighted netw orks differ in their a verage correlation strengths. In panel (b), the same correlation matrices hav e b een thresholded at the same v alue, pro ducing graphs with different cost levels. In all matrices, black indicates n ull v alues, and white denotes entries equal to unit y . t w o main problems arise. Firstly , we are faced with the inherent intert wining of connectivity strength (i.e. wiring cost) with netw ork top ology . Most top ological metrics used to compare net- w orks are sensitive to differences in these graphs’ num b er of edges. Drawing comparisons on the sole basis of top ology therefore requires some lev el of control of cost discrepancies b etw een these net work p opulations. Secondly , this issue is comp ounded by the fundamental division b e- t w een weigh ted and unw eigh ted graphs. The problem of disentangling differences in connectivity strength from topological differences therefore needs to be resolv ed in a distinct manner dep ending on whether weigh ted or unw eighted graphs are b eing considered. The fo cus, in this pap er, will b e on weigh ted netw orks since these are more likely to be found in the biomedical sciences than their un w eigh ted coun terparts. Historically , how ever, netw ork analyses hav e concen trated on unw eighted graphs. The applica- tion of graph theory to biological and artificial netw orks was originally motiv ated b y the discrete nature of the problems of interest. Both W atts and Strogatz (1998) and Barabasi and Alb ert (1999) mainly considered binary relations b et ween sets of elements, which readily pro duced ad- jacency matrices that could then b e used to construct unw eighted graphs. W atts and Strogatz (1998) matc hed some netw orks of in terest with their random and regular equiv alents. In their case, the matching pro cedure ensured that b oth random and regular netw orks p ossessed the same total n um b er of nodes and edges as the original graph. Current practice in MRI-based neuroscience and other biomedical applications, ho w ever, tends to pro duce weighte d connectivity net works. This is b ecause MRI data take v alues on a contin uous scale, which lends itself to the application of real- v alued measures of association, such as the correlation coefficient or the sync hronization likelihoo d among others. While differen t p opulations of unw eighted netw orks can readily b e compared b y matc hing eac h netw ork with a random netw ork p ossessing an identical num b er of edges; there is, as y et, no consensus on how to compare p opulations of weigh ted netw orks in a systematic manner. This problem can b e illustrated with a straightforw ard example. In panel (a) of Figure 1, a pair of weigh ted net w orks are represen ted by their correlation matrices. W e are in terested in comparing the top ology of the corresp onding weigh ted graphs. Since these net works differ in their mean correlation co efficients, a simple thresholding of these matrices will pro duce graphs of Ginestet, Nic hols, Bullmore and Simmons 3 W eigh ted Net w ork Analysis differen t levels of cost. Naturally , this is only one of the different thresholding approaches that could b e adopted. This non-uniqueness arises since graph top ology is expressed in the language of discrete mathematics, whereas correlation coefficients are real-v alued functions. That is, one cannot directly adopt concepts originally developed for unw eighted graphs for the analysis of w eigh ted graphs. In this pap er, w e consider t w o main approaches to the problem of weigh ted netw ork comparison. Firstly , following other authors, w e ev aluate the use of w eighted top ological metrics, which are w eigh ted equiv alents of graph-theoretical metrics for unw eighted net works (Latora and Marc hiori, 2001, Rubinov and Sporns, 2010). Secondly , w e consider the utilization of cost-integrated measures of top ology , where all the possible wiring costs of a net work are tak en in to accoun t. When un w eigh ted, a graph’s wiring cost is defined as its num b er of edges. Integrating o v er wiring cost can here b e in terpreted in statistical terms, as an analog to the Bay esian integration of n uisance parameters. Doing so, we are av eraging out the ‘uncertain ty’ in the choice of a particular lev el of cost. This second family of measures has probably b een the most p opular to date in the neuroscientific literature (see Achard et al., 2006, He et al., 2009b, for instance). How ever, differen t authors hav e chosen different in tegration interv als. W e therefore explore the consequences of in tegrating a top ological metric with resp ect to different subsets of the cost interv al. Note that our approach substantially differs from the one adopted by v an Wijk et al. (2010), who prop osed several formulas relating cost levels and top ological measures, such as the c harac- teristic path length or the clustering co efficient. Instead, in this paper, we are concerned with formally deriving what is the effect of integrating a particular top ological measures ov er cost lev els, in order to assess whether this is a successful manner of disen tangling differences in cost from differences in top ology . In particular, although v an Wijk et al. (2010) reviews several wa ys of controlling for differences in cost, they do not consider cost-integration, p er se. This pap er can therefore b e seen as a contribution to the literature on weigh ted netw ork analysis, where we formally clarify the utilization of cost-in tegration when comparing top ological metrics. The concept of top ology in the context of this pap er will b e defined in a quantitativ e manner. This should b e con trasted with the qualitative definition adopted by previous authors. v an Wijk et al. (2010), for instance, assume that netw orks that represent different realizations of the same ‘generativ e mo del’ should b e regarded as top ologically identical. Sev eral realizations from an Erd¨ os-R ´ en yi mo del with fixed edge probabilit y , for example, share a common generativ e model and therefore can b e said to ha ve an identical top ology . In practice, how ever, suc h a generative mo del is unknown. Th us, we will refer to this type of classification as a top ological taxon. A taxonony of commonly encountered netw orks may include the random top ology of the Erd¨ os-R´ enyi mo del, the regular lattice and the small-world topology among others. Such a nomenclature is qualitative b ecause it relies on discrete categories. By contrast, w e wish to adopt a quantitativ e p ersp ective on this problem, whereby top ology is op erationalized in terms of sp ecific top ological prop erties suc h as the clustering co efficient (CC), for instance. In this p ersp ectiv e, t w o Erd¨ os-R´ enyi mo dels with identical edge probabilit y may displa y different levels of global and lo cal efficiencies and will therefore b e considered to hav e distinct top ological prop erties. Therefore, w e distinguish b et ween a qualitativ e approach based on top ological taxonony and a quan titative approac h based on top ological prop erties. Given that generativ e mo dels are latent, our quantitativ e definition of top ology app ears b etter suited to the empirical study and comparison of complex netw orks. The ab o ve definition of netw ork top ology , how ev er, assumes that the netw orks under com- parison hav e identical num b ers of vertices and edges. When this is not the case, or when one is comparing t w o p opulations of weigh ted netw orks, the question of whether or not these netw orks ha v e similar topological prop erties b ecome arduous. Our main aim, in this pap er, is therefore to identify the situations within which one can safely conclude that different weigh ted netw orks share the same top ological prop erties. In particular, we explore whether cost-integration answers this problem. Sp ecifically , w e consider whether cost-integration is a useful wa y of disentangling w eigh ted cost from top ology . The pap er is organized as follows. W e first introduce, in section 2, some of the notation and basic concepts that will b e used throughout the pap er. In section 3, we describ e the tw o general families of top ological measures for weigh ted netw orks, which are (i) the weigh ted and (ii) cost- Ginestet, Nic hols, Bullmore and Simmons 4 W eigh ted Net w ork Analysis in tegrated metrics. These quantities are first defined for a single net work. The main contribution of this pap er is then reported in section 4, where differen t approaches to w eigh ted netw ork comparison are outlined, using theoretical results and simple examples. Section 5 describ es an application of these tec hniques to a repeated measures fMRI task in v estigating w orking memory . This also allows us to illustrate a Monte Carlo (MC) sampling scheme to appro ximate the differen t measures of in terest. In section 6, we discuss the findings of this pap er in light of the current utilization of net w orks in the biomedical sciences. Finally , we close with a set of recommendations on how to conduct w eigh ted netw ork analysis in practice and ho w to rep ort the findings arising from this type of research. An R pack age entitled Net workAnalysis ( http://CRAN.R- project.org/ package=NetworkAnalysis ) has b een developed that makes av ailable the metho ds discussed in this pap er. 2 Net w ork T yp es and T op ologies 2.1 Un weigh ted, W eighted and F ully W eighted Netw orks F or clarity of exp osition and consistency with the previous literature, w e will here employ the no- tation used by Kolaczyk (2009). A comprehensive in tro duction to the theory of complex net w orks can b e found in Newman (2010). In the follo wing, the terms metrics and measures will b e used in terc hangeably to refer to a function quantifying the top ological structure of a net w ork. Our use of the terms metric and measure is unrelated to the mathematical definitions of these con- cepts in top ology and measure theory , resp ectively . Similarly , we here utilize the graph-theoretical definition of the term c ost , which is not related to its use in a probabilistic setting. An unw eighted undirected graph or netw ork G is formally defined as an ordered pair ( V , E ), where V is a set of vertices, p oints or no des, and E is a set of edges or connections linking pairs of no des. Therefore E ⊆ V ⊗ V , where ⊗ is the Cartesian product. The cardinality –i.e. the n um b er of elemen ts– of V and E will b e referred to as N V := |V | and N E := |E | , resp ectively , where | · | denotes the num b er of elemen ts in a set, and := that the left-hand-side is defined as the righ t-hand-side. Moreov er, the terms netw ork and graph will b e used interc hangeably . A graph with the maximal num b er of edges is referred to as a complete or saturated graph. F or a given net w ork G , we denote the corresp onding saturated graph as G Sat . The cardinality of the edge set of G Sat is denoted by N I to distinguish it from N E . Here, the set I ( G ), for any graph G is the set of indices of all p ossible edges in G . That is, I ( G ) := { ( i, j ) : 1 ≤ i < j ≤ N V } . (1) This notation for the set of indices of all p ossible edges in G will b e useful when describing the top ology of G based on its shortest paths. W eigh ted undirected graphs will b e denoted b y the triple G := ( V , E , W ), where W ( G ) is a set of w eigh ts, whose elemen ts are indexed by the en tries in E ( G ), such that w e i = w v j v h , (2) for some edge e i := v j v h . Th us, ev ery w eigh ted undirected graph will necessarily satisfy N E = N W ≤ N I , (3) where N W := |W ( G ) | . The weigh t set p opulates a symmetric matrix W , whose diagonal elements are null. Graphs that satisfy N W = N I will b e referred to as ful ly weighte d gr aphs . Note that, in general, we will not draw an explicit difference betw een a w eigh ted and an unw eighted netw ork through our notation. How ever, which one w e are referring to should b e understandable from the con text. There are a wide range of different w eighted measures of internodal asso ciation. Our metho d- ological developmen t, in this pap er, applies to any choice of asso ciation metric. This includes Ginestet, Nic hols, Bullmore and Simmons 5 W eigh ted Net w ork Analysis correlation co efficients, partial correlations, synchronization likelihoo ds and others. F or simplic- it y , we will assume that the asso ciation weigh ts w ij ’s lie in the unit interv al, [0 , 1]. Roughly , these standardized weigh ts, w ij , can b e interpreted as the strength of the asso ciation b et w een no des i and j , with larger v alues indicating a greater level of asso ciation. Suc h standardization can b e obtained straightforw ardly , in practice. F or the case of the Pearson’s correlation co efficient r ij , for example, the standardized w eigh ts can b e defined as, w ij := 1 − 1 − r ij 2 . (4) Note that the use of such a standardization of correlation coefficients p otentially leads to t wo ma jor pitfalls. Firstly , since negative correlations are transformed into p ositive measures of asso ciation, it follows that w e are amalgamating differen t subsets of edges, whic h may pla y very different roles. That is, while subnetw orks of negatively correlated v ertices may reflect inhibitory pro cesses, subnet w orks of p ositively correlated v ertices ma y reflect excitatory pro cesses. Secondly , since pairs of vertices link ed by a small amount of correlation, either p ositive or negative, will b e transformed to take a v alue close to 0 . 5; it follows that w e ma y b e introducing a spurious amount of random noise in such a weigh ted net work analysis, as correlation co efficien ts close to zero are likely to b e non-significan t. Our approach to w eighted netw ork analysis in this pap er, ho w ever, centres on thresholding the w eigh ted netw orks of interest and therefore do es not explicitly take into account the direction of the asso ciation. Moreov er, our fo cus will b e on fully w eigh ted netw orks, such as a standardized correlation matrix, where all entries are greater than 0. Therefore, in the sequel, G will refer to a fully w eigh ted graph, except when sp ecified otherwise. W e will discuss the use and limitations of cost-in tegration for non-fully w eigh ted graphs in the discussion. 2.2 Classical Measures of Netw ork T op ology A wide range of netw ork topological metrics hav e b een prop osed in the literature (see Rubinov and Sp orns, 2010, for a review). Two types of measures are generally of interest, whic h are sometimes referred to as (i) integration metrics and (ii) sp ecialization metrics. The former category of top ological measures quantifies a netw ork’s capacity to transfer information globally , whereas the latter reflects a netw ork’s capacity to transfer information lo cally . This distinction originated with the w ork of W atts and Strogatz (1998), who considered the characteristic path length (CPL), on one hand, and the clustering co efficient (CC), on the other hand, as measures of global and lo cal information transfer, resp ectively . Although these metrics hav e b een successfully used in a wide range of settings, Latora and Marchiori (2001) hav e introduced t wo analog metrics: the global and lo cal efficiencies, which will b e more useful in our context. These t w o measures retain the interpretation of the CPL and CC, while b eing applicable to a wider range of netw orks. Sp ecifically , global and lo cal efficiency metrics can b e computed for an y netw ork, irresp ective of their level of sparsity , which is not true for CPL and CC. (That is, CPL b ecomes infinite when a graph is disconnected and CC b ecomes undefined when a vertex has no neighbors –that is, when a no de is isolated.) Throughout this pap er, and following other authors (Achard and Bullmore, 2007), we will therefore fo cus on the comparison of families of netw orks, whose top ologies are c haracterized b y efficiency metrics. One of the remark able aspects of global and local efficiencies is that they can both be subsumed under the general concept of information transfer efficiency , which is defined for any unw eighted graph G = ( V , E ) –connected or disconnected– as (Latora and Marchiori, 2001), E ( G ) := 1 N V ( N V − 1) N V X i =1 N V X j 6 = i d − 1 ij = 1 N I X I ( G ) d − 1 ij , (5) where the summation ov er the set I ( G ) is ov er all the pairs of indices ( i, j ) as in equation (1), and d ij denotes the length of the shortest path b et ween vertices i and j in the adjacency matrix of G , with d ij := ∞ when these t wo no des are not connected. The summation ov er j 6 = i includes Ginestet, Nic hols, Bullmore and Simmons 6 W eigh ted Net w ork Analysis all indices b etw een 1 and N V differen t from i . The global and lo cal efficiencies of netw ork G are then readily deriv ed from equation (5), suc h that E Glo ( G ) := E ( G ) , and E Loc ( G ) := 1 N V N V X i =1 E ( G i ) , (6) where G i is the subgraph of G that includes all the neigh b ors of the i th no de. That is, V ( G i ) := { v j ∈ G | v j ∼ v i } , where v j ∼ v i signifies that nodes i and j are connected. By con ven tion, we ha ve v i / ∈ V ( G i ) (see Latora and Marchiori, 2001, 2003). Note that b oth global and lo cal efficiencies are normalized quantities with v alues in the unit interv al –that is E ( G ) ∈ [0 , 1]. The global efficiency of a graph G can b e in terpreted as the av erage ‘sp eed’ of information transfer b etw een an y pair of no des in G , with a high v alue of E Glo ( G ) indicating a high av erage ‘sp eed’, and therefore efficient information transfer. Similarly , the lo cal efficiency of a graph G can b e interpreted as the av erage global efficiency of the N V subgraphs of G , where again a high v alue for E Loc ( G ) implies efficient lo cal information transfer, on av erage. W e hav e used E ( G ) to denote the efficiency metric of the unw eigh ted graph G . This should b e distinguished from the graph-theoretical concept of the edge set, which we hav e denoted E ( G ). Since b oth quan tities are functions of G , we hav e emphasized this distinction through our notation. Note also that w e will make use of the exp ectation op erator from probability theory , which will b e denoted b y E [ · ]. F or simplicity , all our dev elopment, examples and technical results will b e based on the general efficiency described in equation (5). How ever, these methods could readily b e extended to b oth global and lo cal efficiencies. In fact, most our discussion applies to all topological metrics that can b e computed for any level of sparsity . W e will discuss the generalization of our results to other top ological measures in section 6. 2.3 Cost and W eigh ted Cost In net work analysis, it is often of in terest to quantify the cost or wiring cost of an un weigh ted graph. In this section, we extend this concept to weigh ted netw orks. This generalized version of cost will b e termed the w eigh ted cost or w eigh ted densit y . The cost or densit y , K := K ( G ), of an unw eighted net w ork G = ( V , E ) quantifies the relative n um b er of connections in G as a prop ortion of the num b er of edges contained in the N V -matc hed saturated net w ork G Sat . That is, K ( G ) := |E ( G ) | |E ( G Sat ) | = N E N I , (7) where N I := N V ( N V − 1) / 2. The computation of the cost of a netw ork G implicitly refers to the adjacency matrix A of that netw ork. Hence, we can reform ulate the definition in equation (7) by explicitly using A as follo ws, K ( G ) = P N V i =1 P N V j 6 = i a ij P N V i =1 P N V j 6 = i a Sat ij = 1 N I X I ( G ) a ij , (8) where the a Sat ij ’s denote the elements of the adjacency matrix A Sat , which represents a saturated net w ork on N V no des. Similarly , it will be of in terest to quan tify the cost of a w eigh ted net work, whic h will be referred to as K W ( G ). W e define it by generalizing the relationship b etw een an unw eighted graph and its adjacency matrix in order to apply it to weigh ted graphs and their asso ciation matrices. How ever, to extend the concept of cost to a real-v alued asso ciation matrix, sa y W , we need to formalize what we mean b y a satur ate d weighte d gr aph . A natural c hoice is to define W Sat as a matrix of order ( N V × N V ) with unit en tries. F ormally , W Sat := 1 ( N V × N V ) . Using this saturated asso ciation matrix, w e can no w define the cost of a weigh ted graph as follo ws, K W ( G ) := P N V i =1 P N V j 6 = i w ij P N V i =1 P N V j 6 = i w Sat ij = 1 N I X I ( G ) w ij , (9) Ginestet, Nic hols, Bullmore and Simmons 7 W eigh ted Net w ork Analysis where w Sat ij ’s are the elemen ts of W Sat . The non-standardized version of the cost of a w eigh ted net w ork in equation (9) was introduced by De Vico F allani et al. (2008). Thus, the weigh ted cost of G = ( V , E , W ) is the mean of the off-diagonal elements in W , p opulated by the set W . This is reminiscen t of our starting p oint in equation (7), where the same observ ation can b e made ab out un w eigh ted net w orks. In the sequel, the concept of w eighted cost will b e used interc hangeably with the phrase c onne ctivity str ength . Note that dep ending up on which standardization one chooses, one may obtain different types of w eigh ted costs. In particular, K W could also b e standardized with resp ect to the num b er of elemen ts in W . This w ould pro duce a different measure. In this pap er, w e will assume that the net works under consideration are fully weigh ted, suc h that N E = N W = N I , and therefore these t w o t yp es of w eigh ted costs are equiv alen t. 3 Measures of W eigh ted Netw ork T op ology There is currently no guidance in the literature on ho w to quantify the top ological asp ects of a w eigh ted netw ork. W e review here tw o approac hes to this problem: (i) weigh ted, and (ii) cost- in tegrated metrics of net w ork top ology . W e describ e and define these tw o families of measures, in turn. 3.1 W eighted Measures A natural approach to the problem of quantifying the topology of w eighted netw orks is to translate un w eigh ted measures, suc h as efficiency metrics, for example, in to a weigh ted format. This is a v ery general pro cedure, which has b een introduced by several authors including Latora and Marchiori (2001) and Rubinov and Sp orns (2010). W eighted v ersions of classical metrics commonly rely on the definition of a weigh ted shortest path. F or un weigh ted netw orks, the shortest path d ij b et ween no des i and j in G = ( V , E ) is defined as the following minimization, d ij := min P kl ∈P ij ( G ) |E ( P kl ) | , (10) where P ij ( G ) is the set of all paths b etw een no des i and j that are subgraphs of G . A subgraph P ij ⊆ G is a path if and only if i, j ∈ V ( P ij ) suc h that E ( P ij ) = { ia, ab, . . . , y z , z j } , (11) where each pair of letters stands for an edge. One can similarly define a weighte d shortest p ath , d W ij , for some w eigh ted graph G = ( V , E , W ) as follo ws, d W ij := min P kl ∈P ij ( G ) X uv ∈E ( P kl ) f ( w uv ) , (12) where the w eigh ted edge set of a path now tak es the form, W ( P ij ) = { w ia , w ab , . . . , w y z , w z i } , (13) using the notational conv ention in tro duced in equation (2). Since we ha ve normalized the asso cia- tion w eights, w ij ’s, the real-v alued function f ( · ) is restricted to a map of the form f : [0 , 1] 7→ [0 , 1]. A con venien t choice of f ( · ) is the in v erse function, f ( w ij ) := 1 /w ij . It now suffices to use our c hosen definition of the weigh ted shortest path d W ij , in order to obtain a weigh ted version of the general efficiency metric in equation (5), whic h gives E W ( G ) := 1 N V ( N V − 1) N V X i =1 N V X j 6 = i 1 d W ij = 1 N I X I ( G ) 1 d W ij . (14) Note that weigh ted efficiency is not necessarily b ounded b etw een 0 and 1. Here, we ha v e d W ij ∈ [min( w ij ) , ∞ ], regardless of whether or not the w ij ’s hav e b een standardized. The case d ij := ∞ Ginestet, Nic hols, Bullmore and Simmons 8 W eigh ted Net w ork Analysis ma y occur when there do es not exist a path betw een i and j . How ever, since we ha ve restricted the scop e of this pap er to fully w eigh ted matrices, where w ij ∈ (0 , 1) holds for every pair of indices, it follo ws that E W ∈ R + := (0 , ∞ ). 3.2 Cost-in tegrated Measures A second approach to the problem of quantifying the top ology of w eigh ted netw orks pro ceeds b y integrating the metric of interest with resp ect to cost. Here, some authors ha ve integrated o v er a subset of the cost range (see Achard and Bullmore, 2007, for example), whereas others ha v e in tegrated ov er the entire cost domain (He et al., 2009a). This second family of metrics will b e referred to as cost-integrated measures. Given a weigh ted graph G = ( V , E , W ), the general efficiency of equation (5) can b e defined as follo ws, E K ( G ) := Z Ω K ( G ) E ( γ ( G, k )) p ( k ) dk , (15) where cost is treated as a discrete random v ariable K , with realizations in lo w er case, and p ( k ) denotes the probability density function of K . Since K is discrete, it can only take a countably finite n um b er of v alues, which is the following set, Ω K := 1 N I , 2 N I , . . . , N I − 2 N I , N I − 1 N I , 1 . 0 =: k , (16) where, as b efore, N I := N V ( N V − 1) / 2 = | Ω K | . It will b e useful to treat Ω K as an ordered set, k , whose elemen ts, k t ’s, are arranged in increasing order and indexed b y t = 1 , . . . , N I . The function γ ( G, k ) in equation (15) is a thresholding function, which tak es a weigh ted undi- rected netw ork and a level of wiring cost as argumen ts, and returns an unweighte d netw ork. W e defer a full discussion of γ to App endix A, where we describ e its definition in more detail. This function is based on the p ercentile ranks of the elements of W , where tied ranks are resolv ed b y assigning the corresp onding ordering of the elements’ indices. Since there is no prior knowledge ab out whic h v alues of K should be fa vored, w e specify a uniform distribution o ver Ω K . In equation (16), we hav e excluded the null cost for standardization purp oses. Since any edge-based top ology of interest will b e zero when K = 0, this particular v alue is irrelev ant when comparing different p opulations of netw orks. In example 3, we will also see that this exclusion of the p oint mass at K = 0 ensures a more satisfying standardization of E K ( G ). Since K is treated as a discrete random v ariable, w e can define its probabilit y mass function. As no particular cost lev els are fa vored, K is given a discrete uniform distribution, such that K ∼ DisUnif (Ω K ) , (17) where each elemen t of Ω K has an iden tical probability of o ccurrence, which, in our case, is equiv- alen t to p ( k ) = 1 | Ω K | = 1 N I , (18) for every k ∈ Ω K . The theoretical integration in equation (15) is therefore a weigh ted summation o v er a finite set of atoms (see Billingsley, 1995), and may b e computed as follo ws, E K ( G ) = N I X t =1 E ( γ ( G, k t )) p ( k t ) = 1 N I N I X t =1 E ( γ ( G, k t )) . (19) where the index t runs o v er the elements of Ω K describ ed in (16). More generally , cost-integrated metrics can b e defined with resp ect to a subset of the cost regimen. This p ersp ective on the problem of weigh ted netw ork comparison has b een utilized by sev eral authors (Eguiluz et al., 2005, Achard and Bullmore, 2007, Sup ek ar et al., 2009). In our Ginestet, Nic hols, Bullmore and Simmons 9 W eigh ted Net w ork Analysis notation, a subset of the cost levels will b e indicated by an interv al of the form [ k − , k + ] ⊆ Ω K , whic h refers to a finite num b er of v alues of K , satisfying k − ≤ k ≤ k + . Integration ov er that subset is then defined as E [ k − ,k + ] ( G ) = Z [ k − ,k + ] E ( γ ( G, k )) p ( k | k − , k + ) dk , (20) where the probability mass function on K is normalized with resp ect to the chosen domain of in tegration [ k − , k + ], such that p ( k | k − , k + ) = 1 / ( N I k + − N I k − + 1), for every k in that interv al. The computational form ula for this generalization of equation (19) is then given b y E [ k − ,k + ] ( G ) = 1 N I k + − N I k − + 1 N I k + X t = N I k − E ( γ ( G, k t )) , (21) whic h follows from N I k l = l , using the definition of cost in equation (7). Note that the v alue of the conditional probability p ( k | k − , k + ) will b e different if semi-op en in terv als such as ( k − , k + ] are considered, instead of closed ones. This is due to the fact that the interv al of interest is ov er a set of discrete v alues, as opp osed to a subset of the real line. As a sp ecial case, this notation can also handle the estimation of a particular topological metric at a single cost lev el, say k 0 . In suc h cases, the interv al of interest becomes [ k 0 , k 0 ]. Our notation makes explicit the fact that integration o ver a subset of the full cost regimen, is conditional on the choice of such a subset. Since K has been treated as a random v ariable and b ecause E ( γ ( G, K )) is a function of K , it follows that E ( γ ( G, K )) is also a random v ariable. The integral E K ( G ) can therefore b e seen as the exp ectation of E ( γ ( G, K )) with resp ect to the distribution of K . This probabilistic treatmen t of cost-integrated metrics will b e particularly helpful when considering how to estimate these quantities, as a Monte Carlo (MC) sampling scheme can readily b e devised in order to appro ximate E K ( G ), when the netw ork of interest is to o large to be computed exactly . More details ab out this sampling scheme are given in App endix A. 4 Pros and Cons of In tegrating o ver Cost Lev els W e now turn to the main question tac kled in this pap er: Is it useful to integrate ov er the different cost levels of a particular weigh ted netw ork? In order to answ er this question, we briefly consider some of the alternatives to this approac h. This consists of (i) fixing a cutoff p oin t, (ii) fixing a cost regimen, (iii) in tegrating ov er all cost lev els, and (iv) directly using weigh ted top ological metrics. Our comparison of these four approaches is substan tiated by some simple examples, synthetic data sets, and theoretical results. F or con v enience, we will solely treat the case of tw o w eigh ted net w orks in this section. Extensions of these ideas to the case of several p opulations of netw orks will b e discussed in section 6. 4.1 Fixing a Cutoff Threshold The simplest w a y of comparing the top ology of w eighted net works is to threshold the corresponding asso ciation matrices at a specific v alue, and ev aluate the resulting discrete top ologies. It is instruc- tiv e to study the consequences of such a naiv e thresholding on t wo netw orks with prop ortional asso ciation matrices, as we describ e in the following example. Example 1. Let t wo weigh ted netw orks G 1 = ( V , E , W 1 ) and G 2 = ( V , E , W 2 ), with standardized asso ciation matrices denoted W 1 and W 2 , respectively; suc h that every w ij,k ∈ (0 , 1) where k = 1 , 2 lab els the t w o graphs under scrutin y . In addition, assume that W 1 := α W 2 , (22) where α ∈ (0 , 1) is a scalar. That is, the asso ciation matrix of G 2 is simply prop ortional to that of G 1 . Tw o such asso ciation matrices hav e b een discussed in the introduction and were illustrated Ginestet, Nic hols, Bullmore and Simmons 10 W eigh ted Net w ork Analysis in panel (a) of Figure 1. Note that the relationship in equation (22) implies that the diagonal elemen ts of W 1 are not standardized to 1 . 0. Ho wev er, the top ology and cost of weigh ted netw orks solely dep end on the off-diagonal elements of such asso ciation matrices. Therefore, differences in the diagonal elements do not p ertain to this discussion. In terestingly , it is easy to show that prop ortionalit y in asso ciation matrices implies prop ortionality in weigh ted cost. Using equation (9), w e ha v e K W ( G 2 ) = 1 N I X I ( G 1 ) αw ij, 1 = αK W ( G 1 ) , (23) since α is applied element wise. Therefore, K W ( G 2 ) > K W ( G 1 ) as b y assumption 0 < α < 1. A naiv e approac h to the problem of comparing the top ologies of these tw o netw orks may proceed b y thresholding W 1 and W 2 at a particular v alue, say c ∗ , as was done in the introduction. If w e compare these netw orks in terms of global efficiency , straightforw ard computation of the tw o corresp onding quantities shows that we necessarily hav e E ( κ ( G 2 , c ∗ )) ≥ E ( κ ( G 1 , c ∗ )) , (24) for any c ∗ ∈ [0 , 1], where κ ( G k , c ∗ ) := I { W k > c ∗ } . This follows since G 2 , thresholded at c ∗ has all the edges of κ ( G 1 , c ∗ ), as well as additional links o wing to its w eigh ted cost b eing higher. The relationship in equation (24) is then deduced from the monotonicity of the efficiency function with resp ect to cost. Note that these inequalities w ould hold for both local and global efficiencies, or any other top ological metric, which is a monotonic increasing function of the cost level. Therefore, example 1 has shown that thresholding weigh ted graphs at a fixed cutoff p oin t is misleading, since graphs with higher weigh ted cost will tend to b e classified as having higher levels of global efficiency . This problem can b e remedied by fixing cost levels instead of cutoff p oints. 4.2 Fixing a Cost Level A natural approach to the problem of separating cost from top ology is to choose a particular cost level. This may b e a single v alue or a subset of the cost regimen. Such a strategy has b een adopted by several authors (see Eguiluz et al., 2005, Achard and Bullmore, 2007, Sup ek ar et al., 2009, for examples). One of the original justifications for conditioning ov er a subset of the cost regimen was that top ological metrics suc h as CPL or CC cannot b e computed for disconnected net w orks, thereb y making it impossible to calculate these quan tities for small cost lev els. How ever, since comparable global and lo cal top ological prop erties can also b e measured using the efficiency metrics introduced by Latora and Marchiori (2001), such problems do not arise when using these top ological metrics. W e illustrate the consequences of integrating o ver a subset of the range of K with a real data example, where the original data has b een transformed. W e hav e constructed a pathological case, whic h shows that in tegrating ov er a subset of the cost levels can fail to distinguish b et ween top ologically distinct weigh ted netw orks. Example 2. W e here consider a single functional connectivity matrix W , corresp onding to the mean statistical parametric netw ork (SPN) of a previously published data set, as describ ed in section 5 (Ginestet and Simmons, 2011). The matrix W was transformed in order to pro duce t w o other matrices with either a regular or a hybrid structure, denoted b y W reg := F reg ( W ) and W hyb := F hyb ( W ), resp ectiv ely . The functions F reg and F hyb simply re-organize the p osition of the entries in W , as can b e seen from Figure 2. The choice of these transformations was constrained b y the follo wing prescriptions, γ ( G reg , k 0 ) = γ ( G hyb , k 0 ) and γ ( G reg , k 00 ) = γ ( G hyb , k 00 ) , (25) for cost levels k 0 := 0 . 25 and k 00 := 0 . 75, resp ectiv ely . That is, the adjacency matrices corre- sp onding to costs k 0 and k 00 are identical for W reg and W hyb . The effect of the functions F reg and F hyb w as to create different lay ers of top ological structures that v ary according to wiring cost. The hybrid matrix was comp osed of alternating la yers of random and regular top ologies. Ginestet, Nic hols, Bullmore and Simmons 11 W eigh ted Net w ork Analysis W F reg ( W ) F hyb ( W ) W reg K = . 10 K = . 30 K = . 70 K = . 90 W hyb K = . 10 K = . 30 K = . 70 K = . 90 Figure 2. Sim ulation framework for the counterexample in section 4.2. The small-world correlation matrix W is transformed into a regular and a hybrid matrix, denoted W reg and W hyb . The regular matrix exhibits a lattice-like top ology throughout its cost range, whereas W hyb consists of alternating top ological lay ers of random and regular structures. The entries in b oth matrices hav e b een arranged in decreasing order from the diagonal, to facilitate visualization. Roughly , the three lay ers of the h ybrid netw ork corresp onding to an hybrid association matrix can appro ximately b e describ ed as follows, top ology ( γ ( G hyb , k )) = Random if k ∈ [0 , k 0 ] , Regular if k ∈ ( k 0 , k 00 ] , Random if k ∈ ( k 00 , 1 . 0]; (26) for every k ∈ [0 , 1], where k can only take a finite num b er of v alues in the unit interv al. The regular matrix, b y con trast, w as built as three lay ers of regular top ologies. That is, top ology ( γ ( G reg , k )) = Regular , (27) for every k ∈ [0 , 1]. The random and regular lay ers were constructed in a standard fashion (see Ginestet and Simmons, 2011). Matrices W , W reg and W hyb corresp onding to weigh t sets W , W reg and W hyb , are represen ted in Figure 2 with the corresp onding adjacency matrices resulting from differen t c hoices of cost lev els. By construction, the weigh ted graphs G reg = ( V , E , W reg ) and G hyb = ( V , E , W hyb ) hav e iden- tical levels of general efficiency for the cos t lev els comprised in the interv al [ k 0 , k 00 ]. Therefore, in tegrating o v er that in terv al giv es the same result for b oth graphs: E [ k 0 ,k 00 ] ( G reg ) = E [ k 0 ,k 00 ] ( G hyb ) . = 0 . 708 , (28) where . = means approximately . By contrast, the general efficiencies of these tw o netw orks differ substan tially when in tegrating o v er the full range of cost, i.e. [0 , 1]. This gives E K ( G reg ) . = 0 . 662 and E K ( G hyb ) . = 0 . 679 . (29) This is as exp ected, since the hybrid netw ork has sev eral la y ers of random top ologies, whic h renders it more globally efficien t than G reg . Example 2 illustrates the problems asso ciated with integrating o ver a subset of the cost regimen. By doing so, we are p oten tially omitting substantial top ological differences b etw een the netw orks Ginestet, Nic hols, Bullmore and Simmons 12 W eigh ted Net w ork Analysis of interest at other cost levels. The difference in E K b et ween G reg and G hyb rep orted in that coun terexample may not app ear very large. How ever, these t wo netw orks could hav e represented the mean netw orks of t w o populations of in terest. Providing that the po ol of sub jects is sufficien tly large, such top ological differences could b e found to b e statistically significant. By con trast, comparison of these t w o net w orks on the basis of the full cost regimen yielded answ ers, which w ere exactly identical, thus nullifying any statistical test of group differences. Naturally , this example could hav e b een constructed in the opp osite direction in order to show that netw orks that seem to differ top ologically for some cost subsets are, in fact, identical when in tegrating ov er the full cost regimen. Fixing a cost level or a subset of the cost regimen therefore suffers from tw o main problems. Firstly , the arbitrariness of the choice of a sp ecific cost subset will generally be difficult to jus- tify from either a theoretical or a practical p ersp ective. Secondly , as we hav e illustrated with example 2, considering only a subset of the cost p otentially omits top ological differences, which are solely visible at other cost lev els. Thus, any net work analysis using this strategy can only dra w conclusions that are c onditional on the c hoice of cost subset, and this dep endence should b e made explicit when rep orting the results of suc h analyses. Nonetheless, fixing a particular cost subset successfully satisfies one of our desiderata, whic h was to disen tangle differences in cost from differences in top ology . That is, w eigh ted netw orks’ top ologies can b e compared irresp ective of cost differences, b y conditioning on some subset of the cost levels. This inv ariance prop erty will b e made mathematically more precise in the next section. 4.3 In tegrating ov er Cost lev els F rom a statistical p ersp ective, the problem of isolating top ology from connectivity strength may b e reformulated as ev aluating top ological differences while ‘controlling’ for cost, where these tw o quan tities are treated as random v ariables. A natural starting p oin t is to consider w eighted net w orks whose asso ciation matrices are prop ortional to each other, as in the ensuing example. Example 3. As a simple example, consider the following problem. Let tw o weigh ted netw orks G 1 = ( V , E , W 1 ) and G 2 = ( V , E , W 2 ), b e characterized by the following standardized asso ciation matrices: W 1 := 0 . 0 w 12 , 1 0 . 0 , and W 2 := 0 . 0 w 12 , 2 0 . 0 , (30) where we assume that w 12 , 1 and w 12 , 2 are comprised in the op en interv al (0 , 1). Here, there are only tw o levels of cost, K ∈ { 0 , 1 } . T rivially , G 1 and G 2 can therefore b e shown to exhibit iden tical general efficiency for these t w o cost lev els. Since our proposed formula for cost-in tegrated top ological measures in equation (19) do es not include the null cost, we simply hav e Ω K = { 1 } , whic h implies that b oth graphs attain the maximal lev el of cost-in tegrated efficiency . That is, E K ( G 1 ) = E K ( G 2 ) = 1 . 0 . (31) This simple example serves as a justification for our exclusion of the null cost from the set Ω K in equation (16). Including the null cost w ould result in E K = 0 . 5 for these t wo basic net works, whic h do es not app ear satisfying. Crucially , the equalit y in (31) do es not dep end on the relationship b et ween w 12 , 1 and w 12 , 2 . That is, differences in weigh ted cost hav e no impact on cost-integrated top ology . W e no w return to the case studied in example 1 in order to elucidate the exact effect of cost-in tegration. Example 1 (Contin ued) . In this example, we considered t w o netw orks with prop ortional asso ci- ation matrices, satisfying W 1 := α W 2 . An application of the cost-integrated metrics describ ed in equation (19) to the net w orks of this example gives the follo wing equalities, E K ( W 1 ) = E K ( α W 2 ) = E K ( W 2 ) . (32) That is, when integrating with resp ect to the cost levels, we are ev aluating the efficiencie s of G 1 and G 2 at N I discrete p oints. A t each of these p oints, the efficiency of the t w o net w orks will b e Ginestet, Nic hols, Bullmore and Simmons 13 W eigh ted Net w ork Analysis iden tical, b ecause W 1 is prop ortional to W 2 and therefore the same sets of edges will b e selected. Th us, G 1 and G 2 ha v e iden tical cost-in tegrated efficiencies. The equalities derived in these t w o examples can b e shown to hold in a more general sense. The inv ariance of cost-integrated efficiency turns out to b e true for any monotonic (increasing or decreasing) transformation of the association matrix and applies to an y top ological metric that tak es an un w eigh ted graph as an argument, as formally stated in the following result. Prop osition 1. L et a weighte d undir e cte d gr aph G = ( V , E , W ) . F or any monotonic function h ( · ) acting elementwise on a r e al-value d matrix W , c orr esp onding to the weight set W , and any top olo gic al metric E , the c ost-inte gr ate d version of that metric, denote d E K , satisfies E K ( W ) = E K ( h ( W )) , (33) wher e we have use d the asso ciation matrix, W , as a pr oxy notation for gr aph G . A pro of of this result is provided in App endix B. It relies on the idea that the ev aluation of a weigh ted netw ork solely dep ends on the ranking of the off-diagonal elements of W (i.e. the ranking of the elemen ts in W ), and that the ranks of a set of v alues are indep enden t of a monotonic transformation of these v alues. Note that the arguments used in App endix B do not rely on the definition of E . Therefore, prop osition 1 is true for any cost-integrated top ological metrics –i.e. a metric originally defined in a discrete setting for an un weigh ted graph, and integrated with resp ect to cost, when applied to a weigh ted netw ork. Note also that prop osition 1 only holds for any level of sparsity in G if the thresholding function γ ( G, k ) used in the computation of a cost-integrated metric preserves the original ordering of elements in W with tied ranks, using their indices. In general, how ever, sparse netw orks may b etter b e dealt with, in this context, by adjusting the size of the in tegration domain. Prop osition 1 encapsulates b oth the adv antages and limitations of cost-integrated top ological metrics. Two weigh ted net w orks, whose top ologies are roughly iden tical at every cost level will b e giv en identical scores under this family of metrics, irresp ectiv e of cost differences. Cost-integrated metrics are therefore successful at winnowing top ology from connectivity strength. Another sin- gular adv an tage of this approach is that we obtain a measure, whic h is inv ariant under any nor- malization or standardization of the original data. That is, an y functions that simply rescale or shift the asso ciation weigh ts, in order to ensure that they are comprised in the unit interv al, for instance, will ha v e no effect on the v alue of the cost-in tegrated top ological measures. Ho w ev er, prop osition 1 also demonstrates the limitation of such an approach. One can easily see that such cost-integration will p otentially mask some cost-sp ecific top ological differences, as illustrated in example 2. In addition, when cost-in tegrated topological metrics are used for net work comparison, this requires that the sizes of the w eight sets of different net w orks are identical. Similarly , the presence of m ultiplicities in the ranks of the weigh ts may also cause problems, as this w ould artificially induce a random top ological structure, since weigh ts with equal ranks would b e randomly allo cated to different cost lev els. W e will further discuss these limitations in the conclusion of this pap er. 4.4 Using a W eigh ted Metric A seemingly natural wa y of amalgamating connectivity strength and top ological characteristics is b y directly considering w eigh ted top ological metrics, such as the weigh ted global efficiency , E W , in tro duced in equation (14). Unfortunately , w e here pro ve that such an approach suffers from a serious limitation, which could p otentially dissuade researchers from using this particular type of metrics. With the next prop osition, we show that in a wide range of settings, the weigh ted efficiency is simply equiv alen t to the w eigh ted cost of the graph of in terest. Prop osition 2. F or any weighte d gr aph G = ( V , E , W ) , whose weight set is denote d by W ( G ) , if we have min w ij ∈W ( G ) w ij ≥ 1 2 max w ij ∈W ( G ) w ij , (34) Ginestet, Nic hols, Bullmore and Simmons 14 W eigh ted Net w ork Analysis Sagittal SPN j Sup. Sup. Sup. Sup. Inf. Inf. Inf. Inf. 0 -bac k 1 -bac k 2 -bac k 3 -bac k Figure 3. Mean Statistical Parametric Netw orks (SPN j ) ov er the 4 levels of the N -back task, in the sagittal plane, based on wa velet coefficients in the 0.01–0.03Hz frequency band, with FDR correction (base rate α 0 = . 05). Lo cations of the no des correspond to the stereotaxic cen troids of the corresponding cortical regions. The inferior–sup erior orientation axis is indicated in italics. The size of each node is prop ortional to its degree. then E W ( G ) = K W ( G ) . (35) This result can b e prov ed b y contradiction, as demonstrated in App endix E. The hypothesis in prop osition 2 ma y at first app ear relatively stringent. How ever, it will encompass a wide range of exp erimental situations. F or the real data set describ ed in example 2, the difference b et ween max w ij and 2 min w ij is close to, but not exactly zero. How ever, w e nonetheless ha ve E W = K W , for that example. Thus, the added v alue of using the weigh ted efficiency will, in general, b e questionable since there exists a strong relationship b et ween this top ological measure and a simple a v erage of the edge weigh ts. These theoretical results and asso ciated counterexamples hav e therefore highlighted the limi- tations of v arious approaches to the problem of disentangling differences in cost from differences in top ology . As a result, when comparing sev eral p opulations of netw orks, we recommend the rep orting of differences in weigh ted costs and differences in cost-integrated top ological measures. W e illustrate this approac h with a re-analysis of a previously published fMRI data set. 5 N -bac k W orking Memory Data Set In this section, we illustrate our theoretical results with a previously analyzed data set of a w orking memory task based on functional Magnetic Resonance Imaging (fMRI) data (Ginestet and Simmons, 2011). In particular, we use this data set for testing our proposed MC sampling pro cedure and for comparing a graph’s weigh ted cost with its cost-integrated and weigh ted global efficiencies. 5.1 Description Ginestet and Simmons (2011) considered top ological changes in functional brain netw orks under differen t levels of cognitiv e load. Here, we solely give a cursory description of the exp erimental pro cedure used in this study and refer the reader to the original pap er for the full tec hnical details. Ginestet and Simmons (2011) constructed netw orks on the basis of fMRI data gathered from 43 healthy adults undergoing a w orking memory task known as the N -bac k paradigm. In this exp eriment, sub jects were shown one letter every tw o seconds, and w ere asked to monitor the stim uli, in order to indicate by the push of a button whether the current letter was iden tical to the one presen ted N trials previously , where N = { 1 , 2 , 3 } . A control or null condition was also included, the 0-back task, which consisted of simply indicating whether the current letter w as an X. In this exp erimen t, the sub ject-sp ecific fMRI images w ere parcellated in to 90 regions of in te rest Ginestet, Nic hols, Bullmore and Simmons 15 W eigh ted Net w ork Analysis Iterations Efficiency 0.5 0.6 0.7 0.8 0.9 (a) Global Efficiency 0 1000 2000 3000 4000 5000 (b) Local Efficiency 0 1000 2000 3000 4000 5000 Figure 4. Running means of Monte Carlo (MC) estimates for cost-integrated global and lo cal efficiencies in panel (a) and (b), respectively , for the 3-back netw ork describ ed in example 2. The grey ribb on represen ts the v ariability of these estimators at each m = 1 , . . . , 5000, using t wice the MC standard error. That is, E ( m ) K ± 2 σ ( m ) K for b oth global and lo cal efficiencies. The dashed lines indicate the exact v alue of E K . See appendix A for details. using the Anatomical Automatic Lab elling (AAL) template (Tzourio-Mazoy er et al., 2002). The BOLD time series were av eraged for each AAL region. These regional mean time series w ere then w a v elet decomp osed. W a velet co efficients in the low frequency range (0.01-0.03Hz) were selected for the main netw ork analysis (see also Achard et al., 2006, for a similar analysis of fMRI data). Since the N -bac k paradigm contains four experimental levels, we decomp osed these time series in to blo cks corresp onding to each N -back condition. As each condition was rep eated more than once, these blo c ks were then concatenated. Note that this sequence of pro cessing steps in volvin g w a v elet decomp osition immediately follow ed by blo c k concatenation was studied by Ginestet and Simmons (2011) using simulated data, and was not found to bias the results of the final netw ork analysis. V ertices in these sub ject-sp ecific functional netw orks were chosen to b e the 90 AAL regions, and the edges w ere constructed by computing pairwise correlations betw een eac h condition-specific time series of w av elet co efficients. The results of this construction can be summarized using Statistical Parametric Netw orks (SPNs), as illustrated in Figure 3 (see Ginestet and Simmons, 2011, for details). SPNs are estimated using a mass-univ ariate approach, where the edges in a p opulation of sub ject-sp ecific netw orks are tested for significance using a mixed-effects mo del, and then thresholded using the false discov ery rate (Benjamini and Ho ch b erg, 1995, Nichols and Ha y asak a, 2003). SPNs can b e constructed using functions made freely a v ailable through the R pack age Netw orkAnalysis ( http://CRAN.R- project.org/package=NetworkAnalysis ). F rom Figure 3, one can observe that the connectivity strength (i.e. weigh ted cost or a veraged correlation co efficien t) of the functional netw orks in eac h condition tend to diminish as sub jects exp erience greater cognitiv e load. 5.2 Mon te Carlo (MC) Estimation A full description of the theory supp orting MC estimation in this context is provided in App endix A. MC tec hniques are here used to sp eed up the computation required when estimating our prop osed cost-integrated measures. Figure 4 shows the conv ergence of E ( m ) K to E K , for a medium- sized w eighted net work deriv ed from fMRI data on the w orking memory task described in example 2. The results are provided for b oth global and lo cal efficiencies. Eac h plot in Figure 4 shows the running mean plus or minus twice the running MC standard error, which are defined for the cost- in tegrated efficiencies, as E ( m ) K and ( v ( m ) K ) 1 / 2 , respectively , where m = 1 , . . . , 5000. (See App endix A for details.) In Figure 4, we also rep ort the exact v alues of E K using formula (19) by dashed lines. In all the cases studied, the MC estimates compared fav orably with the exact integrals after Ginestet, Nic hols, Bullmore and Simmons 16 W eigh ted Net w ork Analysis appro ximately a quarter of the num b er of computations required for the exact calculations. That is, the exact deriv ation of E K necessitates N I = 4005 ev aluations of the global or lo cal efficiency . By contrast, MC estimates based on ab out 1000 samples app ear to pro vide reasonably go od appro ximations of these quantities, as indicated by the small MC standard error. This constitutes a non-negligible computational gain. The MC standard error, whic h is derived as a by-product of these computations could then be used as an indicator of the uncertaint y asso ciated with these estimates in a Bay esian hierarchical mo del, where uncertaint y is propagated from the data to the p opulation’s parameters of interest. A simple alternativ e to MC av eraging, in our context, w ould b e to construct a mesh of the unit in terv al and to approximate the desired in tegral b y a w eigh ted sum of the v alues of the top ological metric of interest at the midpoints of that mesh. The latter metho d is generally referred to as the Gauss-Kronro d quadrature formula (see chapter 2 of Mink a, 2001, for a review of integration metho ds). While this method is very efficien t for simple functions, it becomes rapidly un wieldy for complex ones, as it requires an increasingly refined mesh to ensure go o d interpolation. Moreov er, since the Gauss-Kronrod is a deterministic algorithm, it does not provide a measure of the accuracy of the estimation. By contrast, a MC approach ensures asymptotic conv ergence for any level of complexit y and also pro duces precise confidence bands. (See App endix A for details.) 5.3 Ev aluation and Comparison F ollo wing the statistical framew ork used in the original analysis of this data set (Ginestet and Simmons, 2011), we tested for the statistical significance of the N -back factor on differen t top o- logical metrics using a mixed-effects model. W e here hav e n = 43 sub jects and J = 4 exp erimental conditions. Using the formalism in tro duced by Laird and W are (1982), we hav e y i = X i β + Z i b i + i , i = 1 , . . . , n, i iid ∼ N ( 0 , σ 2 I ) b i iid ∼ N ( 0 , σ 2 b I ) , (36) where y i := [ y i 1 , . . . , y iJ ] T is a sub ject-sp ecific v ector of top ological metrics of interest, β := [ β 1 , . . . , β J ] T is a v ector of fixed effect, which do not v ary ov er sub jects, b i := b i 1 is a sub ject- sp ecific random effect and i := [ i 1 , . . . , iJ ] T are the residuals. Finally , the matrices X i ’s and Z i ’s are giv en the follo wing sp ecification, X i = 1 0 0 0 1 1 0 0 1 0 1 0 1 0 0 1 , and Z i = 1 1 1 1 , (37) for ev ery i = 1 , . . . , n . The effect of the N -back factor w as then ev aluated using W ald’s F -test. All these analyses were conducted within the R en vironment using the lme4 pack age (see www.cran.r- pro ject.org and Pinheiro and Bates, 2000). Note that the mo del used here is slightly simpler than the one used in Ginestet and Simmons (2011), as the present mixed-effect mo del was found to b e b etter identified than the growth curve mo del utilized in the original analysis. In Figure 5, we rep ort the cost–in tegrated global efficiencies for this experiment. F or illustrativ e purp oses, we hav e computed these quan tities for four different choices of domains of integration. The E Glo [0 ,k ] ( G ij ) w ere here estimated using 1,000 MC samples for each sub ject in each N -back condition. In panel (a), one can observ e a clear increase of the cost-integrated global efficiencies as we increase the size of the domain of integration, due to the monotonicity of global efficiency with resp ect to cost. This is a standard prop ert y of global efficiency: as graphs b ecome denser, their diameter tends to diminish (Bollobas and Riordan, 2003). In Figure 5, one can also note the dep endence of the inter-sub ject v ariability of the cost–integrated metrics on the chosen domain of in tegration. W e therefore tested for the effect of the N -bac k factor on the top ological metrics of interest, giv en different domains of in tegration, in order to ev aluate whether such a choice of domain has Ginestet, Nic hols, Bullmore and Simmons 17 W eigh ted Net w ork Analysis T able 1. Statistical inference for the mixed-effects mo del described in equation (36) testing for the effect of the N -back factor on differen t top ological v ariables. F or cost-in tegrated global efficiencies, we hav e separately tested four different domains of integration. Outcome V ariable Domain F -statistic a p -v alue K W ( G ) W eighted Cost 3.59 0.01 E Glo K ( G ) Cost-in tegrated [0 , . 25] 0.34 0.79 Cost-in tegrated [0 , . 50] 0.24 0.86 Cost-in tegrated [0 , . 75] 0.40 0.75 Cost-in tegrated [0 , 1 . 0] 1.09 0.35 a W ald F -statistic based on model describ ed in equation (36). a systematic impact on the effect of the exp erimen tal factor. These tests are based on the mixed- effects mo del describ ed in equation (36), and we hav e rep orted the results of these statistical tests in T able 1. These results do not indicate that the choice of different domains of integration yield a systematic bias in statistical inference. As was rep orted b y Ginestet and Simmons (2011), the w eigh ted cost was found to be systematically affected b y the N -back factor (W ald F = 3 . 59 , df 1 = 3 , df 2 = 126 , p = 0 . 01). Ho w ev er, none of the cost-in tegrated global efficiencies app eared to b e significan tly influenced by the exp erimental factor. Most imp ortantly , the use of different domains of integration did not seem to affect the results. Integration ov er the entire cost domain, ho w ev er, resulted in a larger F -statistic, which may b e explained by the low er amoun t of v ariabilit y c haracterizing cost-in tegration o v er larger domains, as can b e observ ed in Figure (5). In addition, in T able 1, we hav e also rep orted the F -statistic for the effect of the N -bac k factor on the weigh ted cost. The sub ject-sp ecific net work’s w eighted costs w ere found to b e significan tly influenced by the level of the exp erimental factor, as is immediately visible from the mean SPNs rep orted in Figure 3. The separation of the differences in cost from the differences in top ology that results from the use of a cost-in tegrated top ological metric is b est illustrated by the interaction plots in Figure 6, where ensembles of global efficiencies corresp onding to different costs are represented for the four levels of the experimental factors. Note that, here, w e are rep orting the efficiency metrics for a single level of cost, not integrated ov er a subset of the cost regimen as was done in Figure 5. This is a visual depiction of the N -back factor that corrob orates the conclusions reached using cost-integrated top ological metrics, which stated that top ology , as measured b y global efficiency , do es not significan tly v ary with the exp erimen tal factor. 6 Discussion This pap er has inv estigated the effect of thresholding matrices of correlation co efficients or other measures of asso ciation for the purp ose of pro ducing simple unw eighted graphs. On the basis of the analysis, examples and counterexamples studied in this pap er, we mak e the following method- ological recommendations to researchers in tending to compare the top ological prop erties of t wo or more p opulations of weigh ted netw orks. Ginestet, Nic hols, Bullmore and Simmons 18 W eigh ted Net w ork Analysis Cost Inter v als nback Global Efficiency 0.3 0.4 0.5 0.6 0.7 [0,0.25] ● ● ● ● ● ● ● ● ● ● ● ● ● ● ● ● ● ● ● ● ● ● ● ● ● ● ● ● ● ● ● ● ● ● ● ● ● ● ● ● ● ● ● ● ● ● ● ● ● ● ● ● ● ● ● ● ● ● ● ● ● ● ● ● ● ● ● ● ● ● ● ● ● ● ● ● ● ● ● ● ● ● ● ● ● ● ● ● ● ● ● ● ● ● ● ● ● ● ● ● ● ● ● ● ● ● ● ● ● ● ● ● ● ● ● ● ● ● ● ● ● ● ● ● ● ● ● ● ● ● ● ● ● ● ● ● ● ● ● ● ● ● ● ● ● ● ● ● ● ● ● ● ● ● ● ● ● ● ● ● ● ● ● ● ● ● ● ● ● ● ● ● 0 1 2 3 [0,0.5] ● ● ● ● ● ● ● ● ● ● ● ● ● ● ● ● ● ● ● ● ● ● ● ● ● ● ● ● ● ● ● ● ● ● ● ● ● ● ● ● ● ● ● ● ● ● ● ● ● ● ● ● ● ● ● ● ● ● ● ● ● ● ● ● ● ● ● ● ● ● ● ● ● ● ● ● ● ● ● ● ● ● ● ● ● ● ● ● ● ● ● ● ● ● ● ● ● ● ● ● ● ● ● ● ● ● ● ● ● ● ● ● ● ● ● ● ● ● ● ● ● ● ● ● ● ● ● ● ● ● ● ● ● ● ● ● ● ● ● ● ● ● ● ● ● ● ● ● ● ● ● ● ● ● ● ● ● ● ● ● ● ● ● ● ● ● ● ● ● ● ● ● ● ● ● ● ● ● ● 0 1 2 3 [0,0.75] ● ● ● ● ● ● ● ● ● ● ● ● ● ● ● ● ● ● ● ● ● ● ● ● ● ● ● ● ● ● ● ● ● ● ● ● ● ● ● ● ● ● ● ● ● ● ● ● ● ● ● ● ● ● ● ● ● ● ● ● ● ● ● ● ● ● ● ● ● ● ● ● ● ● ● ● ● ● ● ● ● ● ● ● ● ● ● ● ● ● ● ● ● ● ● ● ● ● ● ● ● ● ● ● ● ● ● ● ● ● ● ● ● ● ● ● ● ● ● ● ● ● ● ● ● ● ● ● ● ● ● ● ● ● ● ● ● ● ● ● ● ● ● ● ● ● ● ● ● ● ● ● ● ● ● ● ● ● ● ● ● ● ● ● ● ● ● ● ● ● ● ● ● ● ● ● 0 1 2 3 [0,1] ● ● ● ● ● ● ● ● ● ● ● ● ● ● ● ● ● ● ● ● ● ● ● ● ● ● ● ● ● ● ● ● ● ● ● ● ● ● ● ● ● ● ● ● ● ● ● ● ● ● ● ● ● ● ● ● ● ● ● ● ● ● ● ● ● ● ● ● ● ● ● ● ● ● ● ● ● ● ● ● ● ● ● ● ● ● ● ● ● ● ● ● ● ● ● ● ● ● ● ● ● ● ● ● ● ● ● ● ● ● ● ● ● ● ● ● ● ● ● ● ● ● ● ● ● ● ● ● ● ● ● ● ● ● ● ● ● ● ● ● ● ● ● ● ● ● ● ● ● ● ● ● ● ● ● ● ● ● ● ● ● ● ● ● ● ● ● ● ● ● ● ● ● ● ● ● 0 1 2 3 Figure 5. Bo x plots of cost-integrated global efficiencies of fMRI N -back netw orks for four different domains of integration. These integrals were estimated using MC approximation ov er 1,000 samples for each of the 43 sub jects in eac h of the four exp erimental condition. Note that different domains of cost-in tegration do not induce any differences in the effect of the exp erimental factor. F or all choices of in tegration domain, there is no apparent significant differences. 6.1 Summary and Recommendations W e here summarize the main findings of this pap er: (i) fixing a cutoff threshold is not satisfactory , b ecause this is fully determined by differences in connectivity strength, as w e ha ve shown in section 4.1; (ii.) fixing a subset of cost levels is not satisfactory , b ecause this p otentially omits top ological differences at other cost levels (see section 4.2); (iii) integrating ov er the entire cost regimen successfully disen tangles connectivit y strength from top ology up to monotonic transformations. Sp ecifically , such metrics are in v ariant to monotonic transformations of the asso ciation weigh ts, as describ ed in section 4.3; and (iv.) the weigh ted top ological metrics, such as E W , app ear to b e to o closely related to weigh ted costs (see section 4.4). F rom a metho dological p ersp ective, we therefore recommend the following. As a preliminary step, it is go o d practice to standardize the asso ciation weigh ts, in order to obtain w ij ∈ [0 , 1] for all w ij ’s, with large v alues of the weigh ts corresp onding to strong asso ciations. This ma y facilitate comparison across separate netw ork analyses, and ease the interpretation of the results. Secondly , the weigh ted cost, i.e. connectivity strength, of the netw orks of interest can then b e computed for all net w orks. This is central to the rest of the analysis, and should b e conducted systematically . Moreo v er, quantitativ e differences in connectivity strength p er se are informative ab out the brain pro cesses at hand, and their exp erimental relev ance should not b e neglected. Thirdly , p opulation differences in cost-in tegrated top ological metrics may then b e ev aluated. This will indicate whether the top ologies of the p opulations under scrutin y v ary significantly irresp ectiv e of their differences in connectivity strength. This asp ect of netw ork analysis could b e regarded as qualitativ e, as this reflects the netw orks’ architectural prop erties. W e now expand and discuss some of the remarks that w ere made in section 4.3. 6.2 Limitations of Cost-in tegration As with any form of av eraging, cost-integration ignores cost-sp ecific top ological differences. Net- w orks G 1 and G 2 , in example 1, differ in connectivity strength and these differences ma y also b e expressed through their cost-dep endent respective top ologies. That is, as illustrated in example 2, certain graphs may not exhibit the same top ological structure at different cost levels, and therefore in tegrating o v er cost ma y p otentially mask these subtle top ological differences. Another p otential problem with cost-in tegrated quan tities is that they may be exp ensiv e computationally . The num- b er of p ossible cost levels increases at rate O ( N 2 V ) with resp ect to the num b er of vertices in the net w orks of in terest. In App endix A and in section 5, how ev er, w e show how such integrals can b e estimated through MC sampling, which can substantially diminish the required computations. Ginestet, Nic hols, Bullmore and Simmons 19 W eigh ted Net w ork Analysis Another potential pitfall which is not directly visible from prop osition 1 is that the use of cost-in tegration for the comparison of several p opulations of netw orks requires these net w orks to ha v e the same num b er of p ositive weigh ts. That is, to b e comparable tw o netw orks do not simply need to p ossess the same num b er of vertices, i.e. |V ( G 1 ) | = |V ( G 2 ) | , but also should ha ve the ha v e the same num b er of weigh ts, i.e. |W ( G 1 ) | = |W ( G 2 ) | . In this pap er, we hav e re-analyzed an fMRI data set, based on correlation matrices, which pro duce fully w eigh ted netw orks, for which N I = N W for every sub jects. Ho wev er, when such a condition do es not hold, we recommend the selection of a domain of in tegration that corresp onds to the smallest common denominator. That is, N ∗ W := min i =1 ,...,n |W ( G i ) | , for a given p opulation of n w eigh ted netw orks denoted G i . Thus, when considering sparser netw orks, suc h as structural brain netw orks, one ma y still be able to con trol for differences in cost, by integrating ov er a subset of the cost regimen, which reflects the sparsit y of the net w orks under comparison. A similar problem may arise if one or several netw orks in the p opulation of interest hav e mul- tiplicities, i.e. weigh ts that take identical v alues. Since cost-integration relies on the ranking of w eigh ts, it follows that one may need to adjust for such m ultiplicities, otherwise this can lead to spurious generation of random top ologies. That is, when the tied ranks are resolv ed by random ordering, the allocation of weigh ts with iden tical v alues to specific cost lev els is random, and there- fore artificially create a random top ology for these cost levels. F or sparse netw orks, multiplicities are likely to arise around zero. How ever, for large non-sparse net works, the occurrence of multiplic- ities should b e ev aluated by counting the num b er of tied ranks in the distribution of the weigh ts. In particular, if the tw o p opulations of netw orks that one wishes to compare differ significantly in num b er of tied ranks, then comparison based on cost-integration will b e contaminated b y an artificial lev el of random top ology . Another p ossible limitation of cost-integration is that by integrating ov er several cost levels, w e omit to take into account the dep endence b etw een the top ologies of the different thresholded graphs. The top ological structure of the un weigh ted net w orks created by thresholding the original w eigh ted graph share the same edges. Arguably , the cumulativ e nature of this pro cedure results in emphasizing the imp ortance of the set of edges with the largest weigh ts. Once these edges hav e b een included into a thresholded graph, they will b e retained for the remaining cost lev els. This is esp ecially true for the top ological metrics that we ha v e studied in this pap er, since global and lo cal efficiencies are b oth monotonic functions of cost. Finally , one may also b e in terested in addressing how differences in cost and differences in top ology interact. By controlling for monotonic differences in wiring cost, we p otentially ignore ho w cost differences may contribute to the top ological structure. In the supplementary metho ds, w e rep ort a different type of integrated top ological metrics, which attempts to combine cost and top ological differences. In this case, cost-integration was weigh ted with resp ect to the distance b et ween each pair of weigh ts used for thresholding the graph (see the supplemen tary metho ds do cumen t). Unfortunately , we hav e shown that this c hoice of integration exhibits some undesir- able prop erties, in the sense that it tends to giv e more imp ortance to very low- and very high-cost top ologies. F urther research will therefore b e required to pro duce more relev ant top ological func- tions of weigh ted graphs, whic h provide a b etter understanding of the in teraction b etw een cost and top ology . 6.3 F uture W ork Most of this pap er has fo cused on the global efficiency metric. Thus, our conclusions and the examples studied will not necessarily apply to other top ological measures. How ever, our main result (prop osition 1) was prov ed in a very general setting, which is indep enden t of the particular form ula of the top ological metric of interest. Our general conclusion ab out the usefulness of cost-in tegration when one wishes to disen tangle differences in cost from differences in top ology is therefore v alid for any top ological metric defined for an un w eigh ted graph. In addition, we note that since most weigh ted metrics are constructed on the basis of the weigh ted shortest path matrix, one may surmise that our second main theoretical result (prop osition 2), may hold in a more general setting. How ever, a proof that the equiv alence relationship b etw een the weigh ted Ginestet, Nic hols, Bullmore and Simmons 20 W eigh ted Net w ork Analysis 0.0 0.2 0.4 0.6 0.8 1.0 Global Efficiency 0−back 1−back 2−back 3−back K(G)=0.75 K(G)=0.55 K(G)=0.35 K(G)=0.15 K(G)=0.05 Figure 6. Interaction plots of cost-dep endent global efficiencies of fMRI netw orks with resp ect to the lev els of the N -back factor. W e here consider five different costs K ∈ { 0 . 05 , 0 . 15 , 0 . 35 , 0 . 55 , 0 . 75 } . The dashed lines represents the cost-specific global efficiencies of each sub ject, whereas the plain line represents cost-sp ecific global efficiencies av eraged ov er the 43 sub jects. The flatness of the lines at eac h cost levels suggests that the exp erimen tal factor has little effect on the top ological structure of these netw orks. v ersion of a top ological metric and the weigh ted cost, for instance, hold for top ological measures other than the global efficiency w ould require further work. Th us far, we hav e only considered flat distributions on the space of netw ork costs. Ho wev er, future metho dological dev elopments will b e needed in order to consider more sophisticated ap- proac hes to this problem. In particular, the sp ecification of a prior distribution on K should tak e into account the effect size asso ciated with different v alues of this random v ariable. When considering correlation co efficients, for instance, it can easily be shown that higher v alues indicate larger effects, and it ma y therefore be preferable to emphasize netw ork comparisons built upon the largest correlation co efficients. This may b e implemented by in tegrating netw ork top ological metrics with resp ect to a skew ed distribution on K , which puts more weigh t on sparse netw orks, whose edges are b etter identified. One should note that the use of cost-in tegration when comparing w eigh ted net works is not akin to taking into consideration the multilev el or hierarchical nature of a weigh ted net work. Such a structural in terpretation of the successiv e thresholding necessary for suc h an in tegration is not nec- essary to justify the usefulness of the metho d in controlling for monotonic differences in weigh ted cost. Since the netw orks of interest ‘exist’ as weigh ted netw orks, their thresholding remains arti- ficial and it is not clear whether one can ascrib e any substantiv e meaning to the resulting family of thresholded graphs. F urther work will therefore b e needed in order to b etter characterize the arc hitecture of the ensem ble of thresholded discrete netw orks subtending a w eigh ted graph. 7 Ac kno wledgmen ts This work was supp orted by a fello wship from the UK National Institute for Health Research (NIHR) Biomedical Research Centre for Mental Health (BR C-MH) at the South London and Maudsley NHS F oundation T rust and King’s College London. This work has also b een funded b y the Guy’s and St Thomas’ Charitable F oundation as well as the South London and Maudsley T rustees. W e would also like to thank three anonymous reviewers for their v aluable inputs in impro ving this man uscript. Ginestet, Nic hols, Bullmore and Simmons 21 W eigh ted Net w ork Analysis App endices A: Mon te Carlo (MC) Sampling The cost-integrated quantities introduced in section 3.2 ma y first appear unwieldy to compute, esp ecially when considering large graphs. How ever, the structure of these integrals allows the construction of a straigh tforward MC sampling scheme. This classical approximation metho d has the adv antage of providing b oth an estimate of the quantit y of interest and an estimate of the v ariance of that estimation. F or an in tro ductory text to MC techniques, see Gilks et al. (1996), and for a more adv anced treatment, Rob ert and Casella (2004). In order to apply MC sampling theory , we first observ e that our integration problem –that is, the computation of E K – can b e re-formulated as an exp ectation. F or conv enience, we drop any reference to the function γ ( G, K ), and therefore denote the efficiency metric E ( γ ( G, K )) as E ( K ). The cost-integrated metric E K can then b e expressed as an exp ectation of E ( K ) since, straightforw ardly , w e hav e E K = Z Ω K E ( k ) p ( k ) dk = E p [ E ( K )] , (38) where Ω K is the space of all p ossible costs for G , with | Ω K | = N V 2 = N V ( N V − 1) / 2. The exp ectation in (38) is tak en with resp ect to p , the probability density function of K , and explicit reference to G has b een omitted. It is natural to consider the use of a sample { k 1 , . . . , k m } from p in order to approximate E K b y the following empirical av erage, E ( m ) K = 1 m m X l =1 E ( k l ) . (39) The approximation E ( m ) K con verges to E K almost surely , b y the Strong Law of Large Numbers. In addition, pro viding that E ( K ) is square-in tegrable, the sp eed of conv ergence of E ( m ) K can b e ev aluated by considering the theoretical v ariance of that estimate, V ar E ( m ) K = 1 m Z [0 , 1] E ( k ) − E p [ E ( k )] 2 p ( k ) dk. (40) whic h can b e approximated by the following MC v ariance, σ ( m ) K 2 = 1 m 2 m X l =1 E ( k l ) − E ( m ) K 2 . (41) This quantit y is of sp ecial interest in MC sampling, as it p ermits the ev aluation of the rate of conv ergence of the estimation. It is generally referred to as the MC standar d err or . Using Slutsky’s theorem, it can also b e sho wn that as m → ∞ , the random v ariable, E ( m ) K − E K σ ( m ) K , (42) has the probability density function of a Normal v ariate cen tered at zero, with unit v ariance. MC sampling is esp ecially useful when the stochastic function that we wish to in tegrate –here, denoted E ( K )– is complex, whereas the random v ariable with resp ect to which we integrate can easily b e sampled. Most top ological metrics will b e of a complex nature –i.e. non-linear. By contrast, b oth K and C will b e straightforw ard to sample, since we hav e sp ecified uniform distributions for b oth of them. The theory underlying MC sampling is general and can therefore b e applied to any t yp e of top ological metrics. Care, how ever, should b e tak en when ev aluating the properties of v ery large net works, where the topology ma y v ary substantially from one lev el of cost to another. When confronted with suc h large netw orks, how ever, the MC standard error is still a go o d indicator of the accuracy of such approximations. B: Pro of of Prop osition 1 In order to prov e prop osition (1), we first need to give a formal definition of γ ( G, k ), for some given w eighted net work G = ( V , E , W ). This function relies on the concept of rank, which can b e formally Ginestet, Nic hols, Bullmore and Simmons 22 W eigh ted Net w ork Analysis defined in our context, as follows R ij ( W ) := 1 2 N V X u =1 N V X v 6 = u I { w ij ≤ w uv } , (43) where R ij = 1 implies that w ij is the largest weigh t in W . Here, we hav e assumed that there are no ties in the ranks of W . When ties o ccur in practice, we recommend to resolve tied ranks by assigning the corresp onding ordering of the elements’ indices. By contrast, resolving tied ranks using random allo cation can result in introducing a spurious amount of random top ology in the netw orks of interest. The presence of tied ranks, ho wev er, will generally b e indicative of a high level of sparsity , which is b etter dealt with b y restricting the domain of integration. Computationally , this definition can b e simplified if one only considers the upp er off-diagonal elements of W and omits the division by 2. F or our purp ose, this definition will b e more conv enient. These ranks can b e standardized in order to derive the p er c entile r anks , P ij ( W ) := R ij ( W ) N I , (44) where N I is the num b er of edges in the saturated version of G . Note that the resulting matrices R and P of ranks and p ercentile ranks, resp ectively , are b oth symmetric. A go o d introduction to order statistics, ranks and p ercen tile ranks is provided by Lin et al. (2006). The function γ ( G, k ) can now b e given a formal definition using the P ij ’s, such that γ ( G, k ) :=: γ ( W , k ) := I { P ( W ) ≤ k } , (45) where the indicator function is applied elemen twise to matrix P ( W ), where W is the similarity matrix of G . It can hence b e seen that the function γ prescrib es an adjacency matrix A ( k ) with the desired cost. This can b e verified by computing the cost of the corresp onding unw eighted netw ork G ( k ) = ( V , E ( k ) ), where E ( k ) is the edge set that p opulates A ( k ) , obtained after application of the γ function at k . Provided that k ∈ Ω K , as defined in equation (16), we hav e K ( G ( k ) ) = 1 N I X I ( G ) a ( k ) ij = 1 N I X I ( G ) I { P ij ( A ( k ) ) ≤ k } = k , (46) whic h can b e verified by noting that equation (46) is simply the discrete version of the integration of an indicator function of the form, R 1 0 I { x ≤ k } dx = R k 0 dx = k . Using this notation, the pro of of prop osition 1 is now straightforw ard. This demonstration uses the fact that a monotonic function do es not mo dify the ranks of its arguments. Pr o of. Recall that the cost-integrated v ersion of E ( G ), in its computational form, is given by E K ( W ) = 1 N I N I − 1 X t =1 E ( γ ( W , k t )) . (47) T o demonstrate that E K ( W ) = E K ( h ( W )), it therefore suffices to show that E K ( γ ( W , k t )) = E K ( γ ( h ( W ) , k t )) , (48) for every k t , which further simplifies to the sole requirement that γ ( W , k t ) = γ ( h ( W ) , k t ), for all t = 1 , . . . , N I . F rom the definition of the γ function introduced in equation (45), w e hav e the following relationship, γ ( h ( W ) , k t ) = I { P ( h ( W )) ≤ k } = I R ij ( h ( W )) N I ≤ k . (49) Ho wev er, one can observe that, since h is applied element wise, we ha v e R ij ( h ( W )) = 1 2 N V X u =1 N V X v 6 = u I { h ( w ij ) ≤ h ( w uv ) } = R ij ( W ) , (50) for an y monotonic function h . Note that this argumen t mak es no use of the definition of E . This completes the pro of. Ginestet, Nic hols, Bullmore and Simmons 23 W eigh ted Net w ork Analysis C: Pro of of Prop osition 2 Pr o of. W e prov e the result by contradiction. Assume that the conclusion do es not hold. That is, E W 6 = K W . By applying the definitions of E W and K W in equations (14) and (9), resp ectively , we hav e E W ( G ) := 1 N I X I ( G ) 1 d W ij 6 = 1 N I X I ( G ) w ij =: K W ( G ) . (51) It therefore suffices to show that d W ij 6 = w − 1 ij for at least one of the weigh ts. The weigh ted shortest path d W ij is defined in equation (12) as d W ij := min P ij ∈P ij ( G ) X w uv ∈E ( P ij ) w − 1 uv . (52) It follows that d W ij 6 = w − 1 ij if and only if there exists a path P ∗ ij in P ij ( G ), which satisfies X w uv ∈E ( P ∗ ij ) w − 1 uv < w − 1 ij . (53) That is, the path P ∗ ij is shorter than the direct connection w ij b et ween the i th and j th v ertices. Inequality (53) can b e sandwic hed in the following fashion, |E ( P ∗ ij ) | max w ij ∈E ( G ) w ij − 1 ≤ X w uv ∈E ( P ∗ ij ) w − 1 uv < w − 1 ij ≤ min w ij ∈E ( G ) w ij − 1 , (54) where |E ( P ∗ ij ) | denotes the cardinality of P ∗ ij . In verting the en tire inequality then gives 1 |E ( P ∗ ij ) | max w ij ∈E ( G ) w ij ≥ X w uv ∈E ( P ∗ ij ) w − 1 uv − 1 > w ij ≥ min w ij ∈E ( G ) w ij . (55) Ho wev er, we clearly hav e 1 2 max w ij ∈E ( G ) w ij ≥ 1 |E ( P ∗ ij ) | max w ij ∈E ( G ) w ij > min w ij ∈E ( G ) w ij , (56) whic h contradicts our hypothesis, and prov es the claim. References Ac hard, S. and Bullmore, E. (2007). Efficiency and cost of economical brain functional netw orks. PLOS Computational Biology , 3 , 174–182. Ac hard, S., Salv ador, R., Whitcher, B., Suckling, J., and Bullmore, E. (2006). A resilient, lo w-frequency , small-w orld human brain functional netw ork with highly connected asso ciation cortical hubs. J. Neu- r osci. , 26 (1), 63–72. Astolfi, L., Cincotti, F., Mattia, D., De Vico F allani, F., Salinari, S., Marciani, M., Witte, H., and Babiloni, F. (2009). Study of the time-v arying cortical connectivity changes during the attempt of fo ot mov ements b y spinal cord injured and healthy sub jects. Conf Pr o c IEEE Eng Me d Biol So c , 2208–11. Barabasi, A.L. and Alb ert, R. (1999). Emergence of scaling in random netw orks. Scienc e , 286 , 509–512. Bassett, D.S., Bullmore, E., V erchinski, B.A., Mattay , V.S., W einberger, D.R., and Mey er-Lindenberg, A. (2008). Hierarchical organization of human cortical netw orks in health and schizophrenia. J. Neur osci. , 28 (37), 9239–9248. Ginestet, Nic hols, Bullmore and Simmons 24 W eigh ted Net w ork Analysis Bassett, D.S., Meyer-Linden b erg, A., Achard, S., Duke, T., and Bullmore, E. (2006). Adaptive reconfig- uration of fractal small-world human brain functional netw orks. Pr o ce e dings of the National A c ademy of Sciences of the Unite d States of Americ a , 103 (51), 19518–19523. Benjamini, Y. and Ho c hberg, Y. (1995). Controlling the false discov ery rate: A practical and p ow erful approac h to multiple testing. Journal of the R oyal Statistical So ciety. Series B (Metho dolo gic al) , 57 (1), 289–300. Billingsley , P . (1995). Pr ob ability and Measur e. Wiley Series in Probability and Mathematical Statistics. Wiley , New Y ork. Bollobas, B. and Riordan, O. (2003). Mathematical results on scale-free random graphs. In S. Bornholdt and H. Sch uster (eds.) Handb o ok of Gr aphs and Networks: F rom the Genome to the Internet , 1–32. Wiley , London. Cecc hi, G., Rao, A., Centeno, M., Baliki, M., Apk arian, A., and Chialvo, D. (2007). Identifying directed links in large scale functional netw orks: application to brain fMRI. BMC Cel l Biolo gy , 8 , 1–10. De Vico F allani, F., Astolfi, L., Cincotti, F., Mattia, D., Marciani, M., T o cci, A., Salinari, S., Witte, H., Hesse, W., Gao, S., Colosimo, A., and Babiloni, F. (2008). Cortical netw ork dynamics during fo ot mo vemen ts. Neur oinformatics , 6 (1), 23–34. Eguiluz, V.M., Chialvo, D.R., Cecchi, G.A., Baliki, M., and Apk arian, A.V. (2005). Scale-free brain functional netw orks. Phys. R ev. L ett. , 94 (1), 18102–18106. Gilks, W., Richardson, S., and Spiegelhalter, D. (1996). In tro ducing marko v chain monte carlo. In W. Gilks, S. Richardson, and D. Spiegelhalter (eds.) Markov Chain Monte Carlo in Pr actice . Chapman and Hall, London. Ginestet, C.E. and Simmons, A. (2011). Statistical parametric netw ork analysis of functional connectivity dynamics during a working memory task. Neur oImage, doi:10.1016/j.neur oimage.2010.11.030 , 5(2) , 688–704. Gong, G., He, Y., Concha, L., Leb el, C., Gross, D.W., Ev ans, A.C., and Beaulieu, C. (2009). Map- ping anatomical connectivity patterns of human cerebral cortex using in vivo diffusion tensor imaging tractograph y . Cer eb. Cortex , 19 (3), 524–536. Hagmann, P ., Cammoun, L., Gigandet, X., Meuli, R., Honey , C.J., W edeen, V.J., and Sp orns, O. (2008). Mapping the structural core of human cerebral cortex. PL oS Biol , 6 (7), 159–169. He, Y., Chen, Z.J., and Ev ans, A.C. (2007). Small-world anatomical net works in the human brain rev ealed b y cortical thickness from MRI. Cer eb. Cortex , 17 (10), 2407–2419. He, Y., Dagher, A., Chen, Z., Charil, A., Zijdenbos, A., W orsley , K., and Ev ans, A. (2009a). Impaired small-w orld efficiency in structural cortical netw orks in multiple sclerosis asso ciated with white matter lesion load. Br ain , 132 (12), 3366–3379. He, Y., W ang, J., W ang, L., Chen, Z.J., Y an, C., Y ang, H., T ang, H., Zhu, C., Gong, Q., Zang, Y., and Ev ans, A.C. (2009b). Uncov ering intrinsic mo dular organization of sp ontaneous brain activity in h umans. PL oS ONE , 4 (4), 1–18. Kolaczyk, E. (2009). Statistic al Analysis of Network Data: Metho ds and Mo dels . Springer-V erlag, London. Laird, N. and W are, J. (1982). Random-effects mo dels for longitudinal data. Biometrics , 38 , 963–974. Latora, V. and Marchiori, M. (2003). Economic small-w orld b ehavior in w eighted net works. The Eur op e an Physic al Journal B - Condense d Matter and Complex Systems , 32 (2), 249–263. Latora, V. and Marchiori, M. (2001). Efficient behavior of small-world net works. Phys. R ev. L ett. , 87 (19), 198701–198705. Lin, R.and Louis, T., P addo c k, S., and Ridgewa y , G. (2006). Loss function based ranking in tw o-stage hierarc hical mo dels. Bayesian analysis , 1(4) , 915–946. Ginestet, Nic hols, Bullmore and Simmons 25 W eigh ted Net w ork Analysis Mink a, T. (2001). A family of algorithms for appr oximate Bayesian infer enc e. Ph.D. thesis, Massach usetts Institute of T echnology . Newman, M. (2010). Networks: An Intr o duction . Oxford Universit y Press, London. Nic hols, T. and Hay asak a, S. (2003). Controlling the familywise error rate in functional neuroimaging: a comparativ e review. Statistic al Metho ds in Me dic al R ese arch , 419–446. P achou, E., V ourk as, M., Simos, P ., Smit, D., Stam, C., Tsirk a, V., and Michelo yannis, S. (2008). W orking memory in schizophrenia: An EEG study using p o wer sp ectrum and coherence analysis to estimate cortical activ ation and netw ork b ehavior. Br ain T op o gr aphy , 21 (2), 128–137. Pinheiro, J. and Bates, D. (2000). Mixe d-effe cts mo de in S and S-Plus . Springer, London. Rob ert, C. and Casella, G. (2004). Monte Carlo Statistic al Metho ds (2nd Ed.) . Springer. Rubino v, M. and Sp orns, O. (2010). Complex netw ork measures of brain connectivity: Uses and interpre- tations. Neur oimage , 52 , 1059–1069. Salv ador, R., Martinez, A., Pomarol-Clotet, E., Gomar, J., Vila, F., Sarro, S., Cap devila, A., and Bull- more, E. (2008). A simple view of the brain through a frequency-sp ecific functional connectivity measure. Neur oImage , 39 (1), 279–289. Sp orns, O., T ononi, G., and Edelman, G. (2000). Theoretical neuroanatomy: Relating anatomical and functional connectivity in graphs and cortical connection matrices. Cer eb. Cortex , 10 (2), 127–141. Sp orns, O., Chialv o, D.R., Kaiser, M., and Hilgetag, C.C. (2004). Organization, developmen t and function of complex brain netw orks. T r ends in Co gnitive Scienc es , 8 (9), 418–425. Sup ek ar, K., Musen, M., and Menon, V. (2009). Developmen t of large-scale functional brain netw orks in c hildren. PL oS Biol , 7 (7), 1–15. Tzourio-Mazo yer, N., Landeau, B., Papathanassiou, D., Crivello, F., Etard, O., Delcroix, N., Mazoy er, B., and Joliot, M. (2002). Automated anatomical lab eling of activ ations in SPM using a macroscopic anatomical parcellation of the MNI MRI single-sub ject brain. Neur oImage , 15 (1), 273–289. v an den Heuvel, M.P ., Stam, C.J., Kahn, R.S., and Hulshoff Pol, H.E. (2009). Efficiency of functional brain netw orks and intellectual p erformance. J. Neurosci. , 29 (23), 7619–7624. v an Wijk, B.C.M., Stam, C.J., and Daffertshofer, A. (2010). Comparing brain netw orks of different size and connectivity density using graph theory . PL oS ONE , 5 (10), 13701–13716. W atts, D.J. and Strogatz, S.H. (1998). Collective dynamics of ‘small-world’ netw orks. Natur e , 393 (6684), 440–442. Ginestet, Nic hols, Bullmore and Simmons 26
Original Paper
Loading high-quality paper...
Comments & Academic Discussion
Loading comments...
Leave a Comment