Toxicity Prediction using Deep Learning
Everyday we are exposed to various chemicals via food additives, cleaning and cosmetic products and medicines -- and some of them might be toxic. However testing the toxicity of all existing compounds by biological experiments is neither financially …
Authors: Thomas Unterthiner, Andreas Mayr, G"unter Klambauer
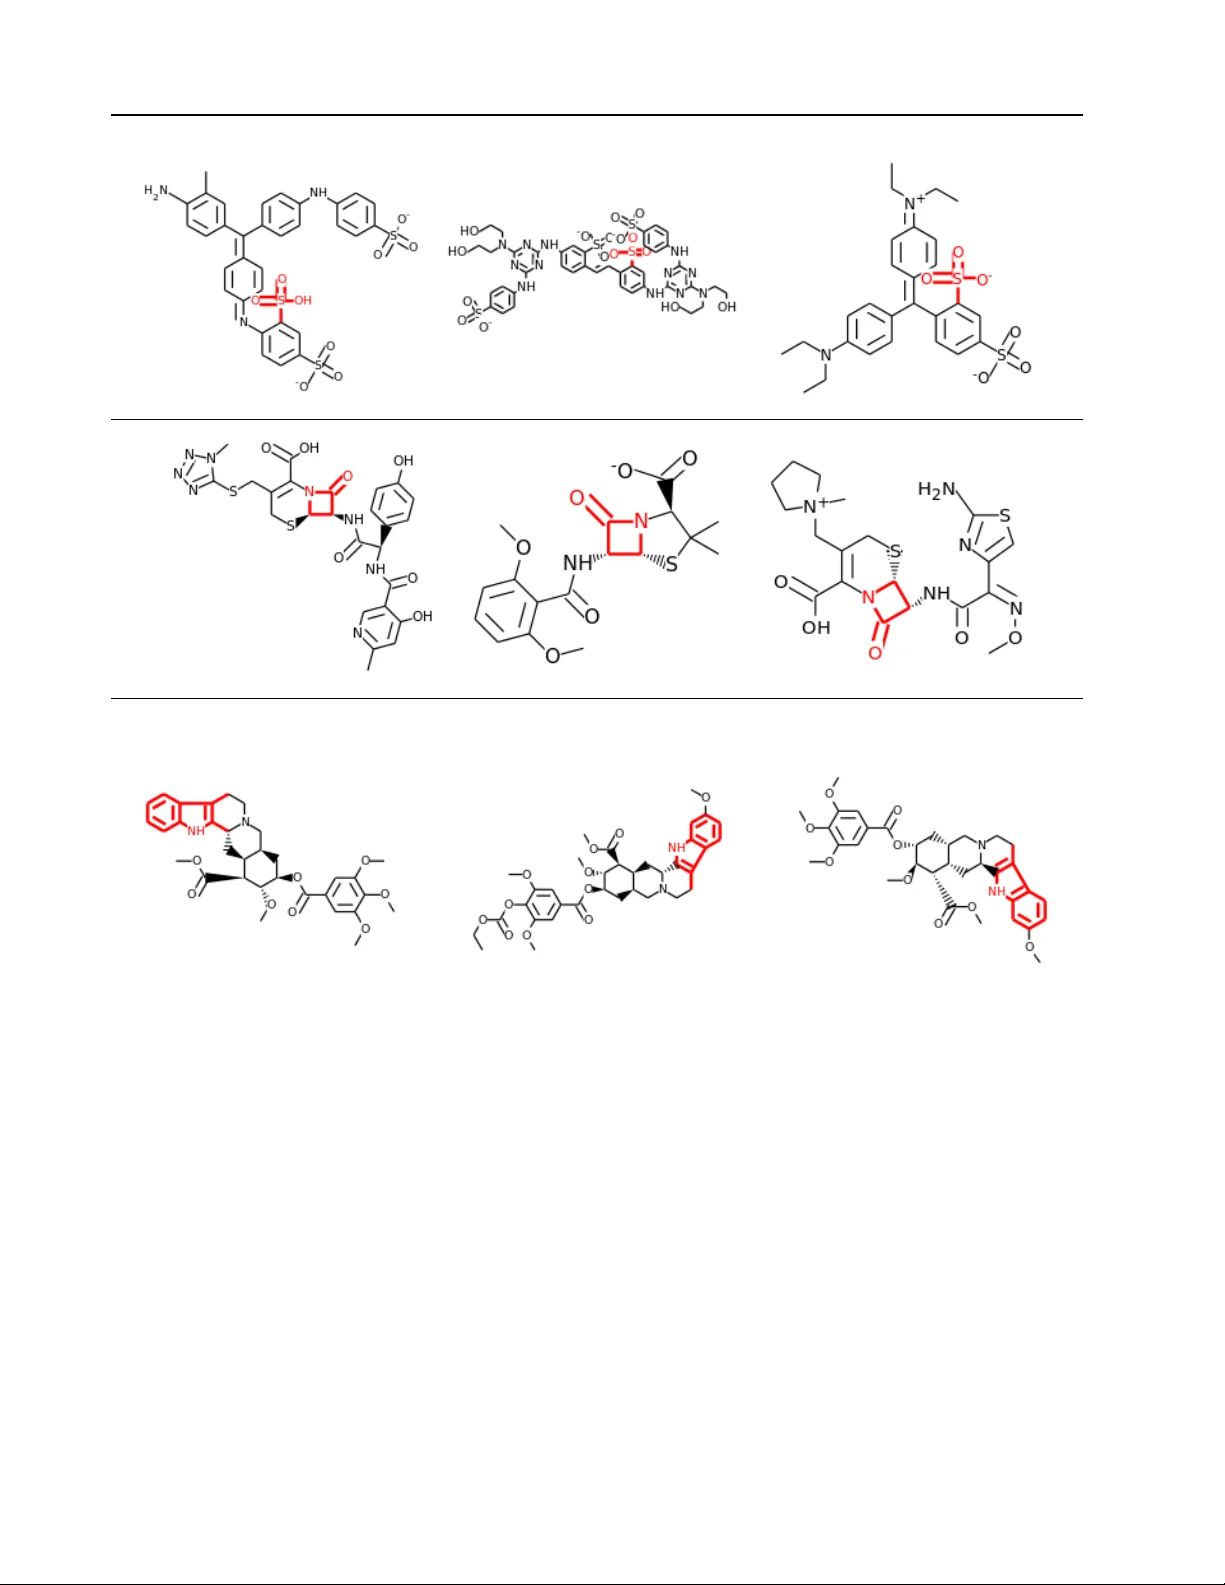
T oxicity Pr ediction using Deep Learning Thomas Unterthiner ∗ 1 , 2 U N T E RT H I N E R @ B I O I N F . J K U . A T Andreas Mayr ∗ 1 , 2 M A Y R @ B I O I N F . J K U . A T G ¨ unter Klambauer ∗ 1 K L A M BA U ER @ B I O I N F . J K U . A T Sepp Hochreiter 1 H O C H R E I T @ B I O I N F . J K U . A T 1 Institute of Bioinformatics, Johannes Kepler Uni v ersity Linz, Austria 2 RISC Software GmbH, Johannes K epler Uni versity Linz, Austria ∗ These authors contributed equally to this w ork Abstract Everyday we are exposed to various chemicals via food additiv es, cleaning and cosmetic prod- ucts and medicines — and some of them might be toxic. Howe v er testing the toxicity of all existing compounds by biological experiments is neither financially nor logistically feasible. Therefore the gov ernment agencies NIH, EP A and FD A launched the T ox21 Data Challenge within the “T oxicology in the 21st Century” (T ox21) initia- tiv e. The goal of this challenge was to assess the performance of computational methods in predicting the toxicity of chemical compounds. State of the art toxicity prediction methods b uild upon specifically-designed chemical descriptors dev eloped ov er decades. Though Deep Learning is ne w to the field and was never applied to tox- icity prediction before, it clearly outperformed all other participating methods. In this applica- tion paper we show that deep nets automatically learn features resembling well-established toxi- cophores. In total, our Deep Learning approach won both of the panel-challenges (nuclear recep- tors and stress response) as well as the ov erall Grand Challenge, and thereby sets a new stan- dard in tox prediction. 1. Introduction Throughout their li v es people are exposed to a sheer end- less variety of chemical compounds, man y of which are po- tentially dangerous. Determining the toxicity of a chemical is of crucial importance in order to minimize our exposure to harmful substances in e very day products. T oxicity is also a central issue in the dev elopment of new drugs, with more than 30 % of drug candidates failing in clinical trials because of undetected toxic ef fects ( K ola & Landis , 2004 ; Arrowsmith , 2011 ). In 2008, the U. S. National Institutes of Health (NIH) and the U. S. En vironmental Protection Agency (EP A), agreed on collaborating on future toxicity testing activ- ities ( Committee on T oxicity T esting and Assessment of En vironmental Agents, National Research Council , 2007 ). Their ef forts were later joined by the U. S. F ood and Drug Administration (FD A) under the umbrella of the T ox21 Pr ogram . The program’ s stated goals are to develop bet- ter toxicity assessment methods, as current methods are not likely to scale with the increased demand for ef fectiv e tox- icity testing. Current methods for testing the toxicity of a high number of chemicals rely on High-Throughput Screening (HTS). HTS experiments can in vestigate whether a chemical compound at a given concentration exhibits a certain type of toxicity , for a number of different compounds in parallel. These experiments are repeated with v arying concentrations of the chemical compound, which allo ws to determine dose- response curves ( Inglese et al. , 2006 ). From these curves one can reliably determine whether a compound activ ated a given pathway or receptor , inhibited it or did not interact at all. Conducting these HTS experiments is a time- and cost- intensiv e process. T ypically , a compound has to be tested for sev eral types of toxicity at dif ferent concentration lev- els. Thus, the whole procedure has to be rerun for many times for each compound. Usually , a cell line has to be cultiv ated to obtain a single data point. Even an unprece- dented multi-million-dollar effort, the T ox21 project, could test only a few thousands of compounds for as fe w as twelve toxic ef fects. Therefore, accurate computational methods for accurate prediction of toxic effects are highly demanded. T oxicity Prediction using Deep Learning Existing computational approaches can be grouped into structure- and ligand-based. The structure-based methods simulate physical interactions between the compound and a biomolecular target ( Kitchen et al. , 2004 ) b ut are only applicable if the complete 3D structure of all interacting molecules are kno wn, and they are infeasible for larger compound data bases. Ligand-based approaches predict the interactions based on pre vious measurements ( Jenkins et al. , 2007 ). Pre vious machine learning ef forts were al- most always ligand-based, such as scoring approaches like the Naiv e Bayes statistics ( Xia et al. , 2004 ; Nigsch et al. , 2008 ; Mussa et al. , 2013 ), density estimation ( R. et al. , 2012 ; Harper et al. , 2001 ), nearest neighbor , support vec- tor machines, and shallow feed forward neural networks ( Byvato v et al. , 2003 ; Lowe et al. , 2011 ). In 2012, the Merck Kaggle challenge on chemical com- pound activity was won using deep neural networks, and the winning group later showed that multi-task learning can help to predict biological acti vities on single proteins ( Dahl et al. , 2014 ). Dahl’ s success inspired us to use Deep Learn- ing for toxicity and tar get prediction ( Unterthiner et al. , 2014 ). In contrast to biological activities of proteins, tox- icological effects in volv e whole cell states determined by dysregulated biological processes. More specifically , tox- icity prediction mainly focuses on cellular assays which measure cytotoxicity , i.e., they measure if a compound is toxic to a cell. A (cyto)toxic compound will cause harm to a cell, e.g. by causing acute mechanical injury or by trig- gering the programmed cell death mechanism (apoptosis) in the affected cells, which multicellular organisms use to protect themselves from cells that have gone out of control. 1.1. Deep Learning f or T oxicity Prediction Deep learning architectures seem to be well suited for tox- icity prediction because they (1) automatically construct complex features ( Bengio et al. , 2013 ) and (2) allow for multi-task learning ( Caruana , 1997 ; Deng et al. , 2013 ; Ben- gio et al. , 2013 ). One ke y aspect of toxicological research is its reliance on hierarchical lev els of abstraction when thinking about chemical structures. A major research goal is the iden- tification of toxicophores, ( Kier , 1971 ; Lin , 2000 ) which are the sets of steric and electronic properties that together produce a certain toxicological ef fect. These properties in- clude hydrophobic regions, aromatic rings, electron accep- tors or donors. This maps naturally to Deep Learning architectures, where higher levels represent more complex concepts ( Bengio , 2013 ). This idea is depicted in Figure 1 , where ECFP4 in- put data (chemical substructures) represent low lev el prop- erties in their first layer , which are combined to form reac- tiv e centers, which in turn encode toxicophores in higher layers. Additionally , Deep Learning is ideally suited for multi-task learning, which is a common setting for toxicology pre- diction: The same compound is often under inv estigation for sev eral types of toxicity , and each of these types is its own prediction task. The work of ( Ramsundar et al. , 2015 ) also sho ws that the multi-task en vironment does help when predicing chemical compounds, and that the performance boost obtained this way increases with the number of ad- ditional learning tasks. Howe ver , we typically ha ve to deal with missing labels, as not all compounds will hav e been tested for each type of toxicity , or because some measure- ments were inconclusiv e. Integrating all prediction tasks into one o verarching multi- task setting offers two adv antages: (a) it naturally allows for multi-label information and therefore can utilize rela- tions between tasks; (b) it allo ws to share hidden unit rep- resentations among prediction tasks. The latter item is par - ticularly important in our application as for some tasks very few measurements are available, therefore single-task pre- diction may fail to construct an effecti ve representation. Thus, deep netw orks exploit representations learned across different tasks and can boost the performance on tasks with few training examples. Furthermore, this method allows us to predict an arbitrary number of toxicological ef fects at the same time, without the need to train single classifiers for each one. 2. Methods 2.1. DNN Architectur e Our system takes a numerical descriptor of a giv en com- pound as input, and tries to predict sev eral dif ferent types of toxic effects at the same time. Such a type could be e.g. whether the compound acts as inhibitor to a specific nuclear receptor , or whether it acti vates a specific stress re- sponse pathway . Each of these types is a binary prediction task. Formally , the problem we are trying to solv e presents itself as follo ws: gi ven a chemical compound i , we w ant to pre- dict whether the compound has property t . W e encode this information in the binary value y it , where y it = 1 if the compound has the property and y it = 0 otherwise. W e are interested in predicting the behavior of a compound on T properties at the same time. Each compound is represented using a number of numer - ical (or binary) features described later in this section. As training data, we are gi ven a numerical representation x i ∈ R d of n training compounds as well as a sparsely populated matrix Y ∈ R n · m of measurements. W e solv e this by using a training objective that is the T oxicity Prediction using Deep Learning Figure 1. Hierarchical nature of fingerprint features: by combining the ECFP features we can b uild reactive centers. By pooling specific reactiv e centers together we obtain a toxicophore that encodes a specific toxicological effect. weighted sum of the cross-entropies ov er all tasks t : − T X t m ti ( y it log ( σ t ( x i )) + (1 − y it ) log (1 − σ t ( x i ))) The binary v ariable m ti is 1 if sample i has a valid label for task t and 0 otherwise. Each single training sample contributed only to a few of the tasks. Thus, output units that were not active during a training sample were masked during backpropagation by multiplying their δ error by m ti . Our network consists of one or multiple layers of ReLU hidden units ( Nair & Hinton , 2010 ; Glorot et al. , 2011 ), fol- lowed by one layer of one or more sigmoid output units, one for each classification task. 2.2. Hyperparameters The input features had substantially dif ferent scales and distributions, such that it was not obvious how to best pre- process them. W e tried both the standard deviation as well as simple tanh nonlinearity to bring the chemical descrip- tors in the same range. ECFP4 features were either scaled by tanh or sqrt nonlinearities. W e additionally used a sim- ple thresholding scheme to filter out v ery sparse features, which helped to bring the number of features down into a manageable range. W e tried different combinations of the av ailable features, e.g. using only the binary ECFP4 fingerprints, or combin- ing only the chemical descriptors with the toxicophore fea- tures. T o regularize our network, we used both Dropout ( Hinton et al. , 2012 ; Sriv astav a et al. , 2014 ) as well as small amounts of L2 weight decay , which both work in concert to av oid regularization ( Krizhe vsky et al. , 2012 ; Dahl et al. , 2014 ). Additionally , we used Early Stopping as determined via cross-validation. T able 1 contains the complete list of hyperparameters we used for our network, as well as the search range for each parameter . 2.3. Input Featur es Having good input features is a crucial issue for chemoin- formatics applications. A vast variety of different methods exist, which calculate numerical features of the the typical graph-based storage format used for chemical compounds. W e used a high-dimensional binary representation using Extended Connectivity FingerPrint (ECFP4) features, the currently best performing compound description in drug design applications ( Rogers & Hahn , 2010 ). Each fea- ture/fingerprint denotes the presence-count of a certain chemical substructure, such as the ones given on the left- most column of Figure 1 . In total, this produced approxi- mately 30 000 very sparse features. As part of the hyper- parameter selection we used a sparsity filter to emov e non- informativ e ones. W e also calculated the similarity of each compound to 2 500 kno wn toxicophore features, ie., patterns of substruc- tures that were pre viously reported as toxicophores in the T oxicity Prediction using Deep Learning Hyperparameter Considered v alues Normalization { standard-deviation, tanh, sqrt } Feature type { molecular-descriptors, tox-and-scaf fold-similarities, ECFP4 } Fingerprint sparseness threshold { 5, 10, 20 } Number of Hidden Units { 1024, 4096, 8192, 16356 } Number of Layers { 1, 2, 3 } Learning Rate { 0.01, 0.05, 0.1 } Dropout { no, yes (50% Hidden Dropout, 20% Input Dropout) } L2 W eight Decay { 0, 10 − 6 , 10 − 5 , 10 − 4 } T able 1. Hyperparameters considered for the neural networks. Normalization: Scaling of the predefined features. F eature type: Determines which of the features were used as input features. “molecular-descriptors” were the real-valued descriptors. “tox-and- scaffold-similarities” were the similarity scores to kno wn toxicophores and scaffolds, “ECFP4” were the ECFP4 fingerprint features. W e tested all possible combinations of these features. Fingerprint sparseness threshold: A feature was not used if it was only present in fewer compounds than the giv en number . Number of hidden units: The number of units in the hidden layer of the neural network. Number of layers: The number of layers of the neural network. Learning rate: The learning rate for the backpropagation algorithm. Dropout: Dropout rates. L2 W eight Decay: The weight decay hyperparameter . literature ( Kazius et al. , 2005 ). W e also calculated the sim- ilarity of each compound with 200 common chemical sub- structures that appear often in organic molecules. Additionally , we calculated a number of descriptors based on the topological and physical properties of each com- pound. T ypical descriptors for toxicity prediction can be grouped into 1D, 2D and 3D features ( Hong et al. , 2008 ). Features that revolv e around scalar properties such as counts of occurences for various atom-types, molecular weight or size are 1D features, while 2D features can be extracted from the planar chemical structure graph. These include graph-based features, 2D autocorrelation descrip- tors as well as v an der W aals volume or the sum of P auling atomic polarizabilities. Finally 3D structures usually in- volv e force-field and quantum-mechanical simluations to extract things lik e solvent accessible surface area or partial charge informations. W e calculated a variety of these descriptors using off-the- shelf software ( Cao et al. , 2013 ). Howe ver , not all de- scriptors could be calculated for all compounds. W e used median-imputation to deal with missing values whenev er feasible. This way we obtained a total of 5057 additional features. 2.4. Implementation Depending on hyperparameter settings, our deep neural network had to deal with up to 40 000 input features and very large hidden layers. W e stored the weight parameters on a single GPU with 12 GB RAM and used mini-batches of 512 samples for stochastic gradient descent learning. Since storing our input data in dense format requires about 5 TB of disk space, we used a sparse storage format. Ho w- ev er , it proved to be faster to upload a mini-batch in sparse format to the GPU and then con vert it to dense format in- stead of using sparse matrix multiplication. 3. Experimental Results 3.1. T ox21 Data Challenge Data W e v alidated our approach using the data from the T ox21 Data Challenge ( National Center for Advancing Transla- tional Sciences , 2014 ), a toxicity prediction challenge or- ganized by the T ox21 program partners open to partici- pants worldwide. The data for this challenge was col- lected within the framework of the T ox21 research initia- tiv e, which aims to produce highly realiable measurements with stringent quality-control criteria, that are otherwise hard to come by in public databases. The data set provided by the T ox21 Data Challenge in- cluded approximately 12 000 compounds and was com- posed of twelve different sub-challenges/tasks. Each sub- challenge required the prediction of a dif ferent type of tox- icity . The sub-challenges were split between two panels: Sev en of the twelve sub-challenges dealt with Nuclear Re- ceptor (NR) signaling pathways, the remaining fi ve with the Str ess Response (SR) pathways. Nuclear receptors are important components in cell com- munication and control, and are in volved in development, metabolism and proliferation. They hav e been shown to play a key role in toxicology as well ( W oods et al. , 2007 ). The T ox21 data set inv estigated several NRs in volved in endocrine system, i.e., the secretion of hormones into the blood stream, as toxins can cause disruption of the nor- mal endocrine function. T wo such nuclear hormone re- ceptors, the estrogen and the androgen receptor, hav e been measured by two independent systems, once using a lu- T oxicity Prediction using Deep Learning minescence method, and once using a modified antibi- otic resistance gene ( NR.ER and NR.ER.LBD / NR.AR and NR.AR.LBD respectively). Furthermore, the challenge in- cluded a task on predicting the antagonists of the aro- matase enzyme, which catalyzes the con version of andro- gen to estrogen and thereby keeps the balance between these two hormones ( NR.Ar omatase ). The last two NRs in the T ox21 data set were the aryl hydrocarbon receptor ( NR.AhR ) which is essential for reacting to a cell’ s en viron- mental changes, and a specific subtype of the peroxisome proliferator-acti vated receptors ( NR.PP AR.gamma ) which is inv olved in the regulation of various genes as well as metabolism. Overall the NR tasks included a broad v ariety of different toxicity-related receptors. T oxicity can also cause cellular stress which in term can lead to apoptosis. Therefore the T ox21 data also includes fiv e tasks on various stress response indicators: The an- tioxidant response element signaling pathway ( SR.ARE ) di- rectly reacts to oxidati ve stress, while the heat shock factor response element ( SR.HSE ) is inv olved in reacting to heat shocks as part of the cell’ s internal repair mechanisms. The A T AD5 signaling pathw ay will be acti vated when a cell de- tects DN A damage ( SR.A T AD5 ). Th e SR panel also in- cludes a task on predicting which compounds influence the mitochondrial membrane potential ( SR.MMP ), which is es- sential for generating the energy a cell consumes. Finally , the p53 task requires participants to detect acti vation of the p53 pathway ( SR.p53 ), a well known cancer pathway which is activ ated both by DNA damage, but also reacts to vari- ous other cellular stresses. For this reason, a compound that triggers any of the other stress response pathways has a high probability to also show up as active on the p53 task. In general, all of the SR tasks sho w higher correlation with each other than the nuclear receptor tasks (c.f. Figure 3 ). Most of the compounds were measured on sev eral of the tasks (c.f. Figure 2 ), such that all the tasks operated on subsets of the same ov erall data set. This allowed us to compute correlations between the tasks, displayed in Fig- ure 3 . As expected, the tasks that in volved measuring the same pathway via dif ferent methods (AR/AR-LBD and ER/ER-LBD) were highly correlated. Also, the p53 path- way , which is one of the main focal points of stress re- sponse signaling, showed high lev els of correlation with the other tasks that measured specific stress responses. Overall, the compounds were split into a training set con- sisting of 11 764 compounds with kno wn labels, a leader - board set used to rank participants on a public leaderboard (297 compounds) as well as a pri vate test set used for the final ev aluation of all submitted entries (643 compounds). The labels for the leaderboard set were initially held back, but later made av ailable to the participants in the final stages of the competition, while the labels of the final test set hav e not yet been released. 0 1 2 3 4 5 6 7 8 9 10 11 12 # valid labels per compound 0 500 1000 1500 2000 2500 3000 Count Figure 2. Number of tasks each training compound of the T ox21 Data Challenge was part of. Only ≈ 500 compounds were part of only a single task, with over half (54 %) of the compounds being labeled in 10 or more of the tasks. NR.AhR NR.AR NR.AR.LBD NR.Aromatase NR.ER NR.ER.LBD NR.PPAR.gamma SR.ARE SR.ATAD5 SR.HSE SR.MMP SR.p53 SR.p53 SR.MMP SR.HSE SR.ATAD5 SR.ARE NR.PPAR.gamma NR.ER.LBD NR.ER NR.Aromatase NR.AR.LBD NR.AR NR.AhR 0.2 0.4 0.6 0.8 1.0 Figure 3. Absolute correlation coefficient between the different tasks of the T ox21 Data Challenge 3 . 1 . 1 . D A TA P R E P RO C E S S I N G The T ox21 training set contains redundant compounds that appear multiple times within the data, but each time ac- companied by carrier molecules such as water, salts or other solubles. Also, we observed compounds that actu- ally consisted of two unrelated structures, but which for some unknown reason where encoded together . W e semi- automatically labeled these fragments, cleaning up contra- dictory and combining agreeing compounds. This way we identified 8,695 distinct compound fragments. T o further clean up the data, we made ran a standard T oxicity Prediction using Deep Learning T ask A UC ST A UC MT p -value NR.AhR 0.8487 0.8409 0.072 NR.AR 0.3755 0.3459 0.202 NR.AR.LBD 0.8799 0.9289 0.011 NR.Aromatase 0.7523 0.7921 0.006 NR.ER 0.6659 0.6949 0.006 NR.ER.LBD 0.6532 0.7272 0.006 NR.PP AR.gamma 0.6367 0.7102 0.006 SR.ARE 0.7927 0.8017 0.148 SR.A T AD5 0.7972 0.7958 0.338 SR.HSE 0.7354 0.8101 0.006 SR.MMP 0.8485 0.8489 0.265 SR.p53 0.6955 0.7487 0.006 T able 2. Comparing single-task (ST) and multi-task (MT) learn- ing. Evaluation was done on the T ox21 leaderboard set. Re- sults are the mean values of training 5 nets from different random initializations. Significant differences according to a two-sided Mann - Whitney U test in bold. clean-up routine for chemical compounds on the data us- ing ChemAxon. This made all hydrogen atoms explicit, ensured that aromatic bonds and tautomers where coded consistently and unified the encoding of salts. W e then cal- culated the input features as described in subsection 2.3 . 3.2. Evaluation W e defined cross-validation sets for hyperparameter selec- tion, optimizing for two goals: a) The class-distributions should be close to the final test set. In the training set many compounds were only measured on a small subset of as- say , whereas we expected compounds in the final test set to be labeled on all twelve tasks. W e therefore included only compounds that were labeled on at least eight tasks in the cross-validation sets. The remaining, sparsely la- beled compounds were added to the training set of each fold. b) The cross-v alidation sets should not be o verly sim- ple. W e wanted to av oid the situation where the training samples were exceedingly similar to the test samples. This happens frequently within chemical data because a number of compounds might share the same chemical backbone. Therefore, we clustered the compounds according to their structural similarity ( V erbist et al. , 2015 ) and distributed the resulting clusters among the fiv e cross-validation folds. W e used the A UC score as quality criterion, which we op- timized independently for each task. So e ven though we employed multi-task networks, we optimized the hyperpa- rameters differently for each task at hand. 3.3. Multitask Learning Most of the compounds where labeled on sev eral of the tasks (c.f. Figure 2 ), which allowed us to calculate the cor - relation between different tasks. As can be seen in Figure 3 , the twelve dif ferent task of the T ox21 Data Challenge Data were highly correlated with one another . Thus, this was an ideal setting for multi-task learning. T o see whether multi-task learning really helps in this sce- nario as much as it did when predicting biological activities on protein level ( Dahl et al. , 2014 ), we also trained single- task neural networks on the same tasks. As sho wn in T able 2 , in almost all tasks the multi-task learning approach significantly outperforms the single task networks. Both networks failed in one task which suffered from very unbalanced class distrib ution (only 3 positi ve ex- amples in the leaderboard set). 3.4. Learning T oxicophor e Representation One of the hallmarks of Deep Learning are sev eral lay- ers of hierarchical representations of increasing abstrac- tions ( Bengio et al. , 2013 ). Within the chemical research community such a hierarchy of features has naturally emerged: single atoms are grouped together as functional groups and reacti ve centers, which in turn define toxi- cophor es (c.f. Figure 1 . Such features are the state-of- the-art way that chemists and drug designers think about the properties of each chemical compound ( Kazius et al. , 2005 ). T o determine the effecti veness of Deep Learning for toxicity prediction, we inv estigated whether the network did implicitly encode toxicophore features in its hidden lay- ers. W e trained a multi-task deep network on the T ox21 data us- ing exclusi vely ECFP4 fingerprint-features as input. Each fingerprint encodes how many times a specific, small chem- ical substructure appears within a compound. No other in- put features were used. After training, we computed the correlation between the activ ations of the hidden units and the presence/absence of known toxicophore features in the compounds. W e did indeed find sev eral highly significant correlations, clearly demonstrating that the hidden units of a neural network do indeed automatically learn toxicophore structures. V isual inspection of the results sho wed that lo wer layers did tend to learn smaller features, often focusing on sin- gle functional groups like e.g. sulfonyl-groups (see row 1 and 2 of Figure 4 , while in higher layers the correlations were more with lar ger toxicophore clusters, e ven in volving structures that did not match the toxicophore perfectly (ro w 3 of Figure 4 . 4. Results The T ox21 Data Challenge Data attracted a large crowd of participants from all over the world, including submissions T oxicity Prediction using Deep Learning Figure 4. Neurons that have learned to detect the presence of pharmacophores. Each ro w shows a certain hidden unit in a learned network that correlates highly with a certain toxicophore feature. The row shows the three chemical compounds that had the highest activation for that neuron. Emphasized in red is the toxicophore structure from the literature that the neuron correlates with. Rows 1 and 2 are from the first hidden layer , the last row is from a higher layer . from leading research labs and industry . The final ev aluation was done by the organizers on a held back ev aluation set consisting of 643 compounds. The teams were allowed to send in predictions for these final compounds, but did not receive any feedback as to how well they fared. The final scoring on each sub-challenge was based on the A UC values of each team’ s final submis- sion. Our approach which was spearheaded by the deep neural network presented in this paper showed the most consistent performance of all participants: It never placed lower than fifth place in any of the tasks, and outright won a total of 8 of the 15 challenges. In particular, it achiev ed the best av erage A UC in both the SR and NR panels, as well as as well as the best average A UC ov er the whole set of sub- challenges. It was thus declared winner of both the Nuclear Receptor and the Stress Response pannel, as well as the ov erall T ox21 Grand Challenge. The detailed results are displayed in T able 3 . T oxicity Prediction using Deep Learning A VG NR SR AhR AR AR-LBD ARE Aromatase A T AD5 ER ER-LBD HSE MMP p53 PP AR.g our method 0.846 0.826 0.858 0.928 0.807 0.850 0.840 0.834 0.793 0.793 0.814 0.858 0.941 0.862 0.839 AMAZIZ 0.838 0.816 0.854 0.913 0.770 0.846 0.805 0.819 0.828 0.806 0.806 0.842 0.950 0.843 0.830 dmlab 0.824 0.811 0.850 0.781 0.828 0.819 0.768 0.838 0.800 0.766 0.772 0.855 0.946 0.880 0.831 T 0.823 0.798 0.842 0.913 0.676 0.848 0.801 0.825 0.814 0.784 0.805 0.811 0.937 0.847 0.822 microsomes 0.810 0.785 0.814 0.901 – – 0.804 – 0.812 0.785 0.827 – – 0.826 0.717 filipsPL 0.798 0.765 0.817 0.893 0.736 0.743 0.758 0.776 – 0.771 – 0.766 0.928 0.815 – Charite 0.785 0.750 0.811 0.896 0.688 0.789 0.739 0.781 0.751 0.707 0.798 0.852 0.880 0.834 0.700 RCC 0.772 0.751 0.781 0.872 0.763 0.747 0.761 0.792 0.673 0.781 0.762 0.755 0.920 0.795 0.637 frozenarm 0.771 0.759 0.768 0.865 0.744 0.722 0.700 0.740 0.726 0.745 0.790 0.752 0.859 0.803 0.803 T oxFit 0.763 0.753 0.756 0.862 0.744 0.757 0.697 0.738 0.729 0.729 0.752 0.689 0.862 0.803 0.791 CGL 0.759 0.720 0.791 0.866 0.742 0.566 0.747 0.749 0.737 0.759 0.727 0.775 0.880 0.817 0.738 SuperT ox 0.743 0.682 0.768 0.854 – 0.560 0.711 0.742 – – – – 0.862 0.732 – kibutz 0.741 0.731 0.731 0.865 0.750 0.694 0.708 0.729 0.737 0.757 0.779 0.587 0.838 0.787 0.666 MML 0.734 0.700 0.753 0.871 0.693 0.660 0.701 0.709 0.749 0.750 0.710 0.647 0.854 0.815 0.645 NCI 0.717 0.651 0.791 0.812 0.628 0.592 0.783 0.698 0.714 0.483 0.703 0.858 0.851 0.747 0.736 VIF 0.708 0.702 0.692 0.827 0.797 0.610 0.636 0.671 0.656 0.732 0.735 0.723 0.796 0.648 0.666 T oxic A vg 0.644 0.659 0.607 0.715 0.721 0.611 0.633 0.671 0.593 0.646 0.640 0.465 0.732 0.614 0.682 Swamidass 0.576 0.596 0.593 0.353 0.571 0.748 0.372 0.274 0.391 0.680 0.738 0.711 0.828 0.661 0.585 T able 3. Results of the leading teams in the T ox21 Data Challenge, best results in bold and gray background, second best results in light gray . A VG is the a verage ov er all 12 subchallenges. NR/SR are averages ov er all tasks that are part of the “Nuclear Receptor” and “Stress Response” panels, respectiv ely . The left side sho ws the individual sub-challenges. T eam-names have been abbre viated in order to save space. The full list of results is av ailable online at https://tripod.nih.gov/tox21/challenge/leaderboard.jsp . 5. Conclusion In this paper we applied of deep neural networks to toxicity prediction. W e sho wed that deep networks are able to learn a highly effecti ve representation of chemical compounds. In this representation we could detect toxicophores, pro ven concepts which ha ve previously often been handcrafted ov er decades by e xperts in the field. It stands to reason that these representations also include novel, previously undis- cov ered toxicophores that are lying dormant in the data. Using these representations, our approach outperformed methods that were specifically tailored for toxicological ap- plications. As demonstrated by the T ox21 Data Challenge, our method sets a new state of the art in this field. As the NIH con- firmed ( National Center for Advancing T ranslational Sci- ences , 2015 ), the high quality of the models makes them suitable for deployment in leading edge toxicological re- search. W e belie ve that Deep Learning has the ability to greatly influence the field of toxicity prediction in the fu- ture. T oxicology is a crucial part of modern en vironmental health, drug de velopment and pharmaceutical research, and machine learning is on the verge of becoming a vital part of it. Acknowledgments This work was supported in part by European Union’ s IAPP grant number 324554. The authors also gratefully acknowledge the support of NVIDIA Corporation with the donation of a GPU used for this research. References Arrowsmith, J. T rial watch: phase III and submission fail- ures: 2007–2010. Nature Revie ws Drug Discovery , 10 (2):87–87, 2011. Bengio, Y . Deep learning of representations: Looking for- ward. In Pr oceedings of the Fir st International Con- fer ence on Statistical Language and Speec h Pr ocessing , SLSP’13, pp. 1–37, Berlin, Heidelberg, 2013. Springer- V erlag. ISBN 978-3-642-39592-5. Bengio, Y ., Courville, A., and V incent, P . Representation learning: A re view and new perspectives. IEEE T rans P attern Anal Mach Intell , Feb 2013. Byvato v , E., Fechner , U., Sadowski, J., and Schneider , G. Comparison of Support V ector Machine and Artificial Neural Network Systems for Drug/Nondrug Classifica- tion. Journal of Chemical Information and Computer Sciences , 43(6):1882–1889, September 2003. Cao, DS., Xu, QS., Hu, QN., and Liang, YZ. ChemoPy: freely av ailable python package for computational biol- ogy and chemoinformatics. Bioinformatics , 29(8):1092– 1094, 2013. T oxicity Prediction using Deep Learning Caruana, R. Multitask learning. Machine Learning , 28(1): 4175, 1997. ISSN 0885-6125. Committee on T oxicity T esting and Assessment of En vi- ronmental Agents, National Research Council. T oxicity T esting in the 21st Century: A V ision and a Strate gy . The National Academies Press, W ashington, DC, 2007. ISBN 978-0-309-15173-3. Dahl, G., Jaitly , N., and Salakhutdinov , R. Multi- task neural networks for QSAR predictions. CoRR , abs/1406.1231, 2014. Deng, L., Li, J., Huang, JT ., Y ao, K., Y u, D., Seide, F ., Seltzer , M., Zweig, G., He, Xiaodong, Williams, J., Gong, Y ., and Acero, A. Recent advances in deep learning for speech research at microsoft. In Acoustics, Speech and Signal Pr ocessing (ICASSP), 2013 IEEE In- ternational Confer ence on , pp. 8604–8608, 2013. Glorot, X., Bordes, A., and Bengio, Y . Deep sparse rectifier neural networks. In AIST ATS , pp. 315–323, 2011. Harper , G., Bradshaw , J., Gittins, J., Green, D., and Leach, A. Prediction of biological activity for high-throughput screening using binary kernel discrimination. Journal of Chemical Information and Computer Sciences , 41(5): 1295–1300, 2001. Hinton, G., Sriv astava, N., Krizhe vsky , A., Sutskev er, I., and Salakhutdinov , R. Improving neural networks by prev enting co-adaptation of feature detectors. July 2012. Hong, H., Xie, Q., Ge, W ., Qian, F ., Fang, H., Shi, L., Su, Z., Perkins, R., and T ong, W . Mold2, molecular de- scriptors from 2d structures for chemoinformatics and toxicoinformatics. Journal of Chemical Information and Modeling , 48(7):1337–1344, 2008. Inglese, J., Auld, D. S., Jadha v , A., Johnson, R. L., Sime- onov , A., Y asgar , A., Zheng, W ., and Austin, C. P . Quan- titativ e high-throughput screening: a titration-based ap- proach that efficiently identifies biological activities in large chemical libraries. Pr oc Natl Acad Sci U S A , 103 (31):11473–11478, August 2006. Jenkins, J., Bender, A., and Davies, J. In silico target fish- ing: Predicting biological targets from chemical struc- ture. Drug Discovery T oday: T echnologies , 3(4):413– 421, 2007. Kazius, J., McGuire, R., and Bursi, R. Deriv ation and validation of toxicophores for mutagenicity prediction. Journal of Medicinal Chemistry , 48(1):312–320, 2005. Kier , L.B. Molecular orbital theory in drug resear ch . Medicinal chemistry . Academic Press, 1971. Kitchen, D., Decornez, H., Furr, J., and Bajorath, J. Dock- ing and scoring in virtual screening for drug disco very: methods and applications. Nature Revie ws Drug discov- ery , 3(11):935–949, 2004. K ola, I. and Landis, J. Can the pharmaceutical industry reduce attrition rates? Nat Rev Drug Discov , 3(8):711– 716, August 2004. ISSN 1474-1776. Krizhevsk y , A., Sutske ver , I., and Hinton, G. Imagenet classification with deep con volutional neural networks. In Pereira, F ., Burges, C.J.C., Bottou, L., and W ein- berger , K.Q. (eds.), Advances in Neural Information Pr o- cessing Systems 25 , pp. 1097–1105. Curran Associates, Inc., 2012. Lin, SK. Pharmacophore perception, development and use in drug design. edited by osman f. g ¨ uner . Molecules , 5 (7):987–989, 2000. ISSN 1420-3049. Lowe, R, Mussa, H., Mitchell, J., and Glen, R. Classify- ing molecules using a sparse probabilistic kernel binary classifier . Journal of Chemical Information and Model- ing , 51(7):1539–1544, 2011. Mussa, H., Mitchell, J., and Glen, R. Full ”Laplacianised” posterior naiv e Bayesian algorithm. J ournal of Chemin- formatics , 5(1):37+, August 2013. Nair , V . and Hinton, G. Rectified linear units improve re- stricted boltzmann machines. In Pr oceedings of the 27th International Confer ence on Machine Learning (ICML) , pp. 807–814, 2010. National Center for Adv ancing Translational Sciences. T ox21 Data Challenge 2014. https://tripod. nih.gov/tox21/challenge/ , 2014. [Online; last accessed 05-January-2015]. National Center for Adv ancing T ranslational Sci- ences. NCA TS Announces T ox21 Data Chal- lenge W inners. http://www.ncats. nih.gov/news- and- events/features/ tox21- challenge- winners.html , 2015. [Online; last accessed 06-February-2015]. Nigsch, F ., Bender , A., Jenkins, J., and Mitchell, J. Ligand- target prediction using winnow and naiv e bayesian al- gorithms and the implications of overall performance statistics. Journal of Chemical Information and Mod- eling , 48(12):2313–2325, 2008. R., Lowe, Y ., Mussa, F ., Nigsch, Glen, R., and Mitchell, J. Predicting the mechanism of phospholipidosis. Journal of Cheminformatics , 4(1):2, 2012. Ramsundar, B., K earnes, S., Riley , P ., W ebster , D., K on- erding, D., and Pande, V . Massively Multitask Networks for Drug Discov ery . CoRR , abs/1502.02072, 2015. T oxicity Prediction using Deep Learning Rogers, D. and Hahn, M. Extended-connecti vity finger- prints. J ournal of Chemical Information and Modeling , 50(5):742–754, May 2010. Sriv astav a, N., Hinton, G., Krizhevsky , A., Sutske ver , I., and Salakhutdinov , R. Dropout: A simple w ay to pre vent neural networks from ov erfitting. Journal of Machine Learning Resear ch , 15:1929–1958, 2014. Unterthiner , T ., Mayr , A., Klambauer , G., Steijaert, M., W egner , J. K., Ceulemans, H., and Hochreiter , S. Deep learning as an opportunity in virtual screening. In Deep Learning and Repr esentation Learning W orkshop, NIPS 2014 , Montreal, Canada, Dec 2014. V erbist, B., Klambauer , G., V ervoort, L., T alloen, W ., Shkedy , Z., Thas, O., Bender , A., G ¨ ohlmann, H., and Hochreiter , S. Using transcriptomics to guide lead op- timization in drug discovery projects: Lessons learned from the QST AR project. Drug Discovery T oday , 2015. ISSN 1359-6446. W oods, C. G., V anden H., John P ., and Rusyn, I. Genomic profiling in nuclear receptor-mediated toxicity . T oxico- logic P athology , 35(4):474–494, 2007. Xia, X., Maliski, E., Gallant, P ., and Rogers, D. Classifica- tion of Kinase Inhibitors Using a Bayesian Model. Jour - nal of Medicinal Chemistry , 47(18):4463–4470, August 2004.
Original Paper
Loading high-quality paper...
Comments & Academic Discussion
Loading comments...
Leave a Comment