Power-law models for infectious disease spread
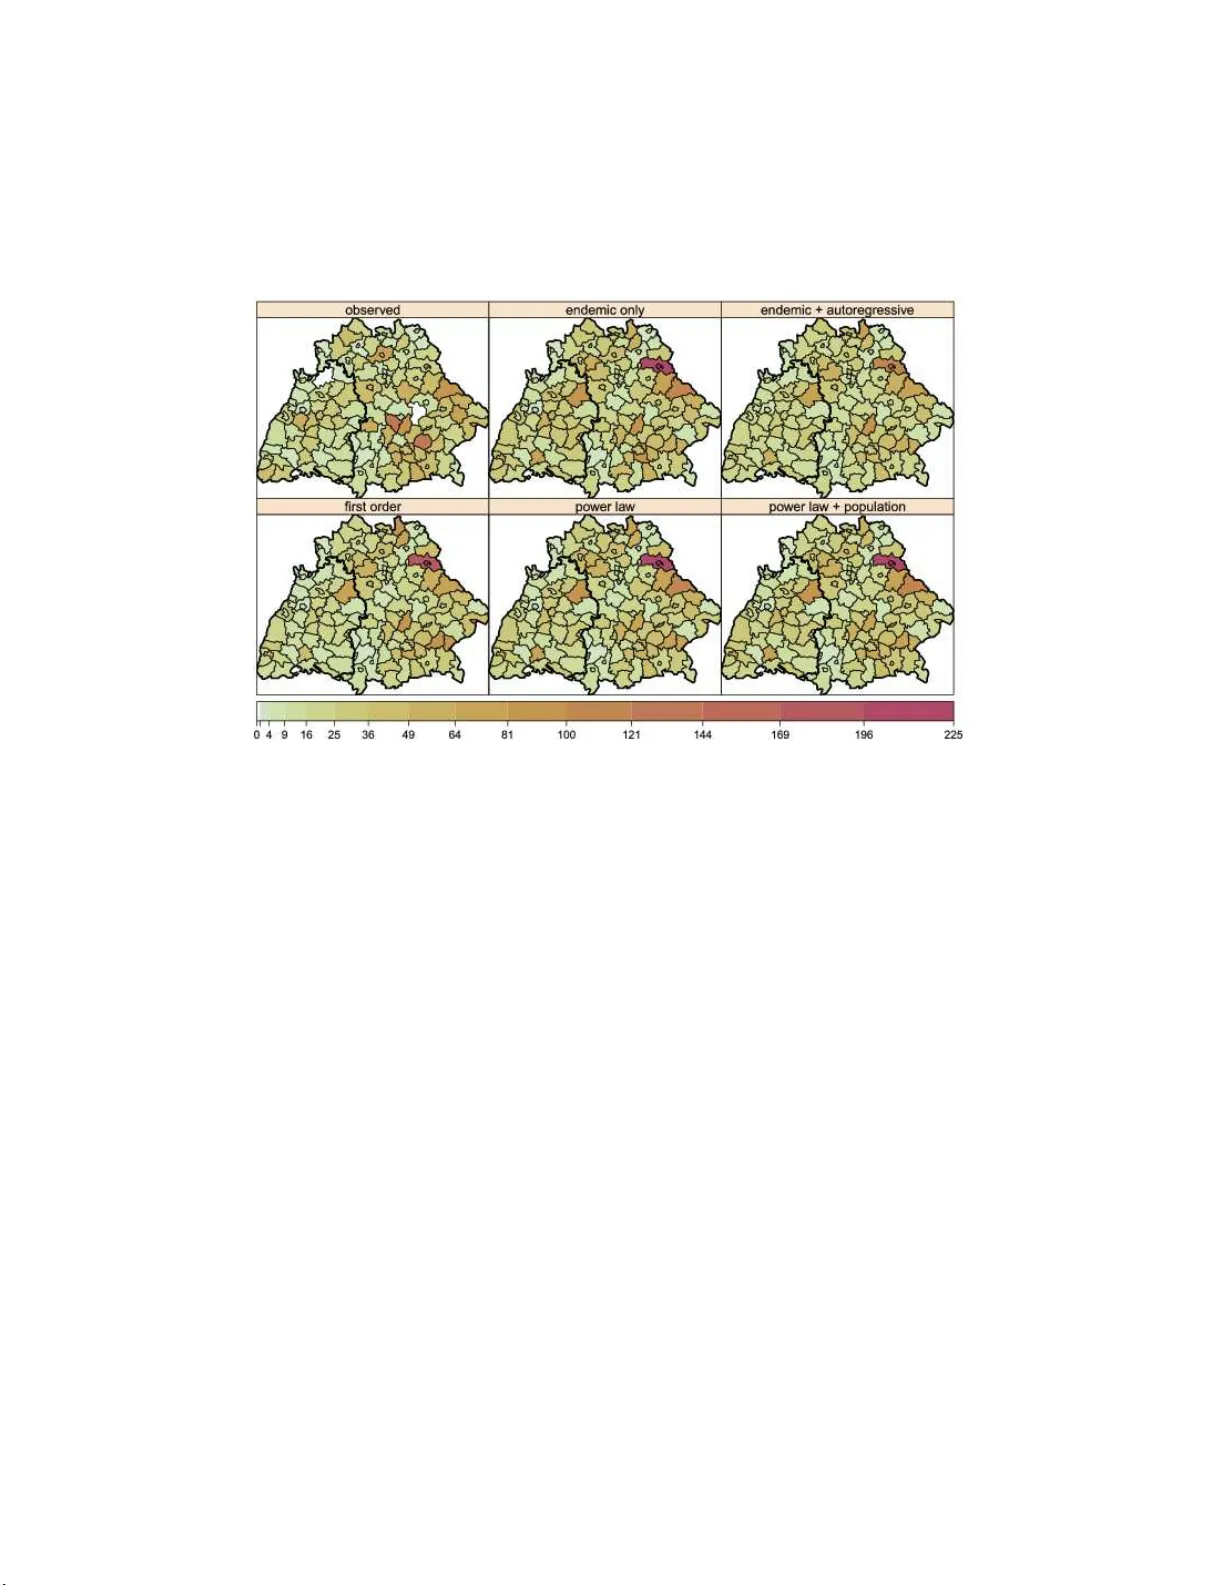
Short-time human travel behaviour can be described by a power law with respect to distance. We incorporate this information in space-time models for infectious disease surveillance data to better capture the dynamics of disease spread. Two previously…
Authors: Sebastian Meyer, Leonhard Held
The Annals of Applie d Statistics 2014, V ol. 8, No. 3, 1612–163 9 DOI: 10.1214 /14-A OAS743 c Institute of Mathematical Statistics , 2 014 PO WER-LA W MODELS F OR INFECTIOUS DISEAS E SPREAD 1 By Sebast ian Meyer and Leonhard Held University of Zurich Short-time human travel b ehaviour can b e describ ed by a p ow er la w with respect to distance. W e incorp orate this informatio n in space–time mod els for infectious disease surveilla nce data to b etter capture the dyn amics of disease spread. Tw o previously established mod el classes are exten ded, whic h b oth decomp ose disease risk ad- ditively into endemic an d epidemic components: a spatio-temp oral p oin t pro cess mo del for in dividual-level data and a m ultiv ariate time- series mo del for aggregated count data. In b oth framew orks, a p ow er- la w decay of spatial interactio n is embedded into the ep idemic com- p onent and estimated join tly with all other unknown parameters us- ing (p enalised) likelihoo d inference. Whereas the p o w er law can be based on Euclidean distance in th e p oin t pro cess mo del, a nov el for- mula tion is prop osed for count data where the p ow er law dep end s on the order of t h e neighbourho od of d iscrete spatial un its. The p erfor- mance of th e new approac h is investig ated by a reanalysis of individ- ual cases of inv asiv e meningo co ccal disease in Germany (2002–2008) and count d ata on influenza in 140 administrative districts of S outh- ern Germany (2001–2 008). In b oth applications, the p ow er law sub- stanti ally improve s model fit and predictions, and is reasonably close to alternativ e qualitative formula tions, where distance and order of neighbourho od , respectively , are treated as a factor. Implementation in the R pack age surveil lanc e all o ws the approach to b e applied in other settings. 1. Introd uction. The surve illance of infectious diseases constitutes a key issue of public health and mo delling their spread is basic to the prev ention and con trol of epidemics. An imp ortant task is th e timely detection of disease outbreaks, for whic h p opular metho ds are the F arrington algo r ithm [F ar- rington et al. ( 1996 ), Noufaily et al. ( 2013 )] and cumulativ e sum (CUSUM) Received Au gust 2013; revised F ebruary 2014. 1 F un ded by the Swiss National Science F oundation (pro ject #137919). Key wor ds and phr ases. Po wer la w, spatial interactio n fun ction, infectious disease surveil lance, stochasti c epidemic modelling, branc hing process with immi gration, m u l- tiv ariate t ime series of counts, spatio-temp oral p oint pro cess. This is a n e lectronic repr in t o f the original article publishe d b y the Institute of Ma thematical Statistics in The A n nals of A pplie d Statistics , 2014, V ol. 8 , No. 3, 1 612– 1639 . This re print differs from the original in pagina tion and typogra phic detail. 1 2 S. MEYER AN D L. HELD lik eliho o d r atio detectors insp ir ed b y statistical pro cess con trol [H¨ ohle and P aul ( 2008 ), H¨ ohle, P aul and Held ( 2009 )]. As opp osed to suc h prosp ec- tiv e surveilla n ce, retrosp ectiv e surveill ance is concerned with explaining the spread of an ep id emic through sta tistical m o delling, thereby assessing the role of en vironmental and so cio-demographic factors or con tact net w orks in shaping th e ev olution of an epidemic. Th e spatio-temp oral data for s u c h mo delling pr imarily originate from routine public health surve illance of the o ccurrence of infectious diseases and is ideally accompanied by additional data on influ en tial factors to b e accoun ted for. Su rv eillance data are a v ailable in different spatio-temp oral r esolutions, eac h type requiring an appropriate mo del fr amew ork. This p ap er co v ers b oth a sp atio-te mp oral p oin t pro cess mo del for indi- vidual-lev el data [prop osed by Mey er, Elias and H¨ ohle ( 2012 ) and motiv ated b y the w ork of H¨ ohle ( 2009 )] and a multiv ariate time-series mo del for aggre- gated coun t d ata [established by Held and P aul ( 2012 ) and earlier wo r k]. Al- though these t w o mo d els are designed for different typ es of spatio-temp oral surve illance data, b oth are inspired by the appr oac h of Held, H¨ o h le and Hof- mann ( 2005 ) d ecomp osing disease risk add itively into “endemic” and “epi- demic” comp onent s. The endemic comp onen t captures exoge nous factors suc h as p opulation, so cio-demographic v ariables, long-term trends , season- alit y , climate, or concurr en t incidence of related diseases (all v arying in time and/or space). Explicit dep endence b etw een cases, that is, infectiousness, is then introd u ced through epidemic comp onen ts dr iven by th e observe d p ast. T o d escrib e disease spread in space, b oth mo dels accoun t for spatial in- teraction b et ween units or individu als, resp ectiv ely , but up to no w, this has b een incorp orated rather crudely . The p oin t pro cess mo del u s ed a Gaussian k ern el to capture spatial inte raction, and the multiv ariate time-series mo del restricted epidemic s p read from time t to t + 1 to adjacen t regions. Ho w ever, a simp le form of disp ersal can b e m otiv ated by the find ings of Bro ckmann, Hufnagel and Geisel ( 2006 ): they inferred from the disp ersal of bank n otes in the United States that (sh ort-time) h u man trav el b eha viour can b e w ell describ ed by a decreasing p o wer la w of the distance x , that is, f ( x ) ∝ x − d with p ositiv e d eca y parameter d . An imp ortan t charact eristic of this p ow er la w is its slow conv ergence to zero (“hea vy tail”), w h ic h in our application enables o ccasional long-range tr ansmissions of inf ectious agen ts in addition to principal sh ort-range infections. In the wo r ds of Bro c kmann , Hufn agel and Geisel ( 2006 ), their results “can serve as a starting p oint for the devel - opmen t of a new class of mo dels for the spr ead of h uman infectious d iseases”. P ow er la ws are w ell kno wn fr om the work by Pareto ( 1896 ) for the distribu- tion of income and Zipf ( 1949 ) for cit y sizes and w ord fr equencies in texts. They d escrib e th e distribu tion of earthquak e magnitudes [Guten b erg and Ric hter ( 1944 )] an d many other natural ph enomena [see Newman ( 2005 ), POWER-LA W MODELS FOR INFECTIOUS D ISEASE SPREAD 3 Pin to, Mend es Lop es and Mac hado ( 2012 ), for a review of p ow er la ws]. Lil- jeros et al. ( 2001 ) rep orted on a p ow er-la w distr ibution of th e num b er of sexual p artners, and Alb ert and Barab´ asi ( 2002 ) r eview recent adv ances in net work theory includ in g scale-free netw orks w h ere the n umber of edges is distributed according to a p o wer la w. Interestingly , a p o w er la w wa s also used as the distance deca y function in geographic profiling for serial vio- len t crime in vestiga tion [Rossmo ( 2000 )] as well as in an application of this tec hnique to id en tify en vironm en tal sources of infection [Le Comb er et al. ( 2011 )]. Ex amp les of p o w er-law transmission k ernels to mo d el the s p atial dynamics of infectious diseases can b e found in plant epidemiology [Gibson ( 1997 ), S oub eyrand et al. ( 2008 )] and in mo dels for the 2001 UK fo ot-and- mouth disease epidemic [Chis Ster and F erguson ( 2007 )]. Recen tly , Geilh u fe et al. ( 2014 ) found that u sing (fixed) p o wer-la w w eigh ts b et ween regions p erformed b etter than real traffic data in predicting in fl uenza count s in Northern Norwa y . In b oth mo dels for spatio-temp oral sur v eillance data pr e- sen ted in the follo w in g sections, the p o wer la w will b e estimated jointly with all other un k n o wn parameters. S ince the c h oice of a p o w er law is a strong (y et we ll motiv ate d) assumption, a comparison with alternativ e qualitativ e form u lations is pr o vided. This pap er is organised as follo ws: in Sections 2 and 3 , resp ective ly , the t wo mo del framew orks are reviewe d and extended w ith p o wer-la w form u lations for the spatial interact ion of u nits. In Section 4 surveilla n ce d ata on in v asive meningo co ccal disease (IMD) and infl uenza are reanalysed using p o wer la ws and alternativ e qualitativ e approac hes to b e ev aluated against p reviously used mo dels for th ese data. W e close with s ome discussion in Section 5 and a soft ware o ve rview in the App end ix . Th e pap er is accompanied b y animations ( Supp lemen t A ) and further sup p lemen tary material [Supplement B: Mey er and Held ( 2014 )]. 2. In dividual-lev el mo del. 2.1. Intr o duction. The sp atio-te mp oral p oint p r o cess mo del pr op osed b y Mey er, Elias and H¨ ohle ( 2012 ) is d esigned for time–space-mark data { ( t i , s i , m i ) : i = 1 , . . . , n } of individual case r ep orts to describ e the occur- rence of in fections (‘ev ents’) and their p oten tial to trigger secondary cases. F ormally , the m o del c haracterises a p oint pro cess in a region W observed during a p erio d (0 , T ] through the conditional intensit y function λ ( t, s ) = ν [ t ][ s ] ρ [ t ][ s ] + X j : t j 0 and σ = 5 . 2.2. Power-law extension. The b asic p ow er la w f ( x ) = x − d , d > 0, is not a suitable choic e f or the distance deca y of infectivit y since it has a p ole at x = 0. F or x ≥ σ > 0, x − d is the kernel of a Pareto densit y , b ut a shifted v ersion to the domain R + 0 , known as Pareto typ e I I and sometimes named after Lomax ( 1954 ), has density k ernel f ( x ) = ( x + σ ) − d ∝ 1 + x σ − d (3) [see Figure 1 (a)]. Note that there is n o need for the spatial interac tion func- tion to b e normalised to a densit y . It is actually more closely related to correlation fun ctions kno wn fr om stationary random field mo dels for geo- statistica l data [Chil ` es and Delfiner ( 2012 )]. F or instance, the r escaled ver- sion (1 + x/σ ) − d is a mem b er of the Cauc hy class in tro d uced by Gneiting and Schlather ( 2004 ), w h ic h provides asym p totic p o wer-la w correlation as x → ∞ . F or sh ort-range tra vel within 10 km, Bro ckmann, Hufn agel and Geisel ( 2006 ) found a un iform distrib ution instead of p o wer-la w b ehavio ur, whic h suggests an alternativ e formulat ion with a “lag ged” p o wer la w: f ( x ) = 1 , for x ≤ σ , x σ − d , otherwise. (4) Spatial in teraction is now constan t u p to the c h ange p oin t σ > 0, follo w ed by a p o wer-la w deca y for larger distances [see Figure 1 (b)]. A s imilar k ernel was used by Deardon et al. [( 201 0 ), therein called “ge ometric”] for th e 2001 UK fo ot-and-mouth disease epidemic, add itionally limiting spatial interact ion to a presp ecified upp er-b ound d istance. 6 S. MEYER AN D L. HELD A change- p oint- free k ern el also unifying intended short-range and long- range c h aracteristics is the Student k ernel f ( x ) = ( x 2 + σ 2 ) − d ∝ 1 + x σ 2 − d (5) with scale parameter σ and sh ap e (deca y) paramete r d [see Figure 1 (c)]. This ke rnel imp lemen ts a p o wer la w of the squared d istance and is kno w n as the ‘Cauch y mo del’ in geostatistics [Chil ` es and Delfiner ( 2012 )]. F or d > 0 . 5, it describ es a Student distribu tion w ith 2 d − 1 degrees of freedom. T o in vestig ate the appropriateness of the assumed p o w er-law deca y , w e also estimate an u n constrained step function f ( x ) = K X k =0 α k 1 ( x ∈ I k ) , (6) whic h corresp onds to treating th e distance x —categorised in to consecutiv e in terv als I k —as a qualitativ e v ariable. 2.3. Infer enc e. Mo d el parameters are estimated via maximization of th e full (log-)lik eliho o d, applying a quasi-Newton algorithm with analytical gra- dien t and Hessian [see Mey er and Held ( 2014 ), S ection 1.1]. W e estimate k ern el p arameters on th e log-scale to a vo id constrained optimization. F or the step fun ction, α 0 = 1 is fixed to ensu re iden tifi ab ility . The p oin t pro cess lik eliho o d incorp orates the integral of f 2 ( s ) o v er shifted v ersions of the observ ation region W , which is repr esen ted by p olygons. Similar in tegrals arise for the partial deriv ativ es of f 2 ( s ) in the score function and app r o ximate Fisher inf ormation. Except for the step function ke rnel ( 6 ), this requires a metho d of numerical inte gration suc h as the t wo-dimensional midp oint rule with an adaptiv e bandwidth, whic h w as found to b e b est suited for the Gaussian kernel [Mey er, Elias and H¨ ohle ( 2012 )]. F or the other k ern els we use a more sop h isticated appr oac h in spired b y pr o duct Gauss cubature o v er p olygons [S ommariv a and Vianello ( 2007 )]. This cubature rule is based on Green’s theorem, whic h relates the double in tegral o v er the p olygon to a line in tegral along the p olygon b ou n dary . Its efficiency can b e greatly impr o ve d in our sp ecific case b y taking analytica l adv anta ge of the isotrop y of f 2 , after w hic h numerical int egration remains in only one dimension [see Mey er and Held ( 2014 ), Section 2.4]. Regardless of any sophisticated cub ature rule, the r equ ired int egration of f 2 o ve r n p olygons in the log-lik eliho o d is the part that mak es m o del fitting cumb ersome: it in tro duces n u m erical errors wh ic h ha ve to b e con trolled such that they do not corrupt numerical lik eliho o d maximization, and it increases compu tational cost by several orders of magnitude. F or ins tance, in our IMD application in Section 4.1 a single lik eliho o d ev aluation would only tak e 0.02 seconds if POWER-LA W MODELS FOR INFECTIOUS D ISEASE SPREAD 7 w e us ed a constan t sp atial interac tion fu nction f ( x ) ≡ 1, wh ere the in tegral do es not dep end on parameters b eing optimised and simply equals the area of the p olygonal domain. F or the Gaussian k ernel, a single ev aluatio n tak es ab out 5 seconds, the step function tak es 7 seconds, and the p o wer la w and Student k ernel take ab out 20 seconds. The ab ov e and all follo wing runtime statemen ts refer to tota l C PU time at 2.80GHz (real elapsed time is shorter since some computations r un in parallel on multiple CPUs). 3. C oun t data mo del. 3.1. Intr o duction. The multiv ariate time-series mo d el established by Held and Paul ( 2012 ) [see also Paul and Held ( 2011 ), Paul, Held and T osc h k e ( 2008 ), Held, H¨ ohle and Hofmann ( 2005 )] is designed for sp atially and tem- p orally aggregated surveilla nce data, that is, disease coun ts Y it in regions i = 1 , . . . , I and p erio ds t = 1 , . . . , T . F ormally , the counts Y it are assu med to follo w a negativ e binomial distribu tion Y it | Y · ,t − 1 ∼ Neg Bin ( µ it , ψ ) , i = 1 , . . . , I , t = 1 , . . . , T with additiv ely decomp osed mean µ it = ν it e it + λ it Y i,t − 1 + φ it X j 6 = i w j i Y j,t − 1 , (7) and o verdisp ersion parameter ψ suc h that the conditional v ariance of Y it is µ it (1 + ψ µ it ). T h e P oisson distribution results as a sp ecial case if ψ = 0. In ( 7 ), the first term represents the endemic comp onent similar to the p oint p ro cess mo del ( 1 ). The end emic mean is prop ortional to an offset of known exp ected coun ts e it t ypically reflecting the p opulation at risk. The other tw o comp onents are observ ation-driv en epidemic comp onents: an autoregression on the num b er of cases at the previous time p oint, and a “spatio-temporal” comp onent capturin g transmission from other units. Note th at without these epidemic comp onen ts, the mo del would reduce to a negativ e binomial regression mo d el for indep end en t observ ations. Eac h of ν it , λ it , and φ it is a log-linear predictor of the form log( · it ) = α ( · ) + b ( · ) i + β ( · ) ⊤ z ( · ) it (where “ · ” is one of ν , λ , φ ), con taining fi xed and region-sp ecific intercepts as well as effects of exogenous co v ariates z ( · ) it including time effects. F or example, in the infl uenza application in Section 4.2 , z ( ν ) it = ( t, sin(1 · ω t ) , cos(1 · ω t ) , . . . , sin( S · ω t ) , cos( S · ω t )) ⊤ describ es an endemic time trend w ith a sup erp osition of S harmonic wa v es of fu ndament al frequency ω = 2 π / 52 [Held an d Pa u l ( 2012 )]. Th e random 8 S. MEYER AN D L. HELD effects b i := ( b ( λ ) i , b ( φ ) i , b ( ν ) i ) ⊤ accoun t for heterogeneit y b et ween regions, and are assum ed to follo w indep endently a triv ariate norm al distribution w ith mean zero and co v ariance m atrix Σ . Accounting for correlation of r andom effects across regions is p ossible by adopting a conditional autoregressiv e (CAR) mo del [Pa ul and Held ( 2011 )]. The weigh ts w j i of th e sp atio-temporal comp onent in ( 7 ) describ e the strength of transmission fr om region j to region i , collecte d into an I × I w eight matrix ( w j i ). In con trast to the ind ividual-lev el mo d el, all of the Y j,t − 1 cases of the neigh b our j b y aggregation con tribu te with the same w eight w j i to infections in region i . In p r evious w ork, these w eights we re assumed to b e kno wn and restricted to firs t-order neigh b our s: w j i = 1 /n j , for i ∼ j , 0 , otherwise, (8) where the symbol “ ∼ ” denotes “is adjacen t to” and n j is the n umber of direct (first-order) neigh b ours of region j . T his is a normalised v ersion of the “ra w” adjacency in d icator matrix A = ( 1 ( i ∼ j )) j,i =1 ,...,I , wh ic h is binary and symmetric. T he idea b ehind normalisation is that eac h region j distributes its cases un iformly to its n j neigh b ours [P au l, Held and T osc h k e ( 2008 )]. Accordingly , the weig h t m atrix is normalised to pr op ortions suc h that all ro ws sum to 1. A simple alternativ e weig h t m atrix considering only first- order neigh b ours w ould result from the definition w j i = 1 /n i for i ∼ j (i.e., columns su m to 1), meaning that the n um b er of cases in a region i at time t is promoted by the mean of the neigh b ours at time t − 1. Ho wev er, th e first defin ition seems more natural in th e fr amew ork of br anc hin g p ro cesses, where the p oin t of view is f r om the infectiv e sour ce. F urth er m ore, the factor 1 /n i w ould b e confounded with the r egion-sp ecific effects b ( φ ) i . In either case, with the ab o ve w eight matrix, the ep idemic can only spread to fi r st-order neigh b ours durin g the p erio d t → t + 1 , except for indep en- den tly imp orted cases via the endemic comp onen t. Th is ignores the abilit y of humans to tra ve l further. In what follo ws, we prop ose a parametric gen- eralisation of the neigh b ourho o d w eights: a p ow er la w. 3.2. Power-law extension. T o implement the p o wer-la w pr inciple in the net work of geographical regions, we first need to define a d istance measur e on whic h the p ow er la w acts. There are t w o natur al c hoices: Euclidean distance b et w een cen troid coord inates and the order of n eigh b ourho o d . The fi rst one conforms to a co n tinuous pow er la w, whereas the second one is discrete. Ho we v er, using cen tr oid co ordin ates interferes with the area and shap e of the regions. S p ecifically , a tiny neigh b ouring region w ould b e attributed a stronger link than a large neighbour with centroid fu rther apart, ev en if the latter sh ares more b oundary than the tiny region. Usin g the common POWER-LA W MODELS FOR INFECTIOUS D ISEASE SPREAD 9 b ound ary length as a measur e of “coupling” [Keeling an d Rohani ( 2002 )] w ould only co ver adjacent regions. W e thus opt for the discrete measure of neigh b ourho o d order. F ormally , a region j is a k th-order neigh b our of another region i , den oted o j i = o ij = k , if it is adjacen t to a ( k − 1)th -order n eigh b our of i and if it is not itself a neigh b our of order k − 1 of region i . In other w ords, t wo regions are k th-order neighbour s, if the shortest route b et ween them has k s teps across distinct regio n s. The net work of regions thus features a symmetric I × I matrix of neigh b ourho o d orders with zero es on the diagonal b y con v en tion. Giv en this discrete distance measure, we generalise the p reviously u sed first-order w eigh t matrix to higher-order neighbour s assuming a p o wer la w with deca y parameter d > 0: w j i = o − d j i (9) for j 6 = i and w j j = 0. This ma y also b e recognised as the k ernel of the Zipf ( 1949 ) probability distribution. The raw p o wer-la w w eights ( 9 ) can b e normalised to w j i = o − d j i P I k =1 o − d j k (10) suc h that P I k =1 w j k = 1 for all rows j of the weigh t matrix. The higher the deca y p arameter d , the less imp ortan t are higher-order n eigh b ours. The limit d → ∞ corresp onds to th e previously u sed first-order dep endency , whereas d = 0 wo u ld assign equal weigh t to all regions. Similarly to the p oint pro cess mo delling in Section 2.2 , w e also estimate the w eights in a qualitativ e wa y b y treating the order of n eigh b ourho o d as a factor: w j i = M − 1 X o =1 ω o · 1 ( o j i = o ) + ω M · 1 ( o j i ≥ M ) . (11) Aggregat ion of higher orders ( o j i ≥ M ) is necessary since the a v ailable infor- mation b ecomes increasingly sp arse. As b efore, th e unconstrained weigh ts ( 11 ) can b e normalised to w j i / P I k =1 w j k . 3.3. Infer enc e. W e set ω 1 = 1 for iden tifiabilit y and estimate the deca y parameter d an d the unconstrained weig h ts ω 2 , . . . , ω M on the log-scale to enforce p ositivit y . S upplied with the enhanced score fu nction and Fisher information matrix, estimation of parametric w eights is still p ossib le within the p enalised lik eliho o d framew ork established b y P aul and Held ( 2011 ) [see also Mey er and Held ( 2014 ), S ection 1.2]. The authors argue, how ev er, that classical mo del choice criteria such as Ak aik e’s In formation Criterion 10 S. MEYER AN D L. HELD (AIC) cannot b e used straigh tforwardly for mo dels with random effects. Therefore, p erf orm ance of th e p o wer-la w mo dels and the p revious first-order form u lations is compared by one-step-ahead forecasts assessed with strictly prop er scoring r ules: th e logarithmic score (logS) and the ranked p r obabilit y score (RPS) adv o cated b y Czado, Gneiting and Held ( 2009 ) f or count data: logS( P , y ) = − log P ( Y = y ) , RPS( P , y ) = ∞ X k =0 [ P ( Y ≤ k ) − 1 ( y ≤ k )] 2 . These scores ev aluate th e discrepancy b et ween the predictiv e d istribution P f rom a fi tted mo del and the later observed v alue y . Thus, low er scores corresp ond to b etter predictions. Note that th e infinite sum in the RP S can b e approximat ed by tru ncation at some large k in a w a y suc h that a p resp ecified absolute approximat ion error is mainta ined [W ei an d Held ( 2014 )]. Such scoring rules ha v e already b een used for previous analyses of the infl uenza surveill ance d ata [Held and P au l ( 2012 )]. Along these lines, one- step-ahead pred ictions and asso ciated scores are computed and statistical significance of the difference in mean scores is assessed usin g a Mont e-Carlo p ermutatio n test for paired d ata. 4. A pplications. W e no w apply the p o wer-la w formulatio n s of b oth mo d el framew ork s to p r eviously analysed su rv eillance data and inv estigat e p oten- tial impro v ements with resp ect to predictive p erformance. W e in v estigate the appropriateness of the p o wer-la w s hap e by alternativ e qu alitativ e esti- mates of sp atial inte r action. In S ection 4.1 635 individ ual case rep orts of IMD caused b y the t wo most common bacterial finetypes of meningo co cci in German y from 2002 to 2008 are analysed with the p oin t pr o cess mo d el ( 1 ). I n Section 4.2 the m u ltiv ariate time-series mo del ( 7 ) is applied to w eekly n u m b ers of rep orted cases of influenza in the 140 administrativ e districts of the federal states Ba v aria and Baden-W ¨ urttem b erg in S outhern German y from 2001 to 2008. In Section 4.3 w e ev aluate a simulation-based long-term forecast of the 2008 influ en za wa v e. Space–time animations of b oth su rv eil- lance data sets are p ro vided in Supp lemen t A . 4.1. Cases of invasive meningo c o c c al dise ase in Germany, 2002–200 8 (se e Figur e 2 ). In th e original analysis of the IMD data [Mey er, Elias and H¨ ohle ( 2012 )], comprehensiv e AIC-b ased m o del s electio n yielded a linear time trend, a sinusoidal time-of-y ear effect ( S = 1), and no effect of the (lagged) n u m b er of lo cal in fluenza cases in the end emic comp onent. The epidemic comp onent in clud ed an effect of the meningo co ccal finetype (C:P1.5,2:F3-3 b eing less infectious than B:P1.7-2, 4:F1-5 , abbr eviated b y C and B in the POWER-LA W MODELS FOR INFECTIOUS D ISEASE SPREAD 11 (a) Spatial p oin t pattern with dot size (b) Monthly aggrega ted time series and prop ortional to the number of cases at evol ution of th e cumulativ e num b er of cases the resp ective location (p ostco de level) (by d ate of sp ecimen sampling) Fig. 2. Distr ibution of the 635 IMD c ases in Germany, 2002–2008, c ause d by the two most c omm on m eningo c o c c al finety p es B:P1.7-2,4: F1-5 (335 c ases) and C:P1.5, 2:F3-3 (300 c ases), as r ep orte d to and typ e d by the German R efer enc e Centr e for Meningo c o c ci . follo wing), a s mall age effect (3–18 yea r old patien ts tending to b e more in - fectious), and supp orted an isotropic Gaussian sp atial interac tion fun ction f compared to a homogeneous sp atial spread [ f ( x ) ≡ 1 ]. The analysis assumed constan t infectivit y o ve r time unt il 30 da ys after infection when infectivit y v anishes to zero, that is, g ( t ) = 1 (0 , 30] ( t ). In this pap er, we replace the Gaus- sian k ernel in the s elected mo del by the prop osed p o wer-la w distance deca y ( 3 ) to inv estigate if it b etter captures the dyn amics of IMD spr ead. Note th at the d istinction b et ween t w o finet yp es in this application ac- tually corresp onds to a mark ed v ersion of the p oint pro cess mo del. It is describ ed by an in tensity function λ ( t, s , k ), w here the sum in ( 1 ) is re- stricted to previously infected individuals with bacterial fin et yp e k , since w e assume th at infections of differen t fi net yp es are not asso ciated via trans- mission [Mey er, Elias and H¨ ohle ( 2012 )]. F or conv enience, we kept n otation simple and comparable to the m ultiv ariate time-series mo del of Section 3 . Prior to fitting p oint p r o cess mo dels to the IMD data, the in terv al- censored nature of the data caused by a restricted resolution in space and time has to b e take n into accoun t: w e only observe d dates and residence p ostco des of the cases (implicitly assum ing that infections effectiv ely h ap- p ened within the residen tial neighbour ho o d). This mak es the data in terv al- censored, yielding tied observ ations. Ho wev er, ties are n ot compatible with our (con tin u ous-time, con tin uous-space) p oin t pro cess mo d el since observing t wo ev en ts at the exact same time p oin t or location h as zero probabilit y . In 12 S. MEYER AN D L. HELD the original analyses with a Gaussian kernel f , ev ent s we re untied in time b y subtracting a U (0 , 1)-distrib u ted random n um b er fr om all obs erv ed time p oint s [Mey er, Elias and H¨ ohle ( 2012 )], that is, random sampling within eac h da y , wh ich is also the pr eferred metho d u sed by Diggle , Kaimi and Ab ellana ( 2010 ). T o identify th e tw o-parameter p o wer la w ( x + σ ) − d , it w as ad d ition- ally necessary to break ties in space, sin ce otherwise log σ div erged to −∞ , yielding a p ole at x = 0. A p ossible solution is to shift all lo cations r andomly in space w ith in their r ound-off in terv als similar to the tie-breaking in time. Lac king a sh ap efile of the p ostco de r egions, we shif ted lo cations by a v ector uniformly drawn from the disc with radiu s ε/ 2, where ε is the m inim u m ob- serv ed spatial separation of distinct p oints, h ere ε = 1 . 17 km. Accordingly , a sens itivit y analysis was conducted by app lying th e random tie-breaking in time and space 30 times and fitting the mo dels to all replicates. Figure 3 (a) disp lays estimate d spatial interac tion functions—appropriately scaled by exp ( ˆ γ 0 )—together with confidence interv als and estimates from the sensitivit y analysis (see T able 1 for v alues of ˆ γ 0 , ˆ σ , and ˆ d ). The p ow er la w puts muc h m ore wei gh t on lo calised transm iss ions with an initially faster distance d eca y of infectivit y . F urthermore, it features a heavie r tail than the Gaussian kernel, which facilitates the geographical spread of IMD b y o cca- sional long-range transmissions. Maps of th e accum u lated epidemic intensit y [Mey er and Held ( 2014 ), Figure 1] visualise the impact of the p ow er la w on the mo delled infectivit y . Sensitivit y analysis shows th at AIC clearly prefers the new p o wer-la w k ern el against th e Gaussian ke rnel (mean ∆ AIC = − 27 . 6, (a) Po wer la ws vs. th e Gaussian kernel (b) Po wer la w vs. a step fun ction Fig. 3. Estimate d sp atial inter action functions—appr opriately sc ale d by the epidemi c inter c ept exp ( γ 0 ) . The dashe d l ines r epr esent 95% c onfidenc e intervals obtaine d as the p ointwise 2. 5% and 97.5% quantiles of the functions evaluate d for 999 samples fr om the asymptotic multivariate normal di stribution of the affe cte d p ar ameters. The light gr ey lines ar e estimates obtaine d fr om a sensitivity analysis with r ep e ate d r andom tie-br e aking. POWER-LA W MODELS FOR INFECTIOUS D ISEASE SPREAD 13 T able 1 Par ameter estimates and 95% Wald c onfidenc e i ntervals for the Gauss ian and the p ower-law mo del. Re sults for the Gaussian kernel ar e slightly differ ent fr om those r ep orte d by M eyer, Elias and H¨ ohle ( 2012 ) due to i mpr ove d numeric al inte gr ation. Note that we use the symb ol σ for the sc ale p ar ameter and d for the de c ay p ar ameter in al l sp atial inter action functions, but these p ar ameters as wel l as γ 0 ar e not dir e ctly c omp ar able (inste ad se e Figur e 3 ) Gaussian k ernel ( 2 ) Po wer-la w kernel ( 3 ) Estimate 95% CI Estimate 95% CI β 0 − 20 . 53 − 20 . 62 to − 20 . 44 − 20 . 58 − 20 . 68 to − 20 . 47 β trend − 0 . 05 − 0 . 09 to − 0 . 00 − 0 . 05 − 0 . 09 to 0 . 00 β sin 0 . 26 0 . 14 to 0 . 39 0 . 26 0 . 12 to 0 . 39 β cos 0 . 26 0 . 14 to 0 . 39 0 . 27 0 . 14 to 0 . 40 γ 0 − 12 . 53 − 13 . 15 to − 11 . 91 − 6 . 21 − 9 . 32 to − 3 . 10 γ C − 0 . 91 − 1 . 44 to − 0 . 39 − 0 . 80 − 1 . 31 to − 0 . 29 γ 3 − 18 0 . 67 0 . 04 to 1 . 31 0 . 78 0 . 11 to 1 . 45 γ ≥ 19 − 0 . 29 − 1 . 19 to 0 . 61 − 0 . 18 − 1 . 11 to 0 . 75 σ 16 . 37 13 . 95 to 19 . 21 4 . 60 1 . 80 to 11 . 71 d 2 . 47 1 . 80 to 3 . 39 SD = 1 . 5). The S tudent k ernel represent s a compromise b et ween the other t wo parametric ke r nels with short-range prop erties similar to the Gaussian k ern el but with a hea vy tail. Ho wev er, AIC impr o ve men t is not as large as for the ab ov e p o wer la w (mean ∆ AIC = − 15 . 5, SD = 0 . 9). F or these thr ee k er n els, sensitivit y analysis of the random tie-breaking pro cedure in space and time generally confirm ed the r esults. The Gaussian k ern el w as least affecte d by the s mall-scale p erturb ation of ev en t times and lo cations. S ome replicates for the p o wer-la w m o del yielded a sligh tly steep er shap e, whic h is due to closely located p oin ts after random tie-breaking. Su c h an artifact w ould ha ve b een a voi ded if we had u sed constrained sampling in that the ran d omly shifted p oin ts ob ey a minim um separation of sa y 0.1 km . The estimated lagged v ersion of the p o wer la w ( 4 ) is shown in Supp le- men t B [Mey er and Held ( 2014 ), Figure 2]. It has a uniform short-range disp ersal radius of ˆ σ = 0 . 40 (95% CI: 0.18 to 0.8 6) kilometres. Ho wev er, suc h a sm all σ is not inte rpretable sin ce it is actually not co vered by the spatial resolution of the data. Accordingly , the 30 estimates of the sensitiv- it y analysis are more d isp ersed, as is the go o d ness of fit compared to the Gaussian ke rnel (mean ∆ AIC = − 21 . 1, SD = 3 . 8). Figure 3 (b) shows a comparison of the estimated p o wer la w with a step function ( 6 ) for spatial interacti on. An upp er b oun dary kn ot had to b e s p ec- ified, which w e set at 100 kilometres, w here th e step fu nction d rops to 0. W e c hose six kn ots to b e equ id istan t on the log-scale within [0 , log (100)], that is, steps at 1.9, 3.7, 7.2, 13.9 , 26.8, and 51.8 kilometres. Estimatio n 14 S. MEYER AN D L. HELD to ok only 72 seconds due to th e analytical im p lemen tation of the inte gra- tion of f 2 o ve r p olygonal domains, wher eas the p o wer-la w mo del to ok 42 min utes. T h e p o w er la w is well confirmed by the step fu nction; it is almost completely en closed b y its 95% confid ence int erv al. Th e step function su g- gests an ev en steep er initial deca y and has a sligh tly b etter fit in terms of AIC (mean ∆ AIC = − 6 . 9, SD = 4 . 0 compared to the p o w er law). Ho wev er, it dep ends on the c h oice of knots, it is sensitiv e for artifac ts of the data and forfeits m onotonicit y , whic h con tradicts T obler’s first law of ge o g r aph y [T obler ( 1970 )]. P arameter estimates and confi dence in terv als for the Gaussian and th e p o w er-law mo d el are presente d in T able 1 [see Meyer and Held ( 2014 ), T a- ble 1, for p arameter estimates of the other mo dels]. T he parameters of the endemic comp onent c haracterising time tr end and seasonalit y w ere not af- fected by the c h ange of the shap e of spatial interac tion, and also the epidemic co efficien ts of fi net yp e and age group do not d iffer m u c h b et ween the m o d- els r etaining their s igns and orders of magnitude. F or instance, also with the p o w er -law k ernel, the C-t yp e is approxima tely half as infectious as the B-t yp e, wh ic h is estimated b y the multiplica tiv e t yp e-effect exp( ˆ γ C ) = 0 . 45 (95% CI: 0.27 to 0.75) on the force of infection (t yp e B is the reference catego ry here). An imp ortan t qu an tit y in epidemic mo delling is the exp ected num b er R of offspring (secondary infections) eac h case generates. This repro du ction n u m b er can b e deriv ed from the fitted mod els f or eac h ev ent b y int egrating its triggering function η j g ( t − t j ) f ( k s − s j k ) o v er the observ ation r egion W and p erio d [ t j , T ] [Mey er, Elias and H¨ ohle ( 2012 )]. Typ e-sp ecific estimates of R are then obtained by a veragi ng o ve r the ind ividual estimates b y fin etype. T able 2 shows that the rep r o duction num b ers b ecome slight ly larger, whic h is related to the hea vier tail of the p o w er la w enabling additional inte raction b et w een ev ent s at far distances. W e close this application with t w o additional ideas for imp ro vemen t of the mo del. First, it migh t b e wo rth considering a p opulation effect also in the epidemic comp on ent to reflect h igher con tact rates and thus in fectivit y in regions with a denser p opulation. Usin g the log-p opulation densit y of th e T able 2 T yp e-sp e cific r epr o duction numb ers with 95% c onfidenc e i ntervals (b ase d on 199 samples fr om the asymptotic multivariate normal distribution of the p ar ameter estimates) Gaussian k ernel ( 2 ) Po wer-la w k ernel ( 3 ) Estimate 95% CI Estimate 95% CI B 0.22 0.17 to 0.31 0.26 0.10 to 0.35 C 0.10 0.06 to 0.15 0.13 0.0 5 to 0.19 POWER-LA W MODELS FOR INFECTIOUS D ISEASE SPREAD 15 infectiv e’s distr ict, log ρ [ t j ][ s j ] , the corresp onding parameter is estimated to b e ˆ γ log( ρ ) = 0 . 21 (95% CI: − 0.07 to 0.48), that is, ind ividual infectivit y scales with ρ 0 . 21 , where ρ ranges fr om 39 to 4225 km 2 . Although the p ositiv e p oint estimate supp orts this idea, the wide confiden ce in terv al does not reflect strong evidence for su c h a p opulation effect in the I MD data. Ho we v er, it is helpful to allo w for sp atial heterogeneit y in the endemic comp onent . F or in s tance, an in dicator f or districts at the b ord er or the distance of th e district’s cen troids from the b ord er could serve as proxies for simple edge effects. The idea is that as w e get closer to the edge of the observ ation windo w (German y) more infections will originate from external sources n ot directly link ed to the observ ed history of the epidemic within German y . W e thus mo d el a spatially v arying risk of imp orting cases through the endemic comp onent. F or the Greater Aac hen Region in the cen tral-we st part of German y , where a sp atial disease cluster is apparen t in Figur e 2 (a), suc h a cross-b ord er effect with the Net herlands wa s indeed iden tifi ed by Elias et al. ( 2010 ) for th e serogroup B finetype du ring our observ ation p erio d using molecular sequence typing of bacterial strains in in fected patien ts fr om b oth coun tr ies. In clusion of an ed ge ind icator in the endemic cov ariates z [ t ][ s ] impro v es AIC b y 5 with an estimated rate ratio of 1.37 (95% C I : 1.10 to 1.70) for districts at the b order v ersus in ner districts. If we instead use the distance to th e b order, AIC imp ro ves by 20 with an estimated r isk r eduction of 5.0% (95% CI: 3.0% to 7.0%) p er 10 km increase in distance to the b order. 4.2. Influenza su rveil lanc e data fr om Southern Germany, 2001–2 008 (se e Figur e 4 ). The b est mo del (with resp ect to logS and RPS) for the in fluenza (a) Mean yearly incidence p er 100,000 (b) W eekly num b er of cases inhabitants Fig. 4. Sp atial and temp or al distribution of r ep orte d i nfluenza c ases in the 140 districts of Bavaria and Baden-W¨ urttemb er g during the ye ars 2001 to 2008. 16 S. MEYER AN D L. HELD surve illance d ata found b y Held and Pa ul ( 2012 ) using normalised fi rst-order w eights in cluded S = 1 sinusoidal wa v e in eac h of the autoregressiv e ( λ it ) and sp atio-temporal ( φ it ) comp onen ts and S = 3 harmonic wa v es with a linear trend in the endemic comp onent ν it with the p op u lation fr action e i in region i as offset. W e n o w fit an extended mo del by estimating (ra w or normalised) p ow er-la w neighbour ho o d we igh ts ( 9 ) or ( 10 ) as describ ed in Section 3.2 , whic h r eplace the previously us ed fixed adjacency ind icator. Figure 5 (a) sh ows the estimated normalised p o wer la w with ˆ d = 1 . 80 (95% CI: 1.61 to 2.01). This d eca y is r emark ably close to the p ow er-la w exp on ent 1.59 estimated by Bro c kmann , Hu fnagel and Geisel ( 2006 ) for short-time tra vel in the USA with resp ect to distance (in kilometres), eve n though neigh b ourho o d ord er is a discretised measure with n o one-to-one corr esp on- dence to Euclidean distances, and tra vel b ehavio ur in the USA is p oten tially differen t fr om that in South ern German y . T he plot also shows the estimated unconstrained w eigh ts for comparison with the p o wer law. Th e sixth ord er of n eigh b ourho o d was the highest f or whic h w e could estimate an individu al w eight; h igher orders had to b e aggregated corresp ond ing to M = 7 in ( 11 ). The un constrained weig h ts decrease monotonically and resem ble nicely th e estimated p o wer law, whic h is enclosed b y the 95% confidence interv als (ex- cept for order 5, w hic h has a s ligh tly higher weig h t). T he results with ra w w eights are ve r y similar and sh o wn in Mey er and Held [( 2014 ), Figure 3]. Figure 5 (b) shows the estimated seasonal v ariation in the en d emic com- p onent and the course of the d ominan t eigen v alue [Held an d Paul ( 2012 )] for the normalised weig h t mo dels. The dominant eigen v alue is a combination of the t w o epidemic comp onents: if it is s m aller than 1, it can b e int erpreted as the ep id emic prop ortion of total disease incidence, otherwise it indicates an (a) Po w er-la w ( 10 ) and unconstrained (b) Seasonal v ariation of the end emic (top) w eights ( 11 ) with 95% confidence interv als and epidemic (b ottom) comp onents Fig. 5. Estimate d p ower-law and unc onstr ai ne d weights (a) , and se asonal variation (b) using normalise d weights. POWER-LA W MODELS FOR INFECTIOUS D ISEASE SPREAD 17 outbreak p erio d. Whereas the course of th is com bined measur e is more or less unchanged u p on accoun ting for higher-order neigh b ours with a p o wer la w, the w eigh t of the endemic comp onent d ecreases r emark ably . This go es hand in hand with an increased imp ortance of the spatio-te mp oral com- p onent since in the p o w er-law form u lation muc h more information can b e b orrow ed from the n u m b er of cases in other regions. Jumps of the epidemic to non ad j acen t r egions within one week are no longer dedicated to the en- demic comp onent only . Concerning the remaining coefficients, there is less o verdisp ersion in the p o w er-law mo d els (see ψ in T able 3 ), w hic h indicates r ed uced residual het- erogeneit y . F or the v ariance and correlation estimates of the random effects, there is no substan tial difference b et ween fir s t-order and p o wer-la w mo dels and ev en less b et we en raw and normalised form u lations. T o assess if the p o wer-la w form ulation impro v es the p revious fi rst-order mo del, their pr edictiv e p erform an ce is compared b ased on one-week- ahead predictions for all 140 regions and the 104 wee ks of the last tw o y ears. C om- puting these predictions for one mo del tak es ab out 3 hours, since it needs to b e refitted for ev ery time p oin t. T able 4 sh o ws the resu lting mean scores with asso ciated p -v alues. Both logS and RPS impro ve wh en accoun ting for higher-order neigh b ours with a p ow er la w, while the difference is only sig- nifican t for th e logarithmic score. F urthermore, the normalised formulati on p erforms sligh tly b etter than the raw we igh ts. F or instance, the mean dif- T able 3 Estimate d mo del p ar ameters (with standar d err ors) excluding inter c epts and tr end/se asonal c o efficients. The p ar ameter β ( φ ) log(pop) in the first r ow b elongs to a further extende d p ower-law (PL) mo del, whi ch ac c ounts for p opulation in the sp atio-te mp or al c omp onent (last c ol umn). The σ 2 · and ρ ·· p ar ameters ar e the varianc es and c orr elations of the r andom effe cts (fr om Σ ). The l ast r ow shows the final values of the p enali se d and mar ginal l o g-likeliho o ds Raw weigh ts Normalised w eights First order Po wer law First order Po wer law PL + pop. β ( φ ) log(pop) – – – – 0.76 (0.13) d – 1. 72 (0.10) – 1.80 (0.10) 1.65 (0.10) ψ 0.93 (0.03) 0.8 6 (0.03) 0.92 (0.03) 0.86 (0.03) 0.86 (0.03) σ 2 λ 0.14 0.17 0.13 0.17 0.16 σ 2 φ 0.94 0.92 0.98 0.89 0.71 σ 2 ν 0.50 0.67 0.51 0.67 0.66 ρ λφ 0.02 0.20 0.03 0.21 0.13 ρ λν 0.11 0.31 0.12 0.31 0.27 ρ φν 0.56 0.29 0.55 0.30 0.39 l p en ( l mar ) − 18,400 ( − 433) − 18,129 ( − 456) − 18,387 ( − 436) − 18,124 ( − 453) − 18,124 ( − 439) 18 S. MEYER AN D L. HELD T able 4 Me an sc or es of 104 × 140 one-we ek-ahe ad pr e di ctions over the last two ye ars, ac c omp anie d with p -values for c omp ari ng p ower-law and first-or der weights obtaine d via p ermutation tests with 19,999 r andom p ermutations. Note that the values obtaine d for normalise d first-or der weights ar e slightly di ffer ent fr om the ones publishe d by H el d and Paul ( 2012 ) due to a c orr e ction of a r e c or ding err or in the last we ek of the influenza data Raw weigh ts Normalised weigh ts logS RPS logS RPS First order 0.5522 0.4205 0. 5511 0.4194 P o w er law 0.5453 0.4174 0.544 8 0.4168 p -v alue 0.00005 0 .11 0.0001 0.19 ference in the logarithmic scores of the resp ectiv e p o wer-la w m o dels has an asso ciated p -v alue of 0.0009. In th e follo wing w e therefore only consider the normalised v ersions. F or add itional comparison, the simp le uniform w eight mo del ( w j i ≡ 1), which takes in to accoun t higher-order neigh b ours but w ith equal we igh t, has mean logS = 0 . 54 84 and mean RPS = 0 . 4215, and thus p erforms w orse th an a p ow er-la w d eca y and, according to the RPS , ev en w orse than first-order weig h ts. Similarly to the IMD analysis, fu rther impr o ve men t of th e mo del’s de- scription of human mobilit y can b e ac h iev ed by acc oun ting for th e district- sp ecific p opulation also in th e sp atio-te mp oral comp onen t. The idea is that there tends to b e more traffic to r egional con urb ations, that is, districts with a larger p opulation, wh ic h are th us exp ected to imp ort a bigger amoun t of cases from neighbour in g regions [Bartlett ( 1957 )]. Note that inclusion of the log-p opulation in z ( φ ) it affects su sceptibilit y rather than infectivit y , wh ic h is in verse to mo delling the f orce of in fection in the ind ividual-based fr ame- w ork. T he influen za data y ield an estimated co efficien t of ˆ β ( φ ) log(pop) = 0 . 76 (95% CI: 0.50 to 1.01), w hic h p ro vid es str ong evidence for such an agg lom- eration effect . The v ariance of the random effect b ( φ ) i of th e spatio-temp oral comp onent is sligh tly r educed from 0.89 to 0.71, reflecting a decrease in residual heterogeneit y b et ween districts. The deca y parameter is estimated to b e sligh tly smaller in the extended mo del [ ˆ d = 1 . 65 (95% CI: 1.45 to 1.86)] and all other effects remain approxima tely unchanged (see T ab le 3 ). Ho we v er, the p redictiv e p erformance impro ve s only minimally , for example, the logarithmic score decreases from 0.5448 to 0.5447 ( p = 0 . 66). Th is small c hange could b e related to the r andom effects b ( φ ) i , whic h rep lace parts of the p opulation effect if it is not included as a co v ariate. Indeed, there is cor- relation ( r Pe arson = 0 . 41) b et ween log(p op i ) and b ( φ ) i in the mo del without an exp licit p opulation effect in φ it [see the scatterplot in Mey er and Held ( 2014 ), Figure 5]. POWER-LA W MODELS FOR INFECTIOUS D ISEASE SPREAD 19 4.3. L ong-term for e c ast of the 2008 influenza wave. F or fur ther ev alua- tion of the p o wer-la w m o dels describ ed in Section 4.2 , we carry out a long- term forecast of the wa v e of influenza in 2008. Sp ecifically , we sim ulate the ev olution of the epidemic du ring the first 20 w eeks in 2008 for eac h mo d el trained b y the previous y ears and initialise d by the 18 cases of the last w eek of 2007 (see th e animation in Supp lemen t A , for their sp atial distribu tion). Predictiv e p erform an ce is then ev aluated b y the final size distribu tions and b y p rop er scoring rules assessin g the empir ical distribu tions in duced b y the sim u lated coun ts b oth in the temp oral and spatial domains. Sin ce the log- arithmic score is infin ite in the case of zero pr edictiv e probability f or the observ ed coun t, w e instead use the Da wid and Sebastiani ( 1999 ) score DSS( P , y ) = ( y − µ P ) 2 σ 2 P + log σ 2 P , where µ P and σ 2 P denote the mean and the v ariance of P [see also Gn eiting and Raftery ( 2007 )]. Figure 6 (a) shows the fi n al size d istributions of the simulated wa v es of influenza during the fir st 20 we eks of 200 8. Note that mod el complexity increases from top to bottom and that w e also considered the naiv e en- demic mo del, that is, ind ep endent count s, and the mo del without a spatio- temp oral comp onent as additional ben chmarks. The end emic-only mo d el, whic h decomp oses d isease in cidence in to spatial v ariatio n across districts, a seasonal and a log-linear time trend , o verestimate s the rep orted size of 5781 (a) Final size distributions ( √ -scale). The (b) Time series of observed (bars) and mean star in each b ox represents th e mean, and sim u lated ( dots) counts aggrega ted ov er all the vertical dashed line marks the districts. W eek 0 corresp onds to the initial observed final size of 5781 cases condition (2007-W52). The d ashed lines show the (scaled) RPS (see also T able 5 ) Fig. 6. Summary statistics of 1000 simulations of the w ave of i nfluenza during the first 20 we eks of 2008 f or five c omp eting mo dels. 20 S. MEYER AN D L. HELD T able 5 L ong-term pr e di ctive p erformanc e of 5 c omp eting mo dels i n the temp or al and sp atial dimensions me asur e d by me an D SS and RPS for the 2008 wave of influenza Mod el Time Space Space–time DSS RPS DSS RPS DSS RPS Endemic only 27.03 149.77 7.85 15.39 2.91 1.31 Endemic + autoregressiv e 31.36 112.15 7.59 15.04 2.58 1.26 First order 26.46 108.61 7.51 15.63 2.50 1.26 P o w er law 16.41 110.20 7.36 14.75 2.29 1.25 P o w er law + p opu lation 15.49 111.86 7.24 14.30 2.29 1.24 cases. It also do es not allo w for muc h v ariabilit y in the size of the outbreak as opp osed to the mo dels with epidemic p otent ial. The p o wer-la w mo dels sho w the greatest amoun t of v ariation but b est meet the rep orted final s ize: the p o wer-la w mo del without the p opulation effect yields a simulate d mean of 6022 (95% CI: 3126 to 10,808). The h u ge uncertain ty seems plausible with regard to the long forecast horizon o ve r a whole epidemic w av e. Figure 6 (b) sh o ws the time series of observ ed and mean simulated count s aggrega ted o ver all districts. In 2008, the wa v e grew tw o or more we eks earlier than in p revious y ears trained by the sin usoidal terms in th e thr ee comp o- nen ts. This p henomenon cann ot b e captured b y the simulatio n s, whic h are solely based on the observed pattern during 2001–20 07 and the distribu tion of the cases f rom the last week of 2007. F urther m ore, instead of tw o p eaks as observ ed sp ecifically in 2008 , the sim ulations yield a single, larger p eak where the p o w er-law mo dels on a verage indu ce the b est amplitudes with resp ect to final size. The simulate d sp atial distribu tion of the cases (see Figure 7 ) is v ery similar among the v arious mo d els and agrees qu ite well with the observed pattern. An imations of the observ ed and mean sim ulated epidemics provide more in sigh t ab out th e epid emic spread and are a v ailable in Supp lemen t A . It is difficult to see a clear-cut tr a ve ling-w a v e of in fluenza in the rep orted data, whic h suggests that b oth an endemic comp onent capturing immigra- tion as well as scale- free jumps via the spatio-t emp oral comp onent, that is, p o wer-la w w eight s w j i , are imp ortan t. Supp lemen t A also includ es an animated series of weekly probabilit y in tegral transform (PIT) h istograms [Gneiting, Balab d aoui and Raftery ( 2007 )] using the n onrandomised version for coun t data pr op osed b y Czado, Gneiting and Held ( 2009 ). These sequen- tial PIT histograms mainly refl ect the ab o ve time sh ift of the pred ictions. More clearly than the p lots, the mean scores in T able 5 show that predictiv e p erformance generally impro ves with increasing mo d el complexit y and use of a p o wer-la w deca y . POWER-LA W MODELS FOR INFECTIOUS D ISEASE SPREAD 21 Fig. 7. Observe d and me an simulate d incidenc e (c ases p er 100 000 inhabitants) aggr e- gate d over the 20 we eks for e c ast horizon (se e Figur e 6 of Supplement B for sc atterplots). 5. D iscussion. Motiv ated by the find ing of Bro c k m ann, Hufnagel and Geisel ( 2006 ) that short-time human trav el roughly follo ws a p ow er la w with resp ect to d istance, w e inv estigat ed a p o w er-law deca y of spatial dep endence b et w een infections in t wo m o delling framew ork s for spatio-temp oral sur veil- lance data. A spatio-temp oral p oin t pro cess mo del w as app lied to case r e- p orts of in v asiv e meningo co ccal d isease, and a m ultiv ariate time-series mo d el w as app lied to coun ts of in fluenza aggrega ted b y we ek and district. Since h u man mobilit y is an imp ortan t drive r of epidemic spr ead, the aim wa s to impro v e the p redictiv e p erform ance of these mo d els using a p o wer-la w trans- mission kernel with r esp ect to distance or neigh b ourh o o d order, resp ectiv ely , where the deca y is estimate d jointly with all other m o del parameters. In b oth applications considered , th e p o wer-la w formulat ions p erformed b etter than p reviously used naive Gaussian or fi rst-order inte raction mo d- els, resp ectiv ely . F urthermore, alternativ e piecewise constant, but otherwise unrestricted inte r action mo dels we re in line with the estimated p o wer la ws. This confirm s that the p o wer-la w distribu tion of short-time human tra ve l translates to the mo delling of infectious disease spread. W e note that the qualitativ e interacti on mo d els could b e rep laced by (cubic) smo othing s p line form u lations, either in a contin uous [Eubank ( 2000 )] or in discrete fash ion [F ahrmeir and Knorr-Held ( 2000 )]. In order to p enalise deviations from the p o w er law, this sh ould b e done on a log–log scale, where the p o wer la w is a 22 S. MEYER AN D L. HELD simple linear r elationship. Ho wev er, data-driv en estimation of the sm o othing parameter ma y b ecome difficult. The heavy tail of th e p o wer la w allo ws for long-range dep endence b et we en cases, whic h accordingly increased th e imp ortance of th e epidemic comp o- nen t in b oth m o dels. An alternativ e form ulation of spatial int eraction w ith o ccasional long-range transm iss ion wa s used by Diggle ( 2006 ), wh o added a sm all distance-indep end en t v alue to a p ow ered exp onential term of the scaled distance. Ho wev er, this offset and the p ow er parameter are p o orly iden tifi ed . F or the 2001 UK fo ot-and-mouth disease epidemic, Keeling et al. ( 2001 ) observe d a p o wer-la w-lik e, sharply p eak ed transm iss ion kernel, and Chis Ster and F erguson ( 2007 ) subsequently found that the p o wer law ( 3 ) yields a muc h b etter fit than the offset k ernel or other functional forms, whic h is in accordance with our results for the sp read of human infectious diseases. Regions at the edge of the observ ation windo w are missing p oten tial sources of inf ection from th e u nobserved side of the b order. T o capture unobserved h eterogeneit y due to immigration/edge effects, the count data mo del includ es region-sp ecific random effects b ( ν ) i in the endemic comp o- nen t. How ev er, there was no clear pattern in their estimate s with r esp ect to regions b eing close to the b ord er or not [Mey er and Held ( 2014 ), Figure 4]. In con trast, the IMD data sup p orted ed ge effects, sp ecifically concerning the b order to th e Netherland s. The spatial o ccurrence of cases met our simp listic approac h of includ ing the d istance to the b order as a co v ariate in the en- demic comp onent. Th is ignores that immigration migh t b e more imp ortant in large metrop olitan areas attracting p eople fr om abroad r egardless of the lo cation w ithin Germany . A b etter wa y of accoun ting for edge effects wo uld th u s b e to explicitly incorp orate immigration d ata. F or instance, Geilh ufe et al. ( 2014 ) used incoming r oad or air tr affic from outside North Norwa y as a proxy f or the risk of imp orting cases of infl uenza, w hic h led to im- pro ved predictiv e p erf ormance w hile also accoun ting for p opulation in the spatio-temp oral comp on ent. Scaling regional susceptibility by p opulation size prov ed v ery informa- tiv e also for influ enza in Southern German y: more p opulated regions seem to attract more infections f rom neigh b ours th an smaller regions, whic h re- flects comm uter-t yp e imp orts [see Vib ou d et al. ( 2006 ), and Keeling and Rohani ( 2008 ), Section 6.3 .3.1]. An exception of suc h a p opulation effect in the spatio-te mp oral comp onent m igh t b e seasonal accumulatio ns in lo w - p opulated touristic regions. In the p oin t pro cess mo del for the IMD cases, the effect of p opulation densit y on infectivit y wa s less evident, which might b e related to the very limited size of the p oint pattern with less than 100 cases p er y ear ov er all of German y . Another limitation of th e IMD d ata set is tied lo cations of cases due to censoring at th e p ostco de lev el. F or the p o wer law to b e id en tifiable, we POWER-LA W MODELS FOR INFECTIOUS D ISEASE SPREAD 23 randomly sampled th e lo cations from d iscs of radius 0.59 km around th e cen troid of the resp ectiv e p ostco de area, and v er ifi ed that our results are insensitiv e to the random seed. Note that c ho osing a larger rad iu s of, for example, 3 km , leads to less pr onounced weigh t to wards zero d istance but yields otherwise similar results, esp ecially concerning the relativ e p erfor- mance of the v arious interact ion functions. W e considered p o wer la ws as a description of spatial disp ersal of infectious diseases as motiv ated by human trav elling b eha viour . Concerning temp oral disp ersal, p ow er la ws are usually not an appropriate description of the ev o- lution of infectivit y o ver time. In f ectious diseases t yp ically f eature a very limited p erio d of infectivit y after the incub ation p erio d, since an in fected individual will receiv e treatmen t and t yp ically r estrict its in teraction radius up on th e app earance of symptoms. Due to the small num b er of cases in the IMD data, we could n ot estimate a parametric temp oral in teraction function g ( t ) and simp ly assumed constan t inf ectivit y du ring 30 da ys as in Meye r, Elias and H¨ ohle ( 2012 ). More generally , g ( t ) could represent an in cr easing lev el of infectivit y b eginning f rom exp osure, follo wed b y a plateau and then decreasing and ev entually v anishing infectivit y [Lawson and Leimic h ( 2000 ), Section 5.3]. In the m ultiv ariate time-series mo del, the coun ts we re restricted to only explicitly dep end on the previous we ek. This is reasonable if the gen- eration time, the time consumed by an infectiv e to cause a secondary case, is not larger than the aggreg ation time in the sur veilla nce data. F or human influenza, C o wling et al. ( 2009 ) rep ort a m ean generation time of 3.6 da ys (95% CI: 2.9 days to 4.3 da ys). Long-term simulat ed forecast of the 2008 influ enza w av e confirmed that the p o w er-law mo d el yields b etter predictions. Ho w ever, the mo del w as not able to describ e the ons et in 2008, whic h w as t wo weeks earlier than in the y ears 2001 –2007 . F or this to work, it wo u ld b e necessary to f urther enr ic h the mo del b y external pro cesses suc h as v acc ination co verag e [as in Herzog, P aul and Held ( 2011 )] or climate cond itions [F uhr mann ( 2010 ), Willem et al. ( 2012 )] entering as co v ariates in th e endemic and/or epidemic comp onent s. An alternativ e approac h has b een us ed by F ansha we et al. ( 2008 ), where seasonalit y parameters w ere allo wed to change fr om ye ar to yea r according to a random w alk mo del. Implement ation w ould then r equire Mark o v c hain Mon te Carlo or other more demand in g tec hniqu es for inference. Despite the op en issue of d ynamic seasonalit y , the simulat ed fi nal size and spatial distribution matc h ed the rep orted epidemic quite well . This success also suggests th at und er -r ep orting of influenza w as roughly constan t o v er time. F or instance, the 4 districts whic h did not rep ort any cases dur ing the 2008 forecast p erio d (SK K empten, SK Memmingen, LK Kelheim, and S K Asc haffen b urg) only r ep orted 1, 0, 20, and 4 cases in total during 2001– 2007. Ho w ever, w e can only mo del th e effectiv ely rep orted n u m b er of cases, w hic h ma y b e affect ed b y time-v arying atten tion dr a wn to 24 S. MEYER AN D L. HELD influenza in the media. S yndromic survei llance systems aim to u n ify v arious routinely collect ed data sources, for example, we b searc hes for outbreak detection and monitoring [Josseran et al. ( 2006 ), Hu lth , Rydevik and Linde ( 2009 )], and ma y thereby pro vid e a more realistic p ictur e of influenza. Prosp ectiv e detection of outbr eaks is also p ossible b ased on the coun t data mo del p resen ted here. A statistic could b e based on quan tiles of the distribution of Y i,t +1 | Y · ,t , for example, an alarm could b e triggered if the actual obs er ved counts at t + 1 are ab o ve the 99% quantile , sa y , [Held et al. ( 2006 )]. Note that by including seasonalit y in the mo d el, a y early wa v e at the b eginning of the ye ar would b e ‘planned’ and not necessarily considered a deviation fr om d efault b eh a viour. Our p o wer-la w approac h is very useful in the absence of mo vemen t net- w ork d ata (e.g., plane and train traffic). How ev er, if suc h data were av ailable [Lazer et al. ( 2009 )], n eigh b ourho o d we igh ts w j i in the count d ata mo del could instead b e based on th e connectivit y b et ween regions, which was in- v estigated b y S c hr ¨ odle, Held and Ru e ( 2012 ) for the spread of C oxiel losis in Swiss co ws and by Geilh u fe et al. ( 2014 ) for the spread of infl uenza in Northern Norwa y . In recen t work, Bro c kmann and Helbing ( 2013 ) introdu ce the ‘effectiv e distance’ to describ e the 2009 H1N1 in fluenza pandemic. T heir approac h relates to w h at has already b een termed ‘functional distance’ by Bro wn and Horton ( 1970 ), that is, a fu n ction of (in ter-)regional p r op erties lik e p opu lation and comm uter or tra vel flo w s su ch that it “reflects the net effect of enti t y p r op erties up on the prop ensit y of the en tities to interact” [Bro wn an d Holmes ( 1971 )]. A recen t example of using telephone call d ata as a measure of human interacti on can b e found in Ratti et al. ( 2010 ). An- other fr u itful area of fu ture researc h is the statistical analysis of age-stratified surve illance data. Con tact patterns v ary across age [Mossong et al. ( 2008 ), T ruscott et al. ( 2012 )], calling for a unifi ed analysis across age groups and regions. APPENDIX: SOFTW ARE All calculatio ns ha ve b een carried out in the s tatistica l soft wa re envi- ronment R 3.0.2 [R Core T eam ( 2013 )]. Both mo del framew orks and their p o w er-law extensions presente d in this pap er are imp lemen ted in th e R pac k- age surve i l lanc e [H¨ ohle, Mey er and Pa ul ( 2014 )] as of v er s ion 1.6-0 a v ailable from the Comprehen s iv e R Arc hive Netw ork ( CRAN.R-pro ject.org ). The t wo analysed data sets are in cluded therein as data("i mdepi") (courtesy of th e German Reference Centre for Meningo co cci) and data("f luBYBW") [ra w data obtained from the German national surv eillance system op erated b y the R ob ert Ko c h Institute ( 2009 )]. Th e p oin t pro cess m o del ( 1 ) for ind i- vidual p oin t-referenced data can b e fitted by the function t winstim( ) , and the multiv ariate time-series mo del ( 7 ) for count d ata is estimated by h hh4() . POWER-LA W MODELS FOR INFECTIOUS D ISEASE SPREAD 25 The implemen tations are flexible enough to allo w for other sp ecifications of the spatial int eraction fun ction f and the weig h ts w j i , resp ectiv ely . A re- lated tw o-comp onen t epidemic mo del [H¨ ohle ( 2009 )], which is designed for time-con tin u ous individual surveilla n ce data of a closed p opulation with a fixed set of locations, f or example, for farm- or hous ehold-based epidemics, is also included as fun ction twi nSIR() . The application of all three mo del framew ork s in R is describ ed in detail in Mey er , Held and H¨ ohle ( 2014 ). Spatial integral s in the p oint p ro cess lik eliho o d ha ve b een ev aluated us- ing cubature metho ds implemented in the R p ac k age p olyCub 0.4-3 [Mey er ( 2014 )]. Maps hav e b een pro du ced us ing sp 1.0-15 [Biv and, P eb esma and G´ omez-Rubio ( 2013 )] and animations u sing animation 2.2 [Xie ( 2013 )]. Ac kn owledgemen ts. Th is work w as presented at the Summer Scho ol on T opics in Sp ac e–Time Mo deling and Infer enc e at Aalb org Un iv ersity , Ma y 2013, whic h enabled fruitful discussions with its p articipan ts. Th ese also ga v e rise to th e efficien t cub atur e r ule for isotropic functions o v er p olygonal domains elab orated in Mey er and Held [( 2014 ), Section 2.4] with v aluable supp ort by Emil Hedev ang and Christian Reiher. W e th ank Mic haela P aul for tec hnical supp ort on the original count d ata m o del, as we ll as Johannes Elias and Ulric h V ogel from the German Reference Centre for Meningo co cci for pr oviding us with the IMD data. W e also appreciate helpful commen ts by Julia Meyer, Mic hael H¨ ohle, the Editor Tilmann Gneiting, and t wo anon y- mous referees. SUPPLEMENT AR Y MA TERIAL Supp lemen t A: Animations of th e IMD and influenza epidemics ( http://www.bios tat. uzh.ch/stat ic/powerlaw/ ) . • Observ ed ev olution of the IMD and in fl uenza epidemics. • Sim u lated coun ts f rom v arious mo dels for the 2008 in fl uenza w av e. • W eekly mean PIT histograms for these predictions. Supp lemen t B: Inf erence details, integ ration of isotropic functions o ver p olygons, and additional fi gures and tables (DOI: 10.1214 /14-A O AS743S UPP B ; .p d f ). • Detai ls on lik eliho o d inference for b oth mo dels. • In tegration of radially symmetric fun ctions ov er p olygonal domains. • Additional figures and tables of th e p ow er-la w mo dels f or in v asiv e meningo- co ccal disease and infl uenza. 26 S. MEYER AN D L. HELD REFERENCES Alber t, R. and Bara b ´ asi, A.-L. (2002). S t atistical mec hanics of complex netw orks. R ev. Mo dern Phys. 74 47–97. MR1895096 Bar tlett, M. S. (1957). Measles p erio dicity and community size. J. Roy . Statist. So c. Ser. A 120 48–70. Biv an d, R. S . , Pebesma , E. and G ´ omez-Rubio, V. (2013). Applie d Sp atial Data Analysis with R , 2nd ed. Use R! 10 . Springer, New Y ork. MR3099410 Broc kmann, D. and Helbing, D. (2013). The hidden geometry of complex, netw ork- driven contagion phen omena. Scienc e 342 1337–134 2. Broc kmann, D. , Hufnagel, L. and G eisel, T. (2006). The scaling la ws of human trave l. Natur e 439 462–465. Bro wn, L. A. and Holmes, J. (1971). The delimitation of functional regions, no dal regions, and hierarc hies by functional d istance approaches. J. R e g. Sci. 11 57–72. Bro wn, L. A. and Hor ton, F. E. (1970). Functional distance: An op erational approach. Ge o gr. A nal. 2 76–83. Chil ` es, J.-P. and Delfiner, P. (2012). Ge ostatistics: Mo deling Sp atial Unc ertainty , 2nd ed. Wil ey Series in Pr ob abil ity and Statistics 713 . Wiley , Hob oken, NJ. MR2850475 Chis Ste r, I. and Ferguson, N. M. (2007). T ransmissio n parameters of the 2001 foot and mouth epidemic in Great Britain. PL oS ONE 2 e502. Co wling, B. J. , F ang, V. J. , Riley, S . , Pei ris, J. M. S. and Leung, G. M. (2009). Estimation of the serial interv al of infl uenza. Epidemiol og y 20 344–347. Czado, C . , G neiting, T. and Held, L. (2009). Predictive model assessmen t for count data. Biometrics 65 1254–1261. MR2756513 Da wid, A. P. and Sebastia ni, P. (1999). Coherent disp ersion criteria for opt imal exp er- imenta l design. Ann. Statist. 27 65–81. MR1701101 Deardon, R . , Bro oks, S. P. , Grenfell, B. T. , Keeling, M. J. , Tildesley, M . J. , Sa vill, N. J. , Sh a w, D. J. and Woolhouse, M. E. J. (2010). Inference for individual- leve l mod els of in fectious diseas es in large p opulations. Statist. Sinic a 20 239–261. MR2640693 Diggle, P. J. (2006). Spatio-temp oral p oint pro cesses, partial lik eliho o d, fo ot and mouth disease. Stat. Metho ds Me d. R es. 15 325–336. MR2242245 Diggle, P. J. (2007). S p atio-temp oral p oint pro cesses: Method s and applications. In Statistic al Metho ds for Sp atio-T emp or al Systems ( B. Finkenst ¨ adt , L. Held and V. Isham , eds.) 1–45. Chapman & Hall/CR C, Bo ca Raton, FL. Diggle, P. J. , Kaimi, I. and Abellana, R. (2010). Partial -likeli ho od analysis of spatio- temp oral p oint-process data. Biometrics 66 347–354. MR2758814 Elias, J. , Schouls, L. M. , v an de Pol, I. , Keijzers, W. C. , Mar tin, D. R. , Glen- nie, A. , Oster, P. , Fro sch, M. , Vogel, U. and v an der Ende, A. (2010). V accine preven tability of men in go co ccal clone, Greater Aac hen region, Germany . Emer g. Infe ct. Dis. 16 465–472. Eubank, R. L. (2000). S p line regression. In Smo othing and R e gr ession: Appr o aches, Com- putation, and Applic ation ( M. G. Schimek , ed.) 1–18. Wiley , New Y ork. F ahrmeir, L. a nd Knorr-Held, L. (2000). Dynamic and semiparametric mo d- els. In Smo othing and R e gr ession: Appr o aches, Computation, and Appli c ation ( M. G. Schimek , ed.) 513–544 . Wiley , New Y ork. F ansha we, T. R. , Diggle, P. J. , R ushton, S. , Sanderson, R. , Lurz , P. W. W. , Glini- anaia, S. V. , Pearce, M. S . , P arker, L. , Ch arl ton, M. and Pless-Mulloli, T. (2008). Mo delling spatio-temporal va riation in ex p osure to particulate matter: A tw o- stage approach. Envir onmetrics 19 549–566. MR2528540 POWER-LA W MODELS FOR INFECTIOUS D ISEASE SPREAD 27 F arrington, C. P. , And rews, N . J. , Beale, A. D. an d Ca tchpole, M. A. (1996). A statistical algori thm for the early detection of outbreaks of infectious disease. J. R oy. Statist. So c. Ser. A 159 547–563. MR1413665 Fuhrmann, C. (2010). The effects of w eather and climate on th e seasonalit y of influ enza: What we know and what we need to k now . Ge o gr aphy Comp ass 4 718–730. Geilhufe, M. , H eld, L. , Skrøvseth, S. O. , Simonsen, G. S. and G odtlie bsen, F. (2014). Po wer law approximati ons of mo vement netw ork data for mo deling infectious disease spread. Bi om. J. 56 363–382. Gibson, G. J. (1997). Marko v chain Monte Carlo metho ds for fit t ing spatiotemp oral stochastic mod els in plant epidemiology. J. R. Stat. So c. Ser. C. Appl. Stat. 46 215– 233. Gneiting, T. , Balabda oui, F. and Rafter y, A. E. (2007). Probabilistic forecasts, cali- bration and sharpness. J. R. Stat. So c. Ser. B Stat. M etho dol. 69 243–268. MR2325275 Gneiting, T. and Rafter y, A . E. (2007). Strictly prop er scoring ru les, prediction, and estimation. J. A m er. Stat ist. Asso c. 102 359–378. MR2345548 Gneiting, T . and Schla ther, M. (2004). Sto chas tic models that separate fractal d imen- sion and the Hurst effect. SIAM R ev. 46 269–282 (electronic). MR2114455 Gutenberg, B. and Ri chter, C. F. (1944). Frequency of earthquakes in California. Bul l. Sei smol. So c. A mer. 34 185–188. Ha wkes, A. G. (1971). Sp ectra of some self-exciting and mutually exciting point p ro- cesses. Biometrika 58 83–90. MR0278410 Held, L. , H ¨ ohle, M. and Hofmann, M. (2005). A statistical framew ork for the anal- ysis of m ultiva riate infectio us disease surveilla nce counts. Stat. Mo del. 5 187–19 9. MR2210732 Held, L. and P aul, M. (2012). Mo deling seasonality in space–time infectious disease surveil lance d ata. Biom. J. 54 824–843. MR2993630 Held, L. , Hofman n , M. , H ¨ ohle, M. and S chmid, V. (2006). A tw o-comp on ent mo del for counts of infectious diseases. Biostatistics 7 422–437. Herzog, S. A . , P aul, M . and He ld , L. (2011). Heterogeneity in v accination cov erage explains the size and o ccurrence of measles epidemics in German surveillance d ata. Epidemiol. I nf e ct. 139 505–515. H ¨ ohle, M. (2009). A dditive-m u ltiplicativ e regression mo dels for spatio-temp oral epi- demics. Bi om . J. 51 961–978. MR2744450 H ¨ ohle, M. , Meyer, S. and P aul, M. (2014). surveil lanc e : T emp oral an d spatio-temp oral mod eling and m on itoring of epid emic phenomena. R pack age versi on 1.8-0. H ¨ ohle, M. and P a ul, M. (2008). Count data regression charts for the monitoring of surveil lance time series. Comput. Statist. Data Anal. 52 4357–43 68. MR2432467 H ¨ ohle, M. , P aul, M. and Held, L. (2009). Statistical approaches to th e monitoring and surveil lance of infectious diseases for veterinary p ublic health. Pr ev. V et. Me d. 91 2–10. Hul th, A. , R ydevi k, G. and Li nde, A. (2009). W eb queries as a source for sy ndromic surveil lance. PL oS ONE 4 e4378. Josseran, L. , N i cola u , J. , Cai ll ` ere, N. , Ast agneau, P. and Br ¨ ucker, G. (2006). Syndromic surveillance based on emergency department activity and crude mortalit y : Tw o examples. Eur osurveil lanc e 11 225–22 9. Keeling, M. J. and R ohani , P. ( 2002). Estimating spatial coupling in epidemiological systems: A mechanis tic approach. Ec ol. L ett. 5 20–29. Keeling, M. J. and Rohani, P. (2008). Mo deling Infe ctious Di se ases in Humans and Animals . Princeton Univ. Press, Princeton, NJ. MR2354763 Keeling, M. J. , W oolhouse, M. E. J. , Sha w, D. J. , Ma tthews, L. , Chase- Topping, M. , Ha ydon, D. T. , C ornell, S. J. , Kap pey, J. , Wi lesmith, J. and 28 S. MEYER AN D L. HELD Grenfell, B . T. (2001). Dynamics of the 2001 UK fo ot and mouth epidemic: Sto chas- tic disp ersal in a h eterogeneous landscap e. Scienc e 294 813–817. La wson, A. B . and Leimi ch, P. (2000). Approaches to the space–time mod elling of infectious disease b ehaviour. IMA J. Math. Appl. Me d. Biol. 17 1–13. Lazer, D. , Pentland, A. , Adamic, L. , Aral, S. , Barabasi, A.-L. , Brewer, D. , Christ akis, N. , Contractor, N. , F o wler, J. , Gutmann, M. , Jebara, T. , King, G. , Macy, M. , Ro y, D. and Alstyne, M. V. (2009). S ocial science. Com- putational so cial science. Scienc e 323 721–723. Le Comber, S. , Ro ssmo, D. K. , H assan, A. , Fuller, D. and Beier, J. (2011). Geo- graphic profiling as a n o vel spatial to ol for targeting infectious disease contro l. I nt. J. He alth Ge o gr. 10 35. Liljeros, F. , Edling, C. R. , Amaral, L. A. N. , St anley, H. E. and Aberg, Y. (2001). The web of human sex u al contacts. Natur e 411 907–908. Lomax, K. S. (1954). Business failures: An other example of the analysis of failure data. J. Amer. Statist. Asso c. 49 847–852. Meyer, S. (2014). p olyCub : Cubature ov er p olygonal domains. R pack age vers ion 0.4-3. Meyer, S. , Elias, J. and H ¨ ohle, M. (2012). A space–time conditional intensit y mo del for inv asive meningo coccal d isease o ccurrence. Biometrics 68 607–616. MR2959628 Meyer, S. and He ld, L. (2014). Supplement to “Po wer-la w mo d els for infectious disease spread.” DO I: 10.1214 /14-AO AS743SUPPB . Meyer, S. , Held, L. and H ¨ ohle, M . (2014). S patio-temp oral analysis of epidemic p he- nomena using the R pack age surveil lanc e . J. Stat. Softw. T o app ear. Mossong, J. , H ens, N. , Jit, M. , B eutels, P. , Auranen, K. , M i k olajczyk, R. , M as- sari, M. , Sa lma so, S. , Tomba, G. S . , W allinga, J. , Hei jne, J. , Sadko wska- Todys, M. , R osin ska, M. and Edmunds, W. J. (2008). Social contacts and mixing patterns relev ant to the spread of infectious diseases. PLo S Me d. 5 e74. Newman, M. E. J. (2005). Po wer laws, Pareto distributions and Zipf ’s la w. Contemp. Phys. 46 323–351. Nouf ail y, A . , Enki, D. G . , F arrington, P. , Gar thw aite, P. , An drews, N. and Charlett, A. (2013). An impro ved algorithm for out break detection in multiple surveil lance sy stems. Stat. Me d. 32 1206–1222. MR3045892 Oga t a, Y. (1998). Space–time p oint-process mod els for earthquake o ccurrences. Ann. Inst. Statist. Math. 50 379–402. P areto, V. (1896). Cours D’ ´ Ec onomie Poli tique 1 . F. R ouge, Lausanne. P aul, M. and He ld, L. (2011). Predictive assessmen t of a non-linear random effects mod el for multiv ariate time series of infectious disease counts. Stat. Me d. 30 1118–1136. MR2767846 P aul, M. , Held, L. and Toschke, A. M. (2008). Multiv ariate mo delling of infectious disease surveillance data. Stat. Me d. 27 6250–6267. MR2522320 Pinto, C. M. A. , Mend es Lope s, A. and Machado, J. A. T. (2012). A review of p o w er la ws in real life phenomena. Commun. Nonline ar Sci. Numer. Simul. 17 3558– 3578. MR2913993 R Core Team (2013). R : A L anguage and Envi r onment f or Statistic al Computing. R F oun d ation for Statistical Computing, Vienna, Austria. Ra tti, C. , Sobolevsky, S . , Calabrese, F. , Andris, C. , Read e s, J. , Mar tino, M. , Claxton, R. and Stroga tz , S. H. (2010). R edraw ing th e map of Great Britain from a netw ork of human intera ctions. PL oS ONE 5 e14248. Ro ber t K och Institute (2009). SurvStat@ R KI. Av ailable at http://www3.rki.de/ SurvStat . Queried on Marc h 6, 2009. Ro ssmo, D. K. (2000). Ge o gr aphic Pr ofiling . CRC Press, Bo ca R aton. POWER-LA W MODELS FOR INFECTIOUS D ISEASE SPREAD 29 Schr ¨ odle, B. , H eld, L. and R ue , H. (2012). A ssessing the impact of a mo vement netw ork on th e spatiotemp oral spread of infectious d iseases. Biometrics 68 736–744. MR3055178 Sommariv a , A. and Vian ello, M. (2007). Pro duct Gauss cubature ove r p olygons based on Green’s integration formula. BIT 47 441–453. MR2334049 Soubeyrand, S. , Held, L. , H ¨ ohle, M. and Sache, I. (2008). Mod elling t he spread in space and time of an airb orne plant disease. J. R. Stat. So c. Ser. C. Appl . Stat. 57 253–272 . MR2440008 Tobler, W. R. (1970). A computer movie sim u lating u rban growth in the D etroit region. Ec on. Ge o gr. 46 234–240 . Trusco tt, J. , Frase r, C . , Cauchemez, S. , Meey ai, A. , Hinsley, W. , Don- nell y, C . A. , Ghani, A. and Fer g u son, N. (2012). Essen tial epidemiologi cal mecha- nisms u nderpinning the transmission d ynamics of seasonal infl uenza. J. R. So c. I nter- fac e 9 304–312 . Viboud, C . , Bj ørnst ad, O. N. , Smith, D. L. , S imonsen, L. , Miller, M . A. and Grenfell, B. T. (2006). Synchron y , wa ves, and spatial hierarchies in the sp read of influenza. Scienc e 312 447–451. Wei, W. and He ld, L. (2014). Calibration tests for count data. TEST . DOI: 10.1007 /s11749 -014-0380-8 . Willem, L. , Kerck ho ve, K . V. , Chao, D. L. , Hens, N. and Beutels, P. (2012). A nice day for an infection? W eather conditions and social conta ct patterns relev ant to influenza t ransmission. PL oS ONE 7 e48695. Xie, Y. (2013). anim ation : An R pac ka ge for creating animations and demonstrating statistical metho ds. J. Stat. Sof tw. 53 1–27. Zipf, G. K. (1949). Human Behavior and the Principl e of Le ast Effort: An I ntr o duction to Human Ec olo gy . Ad dison-W esley Press, Cam b ridge, MA. Epidemiology, Biost a tistics and Prevention Institute Dep ar tment of Biost a tistics University of Zurich Hirschengraben 84 CH-8001 Z ¨ urich Switzerland E-mail: Sebastian.Mey er@uzh.ch Leonhard.Held@uzh.c h URL: www.biostat.uzh.c h
Original Paper
Loading high-quality paper...
Comments & Academic Discussion
Loading comments...
Leave a Comment