No alignment of cattle along geomagnetic field lines found
This paper presents a study of the body orientation of domestic cattle on free pastures in several European states, based on Google satellite photographs. In sum, 232 herds with 3412 individuals were evaluated. Two independent groups participated in …
Authors: J. Hert, L. Jelinek, L. Pekarek
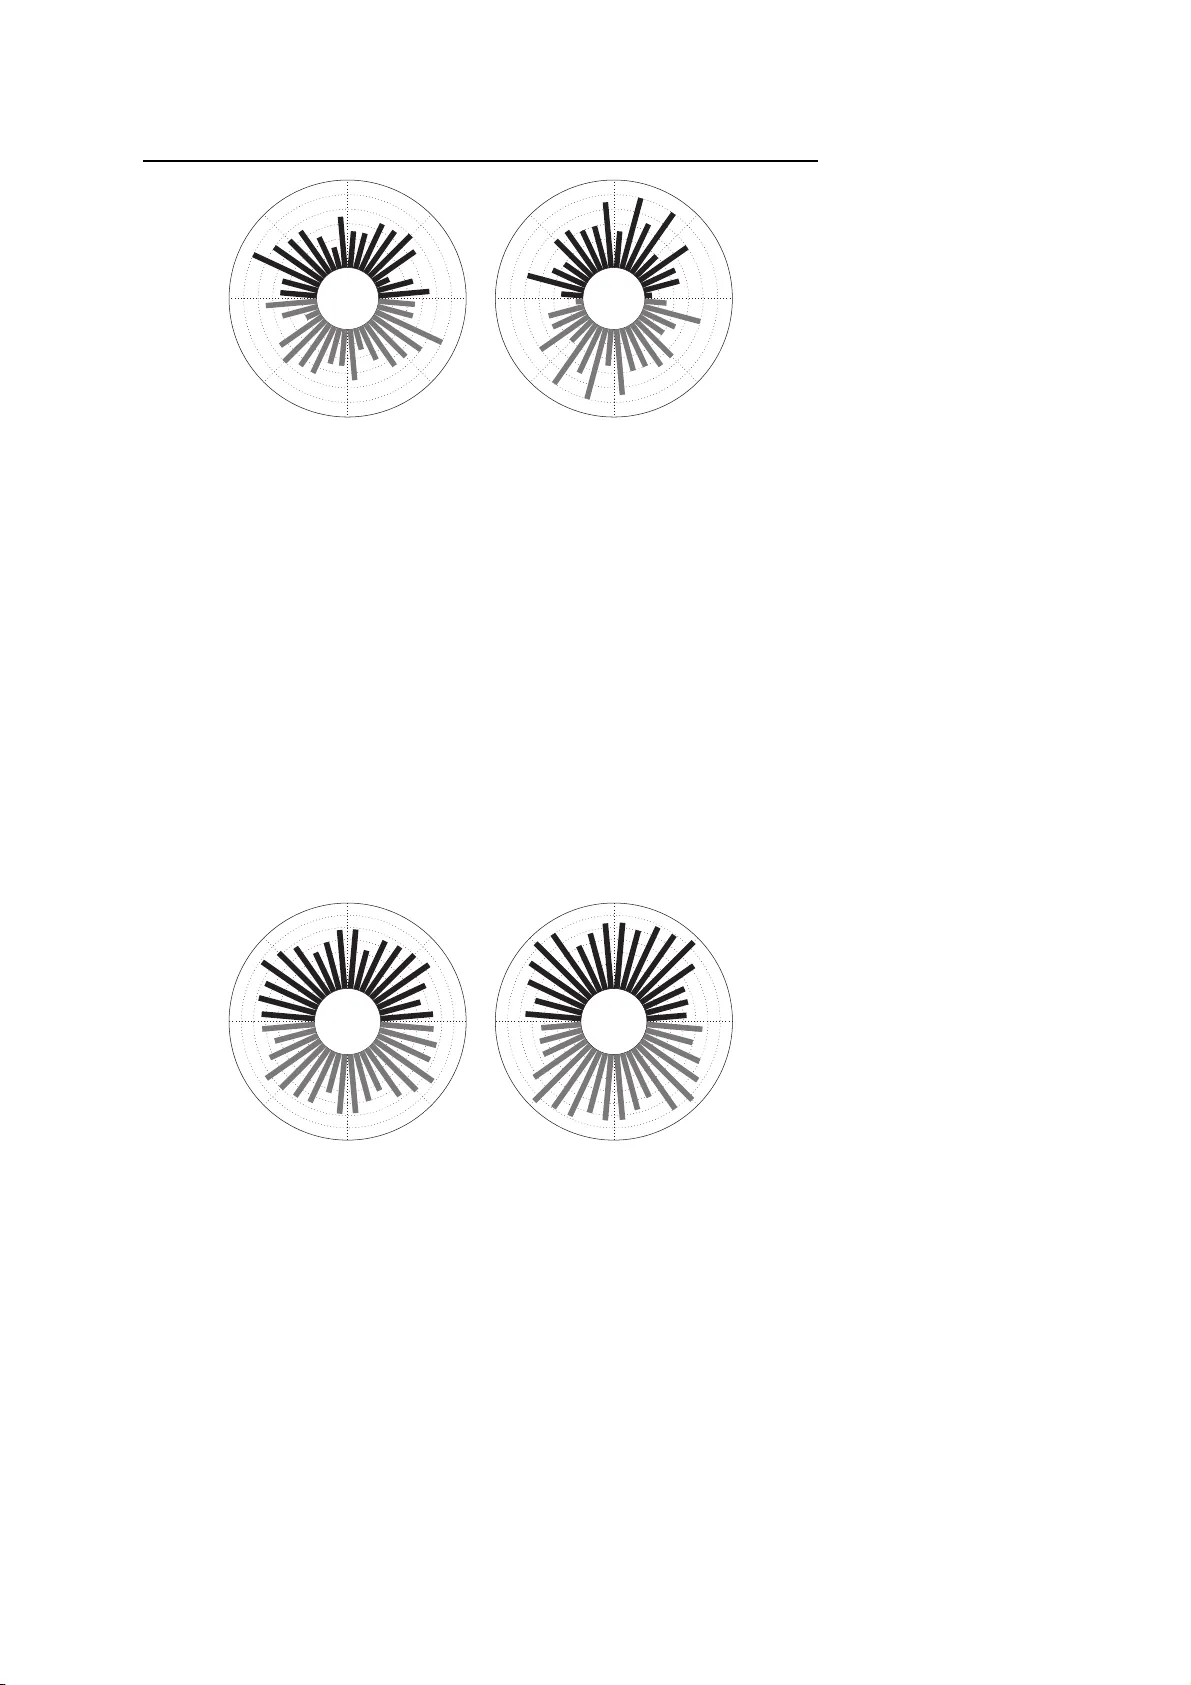
Noname man uscript No. (will be inserted b y the editor) No alignmen t of cattle along geomagnetic field lines found J. Hert · L . Jelinek · L. P ek arek · A. P a vlicek Receiv ed: date / Accepted: date Abstract This pap er presents a study of the b o dy orientation of domestic cattle on free pastures in several Europ e a n states, based on Go o gle satellite photogra phs . In sum, 232 herds with 34 12 individuals were ev aluated. Two in- depe ndent groups participated in o ur study and ca me to the same conclusion that, in c on tradiction to the r ecen t findings of other r esearchers, no alignment of the animals and of their herds alo ng geomagnetic field lines could b e found. Several p ossible reasons for this discrepancy should be taken into account: po or quality of Go ogle satellite photogra phs, difficulties in determining the bo dy axis, selection of herds or animals within herds, lack of blinding in the ev a luation, po ssible sub conscio us bias, and, most imp ortantly , high sensitivity of the calculated main directions of the Ra yleigh v ectors to some kind o f bias or to so me ov erlo oked or ignored co nfounder. This factor could easily hav e led to an unsubstantiated positive conclusion ab out the existence of magnetore- ception. J. Hert Departmen t of Anatomy , F acult y of Medicine, Charles Universit y , 305 06 Plzen, Czec h Re- public E-mail: jir i.hert@tiscali.cz L. Jelinek Departmen t of E l ectromagne tic Field, F acu lty of Electrical Engineering, Cz ech T echnical Unive rsity in Prague, 166 27 Prague, Czech Republic T el.: +420 224 355 891 F ax: +420 233 339 958 E-mail: l jelinek@us.es L. Pek arek National Reference Laboratory for Electromagnetic Field, National Institute of Public Health, 100 42 Prague, Czech Republic E-mail: p ek arek@szu.cz A. Pa vlicek Departmen t of System Analysis, F aculty of Informatics and Statistics, Uni versity of Eco - nomics, Prague, Czech Republic E-mail: anto nin.pavlicek@vse.cz 2 J. Hert et al. Keyw ords magneto reception · magnetic alig nmen t · cattle in ma g netic field · magnetic sense · statistical ev a luation In tro duction The p ossibility that many animals, including large mammals, p osses s the abil- it y to sense a magnetic field and use it for so me b enefit has b een widely discussed in the scientific communit y , see for exa mple [1] and the references therein. This is understa nda ble, as the question of sensitivit y o f living crea- tures to a magnetic field is also interesting fro m the point o f view o f h uman health protection [2]. Rep orts of the discov ery of magnetic s ensing in large mammals such as ca ttle and deer , published in [3] and suppo rted by o bserv a - tions o f the b ehavior of cattle nea r p ow er lines [4] also p oint to p ossible health risks for humans. Evidence of magnetic sensing of mig rating a nd nonmigrating animals has bee n based mostly on observ ations of anima l b ehavior [5 , 6], as the re spons i- ble bioph ysical mechanism has remained in the state of hypotheses [1]. The three pro pos e d mechanisms, one base d on the presence of ferromag ne tic o r ferrimagnetic micro crystals in the bo dy tissue [7], a no ther based on electric currents induced in the bo dy of an a nimal mo ving in the Ear th’s magnetic field [8], and the third based on chemical reac tio ns co nnected with the influence of a magnetic field on free radica ls and their recombination [9], ar e p otential candidates, but there is as yet no final pro of for an y of them. T o obtain a sufficient num ber o f observ ations to allow statistically signifi- cant conclusions, a lar ge amount of data - us ua lly consider a bly disp ersed a nd sometimes co n tradictory [5] - needs to b e collected. This may be exp ensive and time-consuming. The mentioned problem of time and ex p ense was succes sfully resolved in [3 ]: T o find whether ruminan ts (mostly domestic cows) possess a magnetic sense, B e gall et al. ev aluated the ang les b etw een the lo cal directio n of the magnetic declinatio n and the direction o f the bo dy axes of more than eight thousand animals seen on satellite pho tographs in sev eral parts of the glob e. Along the data obtaine d in this w ay , Begall et al. also studied the a ngles of almos t 3000 b o dy axes of wild r uminan ts (red deer and r oe deer), o btained by direct field glass obser v ations and by examining the prints left behind in show by res ting or sleeping wild animals. The ev alua tion o f the data obtained in tha t wa y indicated that the in vestigated animals, if not disturb ed, orient their b o dy axes pa rallel to the lines of magnetic declinatio n. The author s also suppo rted the idea o f the ability of r umina n ts to p erceive a mag netic field by observ ations of cows in the vicinit y of p ow er lines [4], where the animals a l- legedly lost their mag netic se nse, a nd the direction of their bo dy a xes b ecame chaotic. The findings published in [3] a re unexp e cted and call fo r replicatio n. In this pap er, we pre s en t the results of an ev alua tio n of 3412 cows seen in satellite pictures. W e compa r e them with the results published in [3], and sugg est a n explanation for the difference b etw een our res ults and the results published in No alignment of cattle along geomagnetic field li nes f ound 3 [3]. In or der to obtain results as robust as pos s ible, we divided the ev aluation int o three parts. Firs t, w e ev aluated the orient ation of the herds allowing a direct co mparison with [3]. Second, we ev aluated the bo dy axe s of individual cows, as in our opinion magnetor eception is a prop erty of an individual and not of the herd. Thir d, we ev aluated the or ien tation o f the heads, as it is p ossible that, even if no unidirectionality were found in the axial da ta, all cows could be orien ted with their heads to the northern half of the circle. Material and metho ds Two groups (Hert, Jelinek , Pek arek – 1636 animals, and Pavlicek – 17 76 ani- mals) indep endently collected the angles o f 34 12 bo dy axe s and 589 bo dy vec- tors of cows fro m 232 herds in F rance, Great Britain, Germany , the Nether- lands, Switzerland and the Czech Republic, using s atellite screenshots from Go ogle Ear th and a computer pro gram for a ng le ev aluation (for angle acqui- sition we used the v ector graphic environment for marking the angles . The marked angles were then exported in text f orma t as v alues ), see “Online Re- source 1” for the GPS co ordinates and the a ngles. In acco rdance with the way chosen in [3], o nly animals on pas tures lo cated in ho rizontal a reas sufficiently a part from communications and other disturb- ing a r rangements were included in the data. No da ta used for ev a luation over- lap. Only data with recognized head positions (589 animals) was used t wice, first as circular data with vector directio ns b etw een 0 ◦ and 360 ◦ , and, for the axial statistics, transformed to ax ia l data and added to other data of animals with head direction not safely reco gnizable. In order to account for the un- certaint y o f measur emen t o f the angles of the animals, a computer–gener ated jitter in the ra nge of ± 4 ◦ (estimated error ) was applied to the measure d da ta. F ull quantitativ e infor mation ab out the resulting distribution of the ob- served ang le s was visualized via circular histogr a ms, b oth for the vector data and for the axial data . T o k eep a balance betw een t he precise represen tation and the una voidable imprecision in data acq uisition, we c hose the histogram step to be 1 0 ◦ . Apart from the visual information contained in the circular histo grams, the uniformity Z–test (in our case coinciding with the Rayleigh test [10]) defined as Z 2 m = 2 N X i cos ( mϕ i ) ! 2 + X i sin ( mϕ i ) ! 2 (1) was also ev aluated on the measured sample [1 0], with ϕ i ∈ h 0 , 2 π /m i a nd N as the total n umber of samples. In (1), m = 1 and m = 2 w ere used for the vector data and for the axial da ta, r espec tively . F or unif ormly (isotropically) distributed angles ϕ i , the quantit y Z 2 m has a c hi-squar e distribution with tw o degrees of fr e e dom. The gra phical data is also accompanied by n umerical v alues of the mean sample direction ϕ mean [10] and o f the circular sectors α north , 4 J. Hert et al. α mean , centered around no r th or mean direction, res pectively , containing 50 % of the sample. Note that uniform distribution sho uld ha ve α north = α mean = 180 ◦ /m . Results Before w e mov e to the main part of the paper , which deals with the data statistics, we will first clarify how the ev aluation will b e made. T he pr oc edure consists of t w o steps. In the first step w e will pr esent the n umerical v alues of the Z-statistics and the mean direction. The second step consists of a visual insp e ction of the circular his to gram. If, in the first step, the Z-statis tics does not exceed the significance level, the ev alua tion is terminated with the con- clusion tha t the sample ca nnot b e distinguished from a un iform distribution. The mean direction in this cas e has no significance. If, on the other ha nd, the Z-statistics exceeds the significa nce level, unifor mit y of the sample is rejected. Then, we need a seco nd step, in which the kind o f non-unifor mit y (single mo dal around a mean angle, m ultimo dal, etc.) is analyzed. In o rder to c larify this wa y of ev aluation, we present following example: Assume an artificial sample of 1000 b o dy axes coming fro m a unif orm distri- bution on the interv a l (10 ◦ , 170 ◦ ). F or this sample, the Z-statistics will rea c h v a lues of approximately 50, which greatly exceeds the sig nificance level. In addition, this sample will show a mean a ngle of appr o ximately 9 0 ◦ . If we were to take only the numerical v alues of Z and of the mean a ngle, we would dr a w the completely wr ong co nclusion that the sample is significantly north-s o uth aligned. That such judgment is wrong is immediately seen from the plot of the probability density , which rev eals that the high v alue of Z is only c o nnected with “holes” in the east-west direction. In this case, w e can only say that the individuals av oid orienting themselv es in a shar ply defined cone around the east-west direc tio n. If, o n the o ther hand, the 1 000 b o dy axes a r e s e lected from a Ga us sian distribution w ith mea n v alue 90 ◦ and σ = 10 ◦ , the Z-sta tistics will also exceed the significance lev el (no w by a v alue ar ound 200 0), and the cal- culated mean directio n will also r ead approximately 90 ◦ . A visual insp ection of the cor resp onding probability density plo t will, howev er, clear ly show that in this case the non-uniformity is caused by a sharp north-s outh alig nmen t. Statistics emerging from the real collected data will now b e presented. First, w e ev aluated the orientation o f the her ds, in order to o bta in results directly comparable to [3]. F or the ev aluation, we chose only those herds that contained more than four cows, lea ding to 110 her ds in Group I and 110 her ds in Group I I. The distribution o f the mean axes of the her ds is shown in Fig. 1, and leads to Z 2 2 = [0 . 2 , 5 . 5], ϕ mean = [148 ◦ , 82 ◦ ], α north = [90 ◦ , 74 ◦ ], α mean = [87 ◦ , 75 ◦ ] for g roup I a nd for group II, resp ectively . Co mparing the v alues of Z 2 2 with the 0.95-qua ntile of a chi-square distr ibution with tw o degree s of freedom, which is equal to 6.0, shows that at this significance level data uniformity cannot be r ejected. This conclusion agrees with the visual inspec tio n of Fig. 1a,b, where no preferred direction is observed. No alignment of cattle along geomagnetic field li nes f ound 5 N N W W E E S S (a) (b) Fig. 1 Axial data sho wing the orientation of the mean ve ctors of the herds. Panels (a,b) represen t data found f or group I and group I I, resp ectiv ely . Eac h r ectan gular beam in the figure cov ers an angular section of 10 ◦ and its length represen ts the num b er of herds. Each line of the circular grid represent s 2 herds. The bottom gra y part of the figures represent s the centro-symmetric image. In the second step, we ev alua ted the b o dy axes of individual co ws. The results a re shown in Fig. 2, and are characterized b y Z 2 2 = [1 . 2 , 1 4 . 9], ϕ mean = [148 ◦ , 91 ◦ ], α north = [91 ◦ , 85 ◦ ], α mean = [90 ◦ , 85 ◦ ] for Fig. 2a (gr oup I) and Fig. 2b (gr oup I I), r espec tively . A comparison o f the v alues of Z 2 2 with the 0.95 - quantile of the chi-square distribution with tw o deg rees of freedom shows that at this level o f significance uniformity c annot be rejected in the c ase of Gro up I. Group I I , ho w ever, has to b e denoted as non uniform. The nonuniformit y is apparent from Fig. 2b, which s ho ws that the distribution is v ery clo se to the hypothetical case of uniform distribution with east-west “ho les” that has b een discussed ab ov e and cannot b e in terpreted as a north-so uth alignment. N N W W E E S S (a) (b) Fig. 2 Axi al data showing the orientat ion of the mean vectors of the cows. Panels (a,b) represen t data found by group I and group II, resp ectiv ely . Eac h rectangular beam in the figure cov ers an angular section of 10 ◦ and its length represents the num ber of cows. Each line of the cir cular grid represen ts 20 co ws. The b ottom gray parts r epresen t t he ce ntro- symmetric image. 6 J. Hert et al. In the la st step, w e ev aluated the head orien tation of individual c ows. In order to get an idea ab out the directio nal distribution of the hea ds , Fig. 3 shows the collection o f 20 pr o babilit y density diagrams b elonging to rando mly selected herds of cows with a r ecognized head p osition. With a n av erage num- ber of 18 co ws in one herd, the diag rams distinctly rev eal that the v ectors of the bo dies are not distr ibuted randomly , b eing clustered in a sma ll num ber of directions (mos tly t w o). Only the diagr am in the r o w 2, column 2 displays a pattern with t w o opposite directions aimed to the no rth a nd to the south. The other diagr ams show les s tidy patterns and no appar e n t pr eference for the north or for the south, but clustering of the b o dy angles s till remains ap- parent. Lo oking at the diagra ms, we can guess that the probability density distribution of the full sample will not b e uniform, but no prefer red dir ection can be ex pected. Fig. 3 Pr obabilit y density function drawn for 20 herds randomly selected from 40 he rds with well r esolv ed p ositions of heads and with a similar num ber of cows (361 animals in total). F or b etter vis i bility , the density functions were appro ximated by a F ouri er series with 18 harmonics, which l eads to angular r esolution of 10 ◦ . A graphical representation of all vector s amples (cows with recognize d head p osition) fused together is shown in Fig. 4, and leads to Z 2 1 = 27 . 9 , ϕ mean = 168 ◦ , α north = 170 ◦ , α mean = 150 ◦ . Compar ing the v alues of Z 2 1 given ab ov e with the 0 .95-quantile of the chi-square distribution with tw o degrees of freedom leads to rejection of uniformity o f the mea sured da ta. This conclus ion agrees with a visual insp ection of Fig. 4, which shows several maxima a nd minima. The figur e is how ever far fro m b eing sha rply north alig ne d, whic h is also supp orted b y the n umerical v alues o f α north , α mean . No alignment of cattle along geomagnetic field li nes f ound 7 N W E S Fig. 4 V ector data sample based on herds with a recognized head position. Eac h rectang ular beam in the figure co v ers an angular section of 10 ◦ and its length represent s the num ber of co ws. Eac h line of the circular gr id represen ts 5 co ws. Summarizing o ur results acquired from the data obta ined from the sa tellite photogra phs , we must unequivocally s tate that no tendency of the anima ls to prefer the north- s outh direc tion could b e extracted from a n ev aluation of the pictures. The or ien tation o f the herds, the b o dy ax es (p osition of head ignored) or the bo dy vectors (po sition o f head rec o gnized), was either isotr opic (uniform distribution), or multimodal. Discussion In our s tudy , p erformed by t wo independent gr o ups of author s in three different wa ys, no no rth-south a lig nmen t of domestic cattle on free pastures was found. Our r esult is thus es sen tially different from the result obta ine d in [3]. Cer tainly , not all our results ca n b e compar ed with the results published in [3], wher e the orientation of the heads w as not included in the ev a luated data , while we underto ok no observ ation of the behavior of wild ruminan ts o r o f c ows under power line s [4]. How ev er, the weigh t of the visual obser v ation of the bo dy directions of wild deer or of the direction estimated from prints in snow is due to inher en t inaccuracy and p oss ible bias certainly low er than the measurement of b o dy a ng les on satellite pictures, which ca n b e car ried out in a “double blind” way (the screen shots of co ws can be ev aluated by several uninformed per sons in unknown p osition after rotation). In a dditio n, if no north-south alignment was found with cows on a free pa sture, then the idea o f disruption of the magne tic sense by a w eak a lter nating magnetic field near pow er lines lacks sense. Hence the crucial pr oblem is to explain the fundamental difference b etw een the tw o outcomes of ev aluations of axial da ta obtained fr o m sa tellite pictures . The difference in the nu mber of a nimals investigated cannot s e r v e as an expla- nation, since the size of our sa mple is ev en larger than the Euro pean sample from [3], which cle arly showed north-south alignment. Many other factors must 8 J. Hert et al. be taken into consideratio n: po or q ualit y o f Go ogle pho to graphs, difficulties in deter mining the bo dy axis, different samples of herds , selection o f herds or a nimals within the her ds, o mitted blinding of the ev a luation, poss ible sub- conscious bias, incorr ect or erroneous statistics, high sensitivity of the mea n vectors to some kind of bias, or some ov erlo oked or ignored confounder . It is difficult to detect the main reason, but o ne essential difference is ap- parent b etw een the tw o studies. The ma jor part of our work ha s us ed cows as basic e ntities, unlik e [3], where the chosen basic en tities were herds. In other words, in our ca s e the calculated mean vector o f each her d would hav e its own amplitude and direction, while in the case o f [3] all herd v ectors were unitary . The metho d of unitary vectors, howev er, co mpletely ignores the num- ber of cows in each herd, whic h can lead to significant error when there ar e big differences betw een herd sizes (a her d with a single cow is given the same significance as a herd with 10 0 cows). The metho d of unitary vectors also completely ignores the statistical disper sion within a her d (a her d with 9 9 uniformly distributed cows and 1 c ow oriented to the north is given the same significance a s a herd with 1 0 0 no rth oriented cows). This er ror can b e further enhanced by da ta selection, as not all herds found in the satellite maps were used for the e v aluation. The restrictio ns claimed in [3 ] for data that c an b e accepted for further pro ces sing a re certainly justified, but the method with individual animals chosen as basic units is certainly more immune aga inst un- int entional bias . Unit ary weigh t for ea ch herd is also difficult to understand. Indeed, ther e ar e no clues in the liter ature for thinking that the presumed magnetorece ptio n should b e a common prop erty of a herd, and not an indi- vidual proper t y of each cow. Cer ta inly o ne or more animals s tanding nea rby tend to as s ume the same bo dy orientation, but most animals during pasture are disp ersed ov er the field. The most probable reason, wh y pr ev alence of the no rth-south alig nmen t of cattle w as found in [3], is, in our opinion, an inadequate se le ction of he rds and/or individual co ws. F ortunately , the metho d for ev alua ting satellite pho- tographs used in [3] for inv estigating the b ehavior o f large- sized animals offers a simple, effectiv e a nd freely a ccessible wa y to collect the corre s ponding data. Hence, there is a n easy wa y to replicate the investigations on p ossible magnetic alignment of cattle, and to as c ertain whether or not the magnetic alignmen t of gr azing or resting cattle is reality . W e hop e tha t our study will stim ulate such replications. Ac knowledgemen ts This work has been s upported by National Institute of Public Health and the Czech Grant Agency (pro ject no. 102/09/ 0314). W e also would like to thank Radek Theier, Filip T ruhlar, Jan Pr ochaz k a, Fil ip Kroupa, and Michael Hapala for their assistance in data acquisition. References 1. Johnsen S and Lohmann KJ (2005) The physics and neurobiology of magnetoreception. NA T REV NEU ROSCI 6: 703-712 No alignment of cattle along geomagnetic field li nes f ound 9 2. Sch uz J, Ahlb om A (2008) Exp osure to electromagnetic fields and the risk of childhoo d leuk emia: a review. RADIA T PROT DOSIM 132: 202-211 3. Begall S, Cerven y J, Neef J, V o jtec h O, Burda H (2008) Magnetic alignmen t in grazing and resting cattle and deer. P NA TL ACAD SCI USA 105: 13451-13455 4. Burda H, Begall S, C er v en y J, Neef J, Nemec P (2009) Extremely low-frequency elec- tromagnetic fields disr upt magnetic alignment of ruminants. P NA TL ACAD SCI USA 106: 5708–5713 5. Wiltschk o R, Wiltschk o W (1995) Magnetic Orientation in Animals. Springer, Berlin 6. Dennis TE, Ra yner MJ, W alker MM (200 7) Evidence that pigeons orien t to geomag netic int ensity duri ng homing. P ROY SOC B-BIOL SCI 274: 1153-1158 7. Kirsch vink JL, W alker M M and Dieb el CE (2001) Magnetite-based magnetoreception. CURR OPIN N EUR OBIOL 11: 462–467 8. Kalmij n AJ (1978) Animal Mi gration, N avigation, and Homing. Springer, Berl in 9. Ritz T, Adem S, Sc hulte n K (2000) A Mo del for Photorecept or-Based Magnetoreception in Birds. BIOPHYS J 78:707–718 10. Mardia KV, Jupp PE (2000) Directional Statistics. John Wiley and Sons, Chiche ster
Original Paper
Loading high-quality paper...
Comments & Academic Discussion
Loading comments...
Leave a Comment