Bayesian Fusion of Multi-Band Images
In this paper, a Bayesian fusion technique for remotely sensed multi-band images is presented. The observed images are related to the high spectral and high spatial resolution image to be recovered through physical degradations, e.g., spatial and spe…
Authors: Qi Wei, Nicolas Dobigeon, Jean-Yves Tourneret
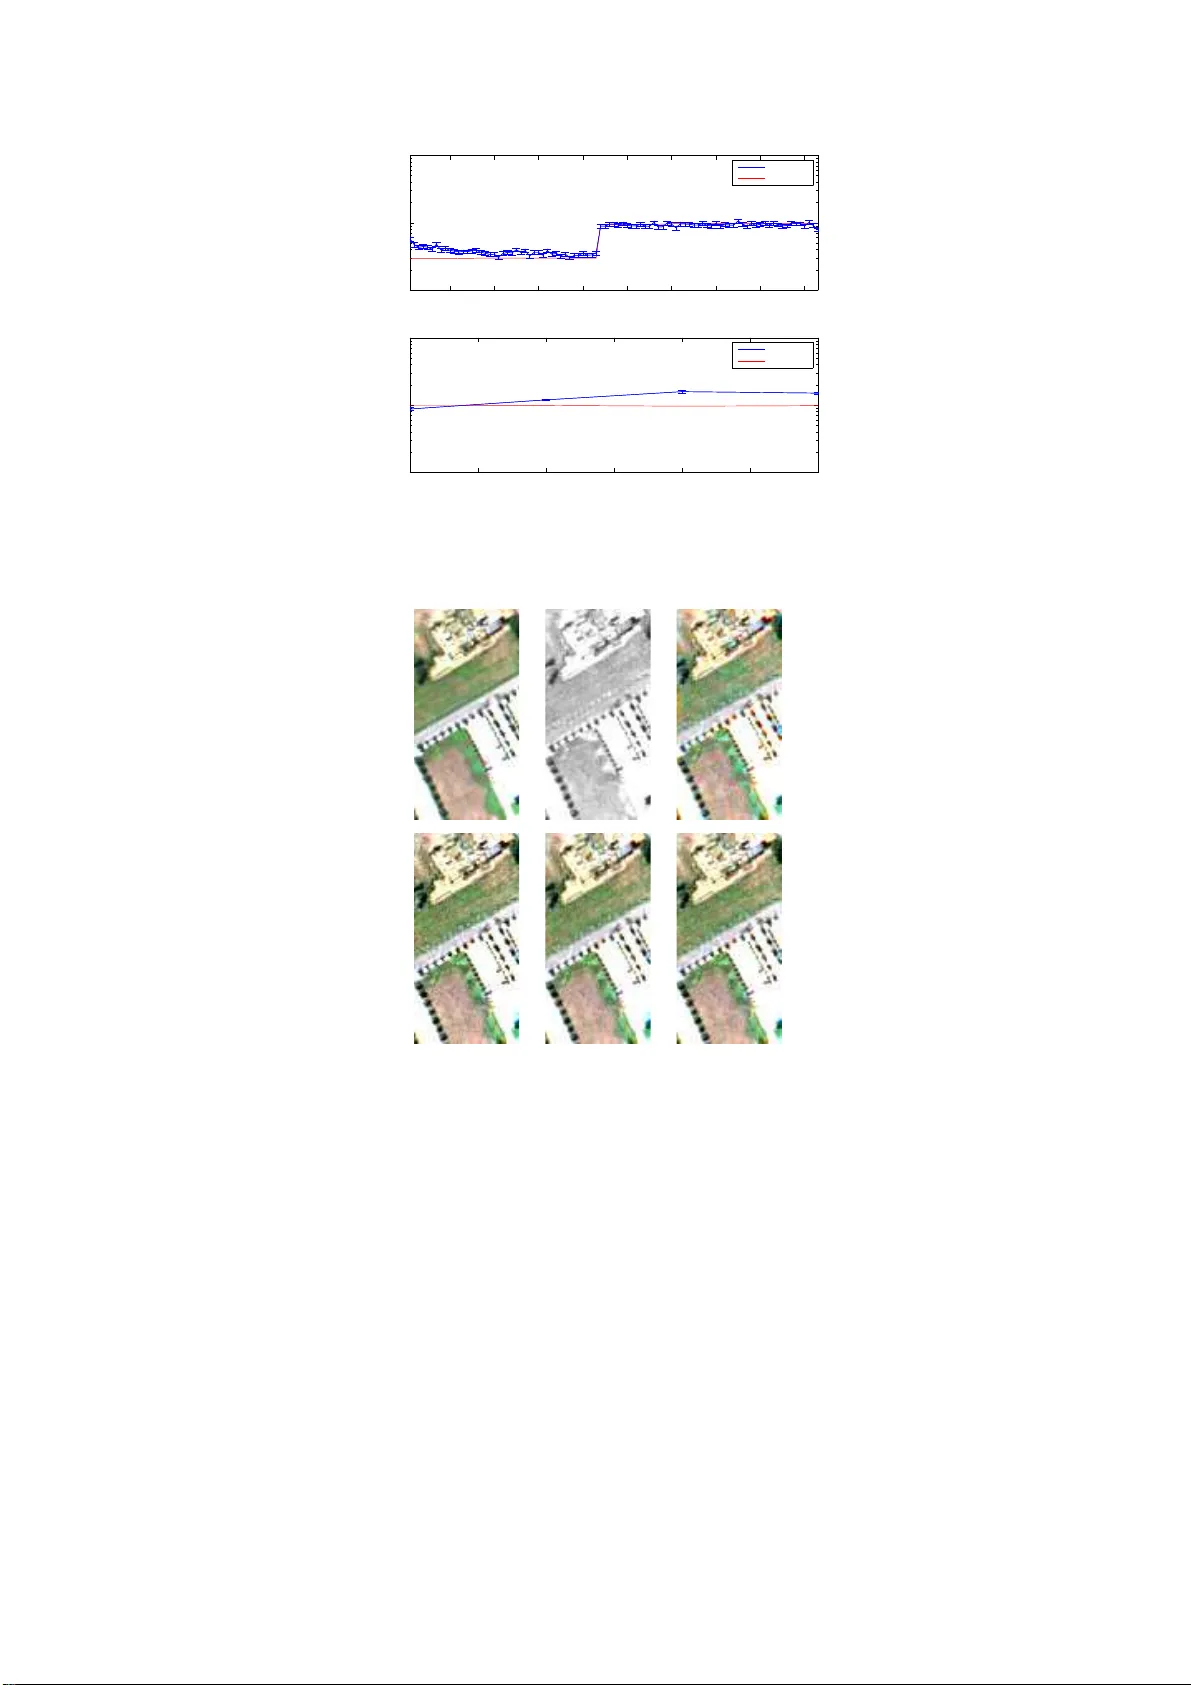
1 Bayesian Fusion of Multi-Band Images Qi W ei, Nicolas Dobigeon , Jean-Yves T ourneret Univ ersity of T oulouse, IRIT/INP-ENSEEIHT/T ´ eSA, T oulous e, France { Qi.Wei,Ni colas.Dobig eon,Jean-Yves.Tou rneret } @enseeiht.fr Abstract In this paper, a Bayesian fusion tech nique for rem otely sensed multi-b and images is presented . The observed images are re lated to the high spec tral and high spatial resolutio n image to be re covered throug h phy sical d egradations, e .g., spatial an d spectral blur ring an d/or subsamplin g d efined by th e sensor characteristics. Th e fusion problem is fo rmulated within a Bayesian estimation framework. An appr opriate prior distribution exploiting g eometrical consid eration is introdu ced. T o co mpute the Bayesian estimator of the scene of interest from its posterior distribution, a Markov chain Monte Carlo algorithm is designed to gen erate sam ples asymptotically distributed acco rding to the target distribution. T o efficiently samp le from th is h igh-dim ension distribution, a Hamilton ian Monte Carlo step is in troduc ed in the Gib bs samp ling strategy . Th e efficiency of the prop osed fusion metho d is ev aluated with respect to sev eral state-of-the -art fusion technique s. In particular , low spatial resolution hypersp ectral an d multispec tral imag es are fused to p roduce a high sp atial resolution hyp erspectral image. Index T erms Fusion, super-resolution , multispectr al and hy perspectral im ages, deconvolution, Bayesian esti- mation, Hamiltonian Monte Carlo algo rithm. Part of this work has been supported by the Chinese Scholarship Council (CSC, 20120602000 7) and by the Hypanema ANR Project n ◦ ANR-12-BS03-003. 2 I . I N T RO D U C T I O N The problem of fusing a high spatial and low sp ectral resolution image with an aux iliary image of higher sp ectral but lower spatial resolution, a lso known as multi-resolution image fusion , has been explored for many years [1]–[3]. Whe n c onsidering remotely sen sed images, an a rchetypal fusion task is the pansha rpening, which ge nerally consists of fusing a high spatial resolution panch romatic (P AN) image and low sp atial resolution multispectral (MS) image. Pansha rpening has been ad dressed in the image p rocessing an d remote sen sing literatures for several d ecade s and still remains an activ e topic [1], [4]–[7]. More recently , hypersp ectral (HS) imaging , wh ich cons ists of acquiring a same s cene in several h undreds of con tiguous spectral ba nds, has open ed a new range of relevant applications, such as target detection [8], clas sification [9] and spe ctral unmixing [10]. Naturally , to take a dvantage of the newest b enefits off ered by HS images, the problem of fusing HS a nd P AN images has been explored [11], [12]. Capitalizing on dec ades of experienc e in MS pan sharpen ing, most of the HS pansha rpening approache s mere ly ada pt existing algorithms for P AN a nd MS fusion [13], [14]. Other methods are spe cifically des igned to the HS pans harpening problem (see , e.g., [12], [15], [16]). Con versely , the fusion of MS a nd HS image s has bee n considered in fewer research works and is still a challeng ing problem be cause of the high dime nsion of the data to be proc essed . Inde ed, the fusion of MS a nd HS d if fers from traditional MS or HS pansh arpening by the fact that more spatial and spectral information is containe d in mu lti-band image s. This additional information can be exploited to obtain a high spatial and spectral res olution image . In prac tice, the spe ctral ban ds of pa nchromatic images always c over the visible and infra-red spec tra. However , in several practical applications, the spectrum o f MS d ata includes additional high-frequency spec tral bands . For instance the MS data of W orldV ie w-3 have spe ctral bands in the intervals [400 ∼ 1750 ] nm and [2145 ∼ 2365 ] nm whereas the P AN data are in the range [450 ∼ 800] nm [17]. Another interesting example is the HS+MS suite (ca lled Hyperspectral image r s uite (HISUI)) that has been d eveloped by the Japanese Ministry of Economy , T rade, a nd Industry (METI) [18]. H ISUI is the Japa nese next-generation Ea rth- observing se nsor composed of HS and MS imagers and will be lau nched by H-IIA rocket in 201 5 or later as one of miss ion instruments o nboard J A XA ’ s ALOS-3 sa tellite. Some resea rch a ctivit ies have already been condu cted for this practical multi-band fusion problem [19]. Noticeably , a lot of pansha rpening me thods, s uch as co mponent s ubstitution [20][2], relativ e spectral contributi on [21] and h igh-frequency injection [22] a re inapplica ble or inefficient for the HS+MS fus ion problem. T o address the challenge rais ed b y the high d imensionality of the da ta to be fuse d, innovati ve methods need to be developed. Th is is the main o bjectiv e of this pap er . As demonstrated in [23], [24], the fusion of HS a nd MS images can be con veniently formu- lated within a B ayesian inference framework. Ba yesian fusion allows an intuitive interpretation o f 3 the fusion process v ia the p osterior distributi on. Since the fusion p roblem is u sually ill-posed, the Bayesian method ology offers a con venient way to regularize the problem by defi ning appropriate prior distributi on for the scene of interest. Following this strategy , Hardie et al. prop osed a Bay esian estimator for fusing co -registered high s patial-resolution MS a nd high spec tral-resolution HS image s [23]. T o improve the deno ising pe rformance, Zh ang et. al impleme nted the e stimator of [23] in the wa velet domain [24]. In [25], Zh ang et al. de ri ved a n expectation-maximization (EM) algorithm to maximize the p osterior distrib ution of the unknown imag e via de blurring and den oising s teps. In this paper , a prior knowledge a ccounting for artificial constraints related to the fus ion problem is incorporated within the mo del via the prior distrib ution assigne d to the scen e to be es timated. Many strategies related to HS resolution enhanc ement have be en propo sed to define this prior dis- trib ution. For ins tance, in [6], the highly resolved image to be e stimated is a priori modeled by an in-homoge neous Gaussian Markov rando m field (IGMRF). The parameters of this IGMRF are empirically es timated from a panchroma tic image in the first step of the analysis. In [23] and related works [26], [27], a multiv ariate Gauss ian distrib ution is propos ed as prior distributi on for the unobse rved scene . The resulting conditional me an and covari ance matrix can then b e inferred using a standard clustering technique [23] or using a stocha stic mixing model [26], [27], incorporating spectral mixing constraints to improve spectral accu racy in the estimated high resolution imag e. In this p aper , we propos e to explicitly exploit the acquisition p rocess o f the different imag es. More precisely , the senso r s pecifica tions (i.e., spe ctral or spa tial respon ses) are exploited to properly des ign the spatial or spectral degradations suffered by the image to be recovered [28]. Moreover , to defi ne the prior distrib ution a ssigned to this imag e, we reso rt to ge ometrical co nsiderations we ll admitted in the HS imaging literature dev oted to the linear un mixing problem [10]. In pa rticular , the high spa tial resolution HS image to be es timated is as sumed to liv e in a lower dimensional s ubspac e, which is a suitable hypo thesis when the observed scene is co mposed of a finite number of macroscopic materials. W ithin a Ba yesian estimation frame work, two statistical estimators are generally considered. The minimum mean square error (MMSE) estimator is defined as the mean o f the po sterior distribution. Its computation gen erally requires intractable multidimensiona l integrations. Con versely , the max imum a posteriori (MAP) e stimator is de fined a s the mod e o f the po sterior distrib ution and is usually assoc iated with a pe nalized maximum likeli hood a pproach . Mainly due to the comp lexity o f the integration required by the c omputation of the MMSE estimator (espec ially in high-dimension data space ), mo st of the Baye sian estimators have propose d to solve the HS an d MS fusion problem using a MAP formulation [23], [24], [29]. Howe ver , o ptimization algorithms designed to maximize the po sterior d istrib ution may suffer from the prese nce of local extrema, that prevents a ny gua rantee to con ver ge to wards the actual maximum of the p osterior . In this pa per , we propose to compute the MMSE estimator of the unkn own scene by using samples gen erated b y a Markov c hain Monte 4 Carlo (MCMC) algo rithm. The po sterior distrib ution res ulting from the propose d forward model and the a priori mode ling is defined in a high dimensiona l spac e, which makes difficult the u se of a ny con ventional MCMC algorithm, e.g., the Gibbs sampler [30] or the Metropolis-Hastings sampler [31]. T o overcome this difficulty , a pa rticular MCMC scheme, called Hamiltonian Monte Ca rlo (HMC) algorithm, is deri ved [32]–[34]. It dif fers from the s tandard Metropo lis-Hastings algorithm by exploiting Hamiltonian evoluti on dynamics to propose s tates with higher acceptance ratio, redu cing the co rrelation b etween succe ssive sample s. The pape r is or ganize d as follo ws. Section II formulates the fusion problem in a Ba yesian frame- work, with a p articular attention to the forward mod el that exploits physical considerations. Section III deriv es t he hierarchical Ba yesian model to obtain the joint posterior distrib ution of the unknown image , its pa rameters a nd hy perparameters. In Section IV, the hybrid Gibb s sampler bas ed on Hamiltonian MCMC is i ntroduced to sample t he desired posterior distr ibution. Si mulations are conducted in Section V and c onclusion s are fina lly reported in S ection VI. I I . P R O B L E M F O R M U L A T I O N A. Notations and ob serva tion mode l Let Z 1 , . . . , Z P denote a set of P images acquired by diff erent optical sensors for a same scene X . These images are as sumed to come from pos sibly heterogeneou s imaging s ensors. Therefore, these measureme nts can be o f d if ferent natures , e.g., P AN, MS and HS, with different spatial a nd/or sp ectral resolutions. As in many p ractical situations, the ob served data Z p , p = 1 , . . . , P , are su ppose d to be degraded versions o f the high-spectral a nd high-spatial res olution scene X , according to the following observation mode l Z p = F p ( X ) + E p . (1) In (1), F p ( · ) is a linea r transformation that models the d egradation ope rated on X . As previously assume d in nu merous works (see for instance [6], [24], [29], [35], [36] a mong some recent contribu- tions), these degradations may include spatial blurring, s pectral blurring, decimation ope ration, etc. In what follows, the remotely sen sed images Z p ( p = 1 , . . . , P ) a nd the un observed scen e X are assume d to be pixelated imag es of sizes n x ,p × n y ,p × n λ,p and m x × m y × m λ , respectiv ely , where · x and · y refer to b oth spatial dimensions of the images, a nd · λ is for the sp ectral dimension. Moreover , in the right-hand s ide of (1), E p stands for an add iti ve error term that both reflects the mismodeling and the obs ervation noise. Classically , the observed image Z p can be lexicograp hically ordered to build the N p × 1 vector z p , where N p = n x ,p n y ,p n λ,p is the total numbe r of measure ments in the obs erved image Z p . For multi-band image s, this vectorization can b e pe rformed following either ba nd seq uential (BSQ), band 5 interleav ed by line (BIL) or band interleav ed b y pixel (BIP) sc hemes (see [37 , p p. 103 –104] for a more detailed description of thes e d ata format con ventions). For writing co n venience, but without any los s of generality , the BIP-like vectorization sch eme is ad opted in what follo ws (see paragraph III-B1). As a conseque nce, the obs ervation equation (1) c an be ea sily rewri tten as follows z p = F p x + e p (2) where the M × 1 vector x and the N p × 1 vector e p are orde red versions of the scene X (with M = m x m y m λ ) a nd the no ise term E p , resp ectiv ely . In this work, the n oise vector e p will be assume d to be a band-depen dent G aussian sequenc e, i.e., e p ∼ N 0 N p , Λ p where 0 N p is an N p × 1 vector made of ze ros and Λ p = I n x ,p n y ,p ⊗ S p is an N p × N p matrix where I n x ,p n y ,p ∈ R n x ,p n y ,p × n x ,p n y ,p is the identity matrix, ⊗ is the Kron ecker product and S p ∈ R n λ,p × n λ,p is a diagon al matrix containing the noise variances, i.e., S p = diag h s 2 p, 1 · · · s 2 p,n λ,p i . The Gaussian no ise a ssumption is qu ite popular in image proces sing [38]–[40] as it facilitates the formulation of the likelihood an d the optimization algorithm. Howev er , the p roposed Bay esian model co uld be modifie d, for instance to take into a ccount correlations b etween s pectral ba nds, following the strategy in [41]. Note also that the v ariance ma trix S p of the no ise vector e p depend s on the obs erved data z p , sinc e the sign al-to-noise ratio may dif fer from one se nsor to a nother . In (2), F p is an N p × M matrix that reflects the spatial and/or spe ctral degradation F p ( · ) operated on x . As in [23], F p ( · ) can represe nt a spatial de cimating operation. For instance , when applied to a single-band imag e (i.e., n λ,p = m λ = 1 ) with a dec imation factor q in both spatial d imensions, it is easy to s how that F p is an n x ,p n y ,p × m x m y block diagonal ma trix giv en in (3) with m x = dn x ,p and m y = dn y ,p [42]. F p = 1 d 2 11 . . . 1 | {z } d 2 11 . . . 1 | {z } d 2 . . . 11 . . . 1 | {z } d 2 (3) Another example of degradation freque ntly en countered i n the signal a nd i mage processing l iterature is spa tial blurring [24], where F p ( · ) usu ally repres ents a 2 -dimensional conv olution by a kernel κ p . Similarly , whe n app lied to a single-ba nd image , F p is a n n x n y × n x n y (generally sp arse) T oeplitz matrix, that is symmetric for a symmetric c on v olution kernel κ p . The prob lem ad dressed in this pa per cons ists of recovering the high-spectral and high-spatial resolution sc ene x by fusing the various spatial and/or spe ctral information provided by all the 6 T ABLE I N O TA T I O N S Notation Definition Size X unobserv ed scene or target image m x × m y × m λ x vectorization of X m x m y m λ × 1 x i band vector at i th position of x m λ × 1 u vectorized image after reducing band dimension by PCA m x m y e m λ × 1 u i band vector at i th position of u e m λ × 1 ¯ µ u prior mean of u m x m y e m λ × 1 ¯ Σ u prior cov ari ance of u m x m y e m λ × m x m y e m λ µ u i prior mean of u i e m λ × 1 Σ u i prior cov ari ance of u i e m λ × e m λ Z p p th remotely sensed images n x ,p × n y ,p × n λ,p z p vectorization of Z p n x ,p n y ,p n λ,p × 1 z set of P vecto rized observed images z p n x ,p n y ,p n λ,p P × 1 observed image s z = { z 1 , . . . , z P } . T o facilit ate reading , notations have been summarized in T able I. B. Baye sian estimation of x In this work, we propo se to estimate the unknown scene x within a Ba yesian estimation framework. In this statistical es timation scheme, the fused highly-reso lved i mage x is inferred throu gh its posterior distrib ution f ( x | z ) . Gi ven the observed data, this target distrib ution can be deri ved from the likelihood function f ( z | x ) an d the prior distribution f ( x ) by using the Bayes ’ formula f ( x | z ) = f ( z | x ) f ( x ) f ( z ) . (4) Based o n the pos terior distribution (4) , several es timators of the sc ene x can be in vestigate d. For instance, maximizing f ( x | z ) leads to the MAP es timator ˆ x MAP ˆ x MAP = arg max x f ( x | z ) = arg max x f ( z | x ) f ( x ) . (5) This e stimator ha s b een widely exploited for HS image resolution enhanc ement (see for ins tance [23], [26 ], [27] or more recently [6], [24]). Th is work proposes to focus on the first moment of the posterior distribution f ( x | z ) , which is known as the posterior me an estimator or the minimum mean 7 square err or es timator ˆ x MMSE . This e stimator is define d a s ˆ x MMSE = E [ x | z ] = Z x f ( x | z ) d x = R x f ( z | x ) f ( x ) d x R f ( z | x ) f ( x ) d x . (6) In this work, we prop ose a fl exible and relev ant statistical mo del to solve the fusion problem. Deriving the corresp onding Bayesian estimators ˆ x MMSE defined in (5) an d (6), requires the d efinition of the likelihood func tion f ( z | x ) and the prior distrib ution f ( x ) . The se quantities a re detailed in the next section. I I I . H I E R A R C H I C A L B A Y E S I A N M O D E L A. Likelihood function The statistical prope rties o f the noise vectors e p ( p = 1 , . . . , P ) allow o ne to state that the obse rved vector z p is normally dis trib uted with mea n vector F p x a nd cov ariance matrix Λ p . Conseque ntly , the likelihood function, that represents a data fitting term relativ e to the obse rved vec tor z p , ca n be easily deriv ed lea ding to f ( z p | x , Λ p ) = (2 π ) − N p 2 | Λ p | − n x ,p n y ,p 2 × exp − 1 2 ( z p − F p x ) T Λ − 1 p ( z p − F p x ) (7) where | Λ p | is the determinan t of the matrix Λ p . As me ntioned in the previous section, the collected measureme nts z may have been acqu ired by diff erent (possibly he terogeneo us) senso rs. Therefore, the ob served vectors z 1 , . . . , z P can be gen erally assu med to be indepe ndent, cond itionally upon the unobse rved scene x and the noise covariances Λ 1 , . . . , Λ p . As a cons equen ce, the joint likelihood function of the observed data is f ( z | x , Λ ) = P Y p =1 f ( z p | x , Λ p ) (8) with Λ = ( Λ 1 , . . . , Λ P ) T . B. Prior d istributi ons The unk nown parameters are the s cene x to be recovered and the noise cov ariance matrix Λ relative to eac h ob servation. In this section, p rior distributions are introduced for thes e parameters. 8 1) Sc ene prior: Follo wing a BIP s trategy , the vectorized image x can be decompose d as x = h x T 1 , x T 2 , · · · , x T m x m y i T , wh ere x i = [ x i, 1 , x i, 2 , · · · , x i,m λ ] T is the m λ × 1 vector correspo nding to the i th spatial location (with i = 1 , · · · , m x m y ). The HS vector x i usually li ves in a subsp ace whose dimension is muc h s maller than the number of bands m λ [43], [44]. In order to accoun t for this subspa ce of reduce d dimension e m λ , we introduce a linear transformation from R m λ × 1 to R e m λ × 1 such that u i = V x i (9) where u i is the projection of the vector x i onto the subspac e of interest a nd the transformation ma trix V is of size e m λ × m λ . Using the no tation u = h u T 1 , u T 2 , · · · , u T m x m y i T , we have u = V x , whe re V is an f M × M bloc k-diagonal matrix whose blocks a re equal to V and f M = m x m y e m λ . Instead of assigning a prior distributi on to the vectors x i , we propose to de fine a prior for the projected vectors u i ( i = 1 , · · · , m x m y ) u i | µ u i , Σ u i ∼ N µ u i , Σ u i . (10) Assigning a prior to the projected vectors u i allows the ill-posed problem (2) to be regularized. The covari ance ma trix Σ u i is designe d to explore the c orrelations between the diff erent spe ctral ba nds after projection in the subspac e o f interest. Also, the mean ¯ µ u of the whole image u a s well a s its covari ance matrix ¯ Σ u can be c onstructed from µ u i and Σ u i as follows ¯ µ u = µ T u 1 , · · · , µ T u m x m y T , ¯ Σ u = diag Σ u 1 , · · · , Σ u m x m y . (11) Note that the choice of the hyperpa rameters ¯ µ u and ¯ Σ u will be d iscusse d later in Section III-C. Choosing a Gaussian prior for the vec tors u i is motiv ated by the fact this kind of prior has been used succe ssfully in several works related to the fusion of multiple degrad ed imag es, including [26], [45], [46]. Note tha t the Gauss ian prior has also the interest of being a conjugate distrib ution relativ e to the statistical mo del in (8). As it will be shown in Section IV, coup ling this Ga ussian prior distrib ution with the Gaussian likelihood function leads to s impler estimators constructed from the posterior distrib ution f ( u | z ) . Finally , it is interesting to men tion tha t the prop osed method is quite robust to the no n-Gaussian ity of the image. Some additional results obtained for synthetic non-Ga ussian images as well as related discus sions are available in [47]. 2) Noise variance pr iors: As in nu merous works including [48], con jugate in verse-gamma distri- buti ons are chosen as prior distrib utions for the noise variances s 2 p,i ( i = 1 , . . . , n λ,p , p = 1 , . . . , P ) s 2 p,i | ν, γ ∼ I G ν 2 , γ 2 . (12) Again, these c onjugate distributions will allow close d-form expression s to b e o btained for the conditional distributi ons f s 2 p,i | z of the noise variances. Other motiv ations for u sing this k ind of 9 prior distrib ution can be foun d in [49]. In particular , the in verse-gamma distrib ution is a very flexible distrib ution whose sh ape c an be adjusted by its two parameters. For simplicity , we propos e to fix the hype rparameter ν wh ereas the h yperparame ter γ will be estimated from the data. By ass uming the variances s 2 = h s 2 1 , 1 , . . . , s 2 1 ,n λ, 1 , . . . , s 2 P , 1 , . . . , s 2 P ,n λ,P i are a prior i independe nt, the joint prior distrib ution of the noise variance vector s 2 is f s 2 | ν, γ = P Y p =1 n λ,p Y i =1 f s 2 p,i | ν, γ . (13) C. Hyper parameter priors The hyp erparameter vector ass ociated with the para meter priors de fined above includes ¯ µ u , ¯ Σ u and γ . The q uality of the fusion algorithm in vestigated in this p aper de pends o n the values of the hyperparame ters that ne ed to be adjusted carefully . Instead of fixing all the se hyperpa rameters a priori , we propose to e stimate some of the m from the data by using a hierarchic al B ayesian algorithm [50, C hap. 8]. Specifica lly , we propose to fix ¯ µ u as the interpolated HS imag e in the subspa ce of interest following the s trategy in [23]. Similarly , to reduce the numb er of statistical parameters to be estimated, all the covariance matrix are a ssumed to be equal, i.e. , Σ u 1 = · · · = Σ u m x m y = Σ u . Thu s, the h yperparame ter vector to be estimated jointly with the p arameters o f interest is Φ = { Σ u , γ } . The prior distributions for the se two hyperparame ters are d efined below . 1) Hyp erparamete r Σ u : Assigning an a priori in verse-W ishart distribution to the covariance matr ix of a Gauss ian vector has provided interesting res ults in the signal a nd image proce ssing literature [51], [52]. Following thes e works, we have chosen the following prior for Σ u Σ u ∼ W − 1 ( Ψ , η ) (14) whose dens ity is f ( Σ u | Ψ , η ) = | Ψ | η 2 2 η e m λ 2 Γ e m λ ( η 2 ) | Σ u | − η + e m λ +1 2 e − 1 2 tr( ΨΣ − 1 u ) . Again, the hyp er- hyperpa rameters Ψ an d η will be fixed to provide a n on-informati ve p rior . 2) Hyp erparamete r γ : T o refle ct the absence of p rior knowledge regarding the mean noise level, a non -informati ve Jeffre ys’ prior is ass igned to the hyperparameter γ f ( γ ) ∝ 1 γ 1 R + ( γ ) (15) where 1 R + ( · ) is the indicator function defin ed on R + 1 R + ( u ) = 1 , if u ∈ R + , 0 , otherwise. (16) The use of the improper distribution (15) is classical and can be justified by d if ferent mean s (e.g., see [49]), providing tha t the corresponding full p osterior distrib ution is statistically well define d, which is the ca se for the proposed fus ion mode l. 10 D. Inferring the highly-r esolve d HS image fr om the posterior distribution o f its projection u Follo wing the pa rametrization in the prior model (9), the u nknown parame ter vec tor θ = u , s 2 is c ompose d of the projected scene u and the noise variance vector s 2 . The joint pos terior distribution of the unknown parameters and hy perparameters c an be c omputed follo wing the hierarchical mo del f ( θ , Φ | z ) ∝ f ( z | θ ) f ( θ | Φ ) f ( Φ ) . (17) By as suming prior independen ce betwe en the hyperparameters Σ u and γ and the parameters u and s 2 conditionally upon ( Σ u , γ ), the following results ca n b e ob tained f ( θ | Φ ) = f ( u | Σ u ) f s 2 | γ (18) and f ( Φ ) = f ( Σ u ) f ( γ ) . (19) Note that f ( z | θ ) , f ( u | Σ u ) and f s 2 | γ have been defi ned in (8), (10) and (13), respe ctiv ely . The posterior distributi on of the projected highly resolved image u , required to compute the Bayesian estimators (5) and (6), is obtained by mar ginalizing out the hyperparameter vector Φ and the nois e variances s 2 from the joint posterior distrib ution f ( θ , Φ | z ) f ( u | z ) ∝ Z f ( θ , Φ | z ) d Φ ds 2 1 , 1 , . . . , ds 2 P ,n λ,P . (20) The posterior distrib ution (20) is too complex to obtain closed-form expressions of the MMSE an d MAP es timators ˆ u MMSE and ˆ u MAP . As an a lternati ve, this pape r proposes to us e an MCMC a lgorithm to gene rate a collection of N MC samples U = n ˜ u (1) , . . . , ˜ u ( N MC ) o (21) that a re as ymptotically distrib uted according to the po sterior of interest f ( u | z ) . Th ese sa mples will be u sed to compute the Bayes ian estimators of u . More p recisely , the MMSE e stimator of u will be approximated by an empirical average of the generated samples ˆ u MMSE ≈ 1 N MC − N bi N MC X t = N bi +1 ˜ u ( t ) (22) where N bi is the numbe r of burn-in iterations. Once the MMSE estimate ˆ u MMSE has been computed, the highly-reso lved HS image can be compu ted as ˆ x MMSE = V T ˆ u MMSE . (23) Sampling d irectly acco rding to the marginal pos terior distribution f ( u | z ) is not straightforward. Instead, we propose to sample a ccording to the joint posterior f u , s 2 , Σ u | z (hyperparameter γ has been mar ginalized) by us ing a Me tropolis-within-Gibbs sampler , which can be e asily implemented since all the conditional distributi ons assoc iated with f u , s 2 , Σ u | z are relatively simple. T he resulting hyb rid Gibb s sampler is detailed in the following s ection. 11 I V . H Y B R I D G I B B S S A M P L E R The Gibbs samp ler has receiv ed a considerable att ention in the s tatistical community (see [30], [50]) to solve Bay esian estimation problems. The interes ting property o f this Monte Carlo algorithm is that it only req uires to d etermine the c onditional d istrib utions ass ociated with the distribut ion o f interes t. These conditional d istrib utions are gen erally ea sier to simulate tha n the joint tar get d istrib ution. The block Gibb s s ampler that we propose to sample according to f u , s 2 , Σ u | z is d efined by a 3 -step procedure reported in Algo. 1. The d istrib ution inv olved in this algorithm a re detailed b elow . A L G O R I T H M 1 : Hybrid G ibbs sampler for t = 1 to N MC do % Sampling the imag e variance s - see paragr aph IV -A Sample ˜ Σ ( t ) u accordin g to the con ditional distribution (24), % Sampling the high-r esolved image - see paragr aph IV -B Sample ˜ u ( t ) using an HMC algorithm detailed in Algo . 2 % Sampling the noise variances - s ee para graph IV -C for p = 1 to P do for i = 1 to n λ,p do Sample ˜ s 2( t ) p,i from the cond itional d istribution (32), end for end for end for A. Sampling Σ u according to f Σ u | u , s 2 , z Standard computations yield the following in verse-W ishart distribution as c onditional distrib ution for the c ov ariance ma trix Σ u (of the s cene to be recovered) Σ u | u , s 2 , z ∼ W − 1 Ψ + m x m y X i =1 ( u i − µ u i ) T ( u i − µ u i ) , m x m y + η ! . (24) 12 B. Sampling u according to f u | Σ u , s 2 , z Choosing the conjug ate distributi on (10) as prior distrib ution for the projected unknown image u leads to the following conditional pos terior distrib ution for u u | Σ u , s 2 , z ∼ N µ u | z , Σ u | z (25) with Σ u | z = h ¯ Σ − 1 u + P P p =1 V F T p Λ − 1 p F p V T i − 1 µ u | z = Σ u | z h P P p =1 V F T p Λ − 1 p z p + ¯ Σ − 1 u ¯ µ u i (26) Sampling directly acc ording to this multi variate Gaus sian distrib ution requ ires the in version of an f M × f M ma trix, which is impossible in most fusion problems. An alternati ve would consist of sampling each e lement u i ( i = 1 , . . . , f M ) of u cond itionally upon the others a ccording to f u i | u − i , s 2 , Σ u , z , where u − i is the vector u whose i th comp onent has been removed. Howev er , this alternativ e would require to sample u by using f M Gibb s moves, which is time demanding and leads to po or mixing properties. The efficient strategy adopted in this work relies on a p articular MCMC method, ca lled Hamiltonian Monte Carlo (HMC) me thod (sometimes referred to as hybrid Mo nte Carlo me thod), which is consid- ered to generate vectors u directly . More precisely , we con sider the HMC algorithm initially proposed by Duane et a l. for simulating the lattice field theory in [32]. As de tailed in [33], this technique allows mixing property of the sampler to be improved, es pecially in a high-dimensional problem. It exploits the gradient of the distrib ution to be sampled by introdu cing a uxiliary “momentum” v ariables m ∈ R f M . The joint distribution of the unknown pa rameter vector u and the momentum is defin ed as f u , m | s 2 , Σ u , z = f u | s 2 , Σ u , z f ( m ) where f ( m ) is the normal probab ility d ensity function (pdf) with zero mea n and identity covariance matrix. T he Hamiltonian of the c onsidered sys tem is d efined b y taking the n egati ve logarithm of the posterior distribution f u , m | s 2 , µ u , Σ u , z to be sa mpled, i.e., H ( u , m ) = − log f u , m | s 2 , µ u , Σ u , z = U ( u ) + K ( m ) (27) where U ( u ) is the potential energy func tion defi ned b y the negati ve logarithm of f u | s 2 , Σ u , z and K ( m ) is the corresponding k inetic ene r gy U ( u ) = − log f u | s 2 , Σ u , z K ( m ) = 1 2 m T m . (28) 13 The parameter space whe re ( u , m ) lives is explored following the sch eme detailed in Algo 2. At iteration t o f the Gibbs samp ler , a so-ca lled leap-fr ogging procedure compose d of N leapfrog iterations is achieved to p ropose a move from the current state ˜ u ( t ) , ˜ m ( t ) to the state ˜ u ( ⋆ ) , ˜ m ( ⋆ ) with step size ε . This move is operated in R f M × R f M in a direc tion giv en b y the gradien t of the energy fun ction ∇ u U ( u ) = − P X p =1 V F T p Λ − 1 p z p − F p V T u + Σ − 1 u ( u − ¯ µ u ) . (29) Then, the new state is a ccepte d with probability ρ t = min { 1 , A t } whe re A t = f ˜ u ( ⋆ ) , ˜ m ( ⋆ ) | s 2 , Σ u , z f ˜ u ( t ) , ˜ m ( t ) | s 2 , Σ u , z = exp h H ˜ u ( t ) , ˜ m ( t ) − H ˜ u ( ⋆ ) , ˜ m ( ⋆ ) i . (30) A L G O R I T H M 2 : Hybrid Mont e Carlo algorithm % Momentum initiali zation Sample ˜ m ( ⋆ ) ∼ N 0 f M , I f M , Set ˜ m ( t ) ← ˜ m ( ⋆ ) , % Leapfr og ging for j = 1 to N L do Set ˜ m ( ⋆ ) ← ˜ m ( ⋆ ) − ε 2 ∇ u U ˜ u ( ⋆ ) , Set ˜ u ( ⋆ ) ← ˜ u ( ⋆ ) + ε ˜ m ( ⋆ ) , Set ˜ m ( ⋆ ) ← ˜ m ( ⋆ ) − ε 2 ∇ u U ˜ u ( ⋆ ) , end for % Accept/r eje ct pr ocedur e, See (30) Sample w ∼ U ([0 , 1]) , if w < ρ t then ˜ u ( t +1) ← ˜ u ( ⋆ ) else ˜ u ( t +1) ← ˜ u ( t ) end if Set ˜ x ( t +1) = V T ˜ u ( t +1) Run Algo. 3 to up date stepsize This accept/reject p rocedure ensures that the simulated vectors ( ˜ u ( t ) , ˜ m ( t ) ) are a symptotically distrib uted a ccording to the distribution of interest. The way the parameters ε and N L have been adjusted will be detailed in Se ction V. 14 T o sample according to a high-dimens ion Gauss ian d istrib ution such as f u | Σ u , s 2 , z , one might think of using othe r simulation tec hniques s uch as the method proposed in [53] to solve supe r resolution problems. Similarly , Orieux et al. have prop osed a perturbation approac h to s ample high- dimensional Gaussian distr ibuti ons for general linear i n verse problems [54]. Ho wev er , these techniques rely on additional optimization schemes include d within the Monte Carlo algorithm, which implies that the generated samples are only approx imately distrib uted according to the tar get distribution. Con versely , the HMC s trategy proposed he re ensures asymptotic con vergence of the generated samples to the po sterior distribution. Moreover , the HMC metho d is very flexible and c an be e asily extended to hand le no n-Gaussian pos terior distributions contrary to the methods in vestigated in [53 ], [54]. C. Sampling s 2 according to f s 2 | u , Σ u , z The cond itional p df of the noise variance s 2 p,i ( i = 1 , . . . , n λ,p , p = 1 , . . . , P ) is f s 2 p,i | u , Σ u , z ∝ 1 s 2 p,i ! n x ,p n y ,p 2 +1 exp − ( z p − F p V T u ) i 2 2 s 2 p,i ! (31) where ( z p − F p V T u ) i contains the elements of the i th b and. Ge nerating samples s 2 p,i distrib uted according to f s 2 p,i | u , Σ u , z is c lassically achieved by d rawing s amples from the following in verse- gamma distrib ution s 2 p,i | u , z ∼ I G n x ,p n y ,p 2 , ( z p − F p V T u ) i 2 2 ! . (32) In practice, if the noise variances are known a prior , we s imply assign the n oise variances to be known values an d remove the s ampling of the noise variances. D. Complexity Analys is The MCMC method can b e computationally cos tly compa red with optimization methods [55]. The complexity of the proposed Gibbs sampler is ma inly due to the Ha miltonian Monte Ca rlo metho d. The complexity of the Hamiltonian MCMC method is O (( f m λ ) 3 ) + O (( f m λ m x m y ) 2 ) , w hich is highly expensive a s m λ increases . Generally the number o f pixels m x m y cannot be reduced s ignificantly . Thus, projecting the high-dimensional m λ × 1 vectors to a low-dimension sp ace to form f m λ × 1 vectors de creases the c omplexity while keep ing mos t important information. V . S I M U L A T I O N R E S U L T S This section s tudies the performance of the proposed Bayes ian fus ion algorithm. The referenc e image, c onsidered he re as the high s patial and high spectral image , is an hyperspec tral image acqu ired over Moffett field, CA, in 1994 by the JPL /N ASA airborne visible/infrared imaging spectrometer 15 20 40 60 80 100 120 140 160 0 0.5 1 Band R 20 40 60 80 100 120 140 160 0 0.5 1 Band R + nois e Fig. 1. LANDSA T spectral response s. (T op) without noise. (Bottom) with an additiv e Gaussian noise with FSNR = 8dB. (A VIRIS) [56]. This image was initially composed of 224 ban ds that hav e been redu ced to 177 ba nds ( m λ = n λ, 1 = 177 ) a fter removing the water vapor a bsorption ban ds. A. Fusion of HS and MS images W e propose to reconstruct the referen ce HS image from two lower resolved images. First, a high- spectral low- spatial resolution image z 1 , denoted as HS image, ha s been ge nerated by ap plying a 5 × 5 averaging filter on eac h b and of the reference image. Be sides, an MS imag e z 2 is obtained by succe ssively averaging the adjac ent bands a ccording to realistic spec tral responses. More precisely , the referenc e imag e is filtered using the LA NDSA T -l ike spectral respo nses d epicted in the top of Fig. 1, to o btain a 7 -band ( n λ, 2 = 7 ) MS image . N ote here tha t the observation mode ls F 1 and F 2 correspond ing to the HS and MS images a re perfectly known. In ad dition to the b lurring a nd s pectral mixing, the HS and MS imag es have bee n both contaminate d by zero-mean additiv e Gaus sian n oise. The noise power s 2 p,i depend s on the s ignal to noise ratio S NR p,i ( i = 1 , · · · , n λ,p , p = 1 , 2) defined by SNR p,i = 10 log 10 k ( F p x ) i k 2 F n x ,p n y ,p s 2 p,i , where k . k F is the Frobe nius norm. Our simulations have b een conduc ted with SNR 1 , · = 35 dB for the first 127 bands and SNR 1 , · = 30 dB for the rema ining 50 bands of the H S image . For the MS image , SNR 2 , · is 30d B for a ll b ands. A composite color i mage, formed by selecting the red, green and blue bands of the high-spa tial resolution HS image (the reference image) is shown in the right bottom of Fig. 2. The noise-con taminated HS and MS imag es are de picted in the top left and top right o f Fig. 2 . 1) Su bspace learning: T o learn the ma trix V in (9), we propose to u se the p rincipal componen t analysis (PCA) which is a c lassical d imensionality redu ction techn ique us ed in HS imagery . As in paragraph III-B1, the vectorized HS image z 1 can be written as z 1 = h z T 1 , 1 , z T 1 , 2 , · · · , z T 1 ,n x , 1 n y , 1 i T , 16 Fig. 2. A VIRIS dataset: (T op left) HS Image. (T op middle) MS Image. (T op right) MAP [23]. (Bottom left) W avelet MAP [24]. (Bottom middle) Hamiltonian MCMC. (Bottom right) Reference. where z 1 ,i = z 1 ,i, 1 , z 1 ,i, 2 , · · · , z 1 ,i,n λ, 1 T . Then, the sample covariance matrix of the HS image z 1 is diagonalized lead ing to W T ΥW = D (33) where W is an m λ × m λ orthogonal matrix ( W T = W − 1 ) and D is a diagonal matrix whose diagonal e lements are the ordered eigenv alues of Υ de noted as d 1 ≥ d 2 ≥ ... ≥ d m λ . The di- mension of the projection su bspace e m λ is de fined as the minimum integer satisfying the c ondition P e m λ i =1 d i / P m λ i =1 d i ≥ 0 . 99 . The matrix V is then cons tructed as the eigen vectors as sociated with the e m λ lar gest eigen values of Υ . As an illustration, the eigen v alues of the sa mple covariance matrix Υ for the Mof fett field image are display ed in Fig. 3. For this example, the e m λ = 10 eigen vectors contain 99 . 93% of the information. 0 20 40 60 80 100 120 140 160 10 −4 10 −3 10 −2 10 −1 10 0 10 1 10 2 Principal Component Number Eigenvalue Fig. 3. Eigen v alues of Υ for the HS i mage. 17 2) Hyp er-hyperparameters selection: In our experiments, fixed hyper-hyperparameters have bee n chosen as follo ws: Ψ = I e m λ , η = e m λ + 3 . These choice s c an be motiv ated by the follo wing arguments: • The identity matrix assigned to Ψ ensu res a non-informati ve prior . • Setting the in verse ga mma parameters to η = e m λ + 3 also lead s to a non-informativ e prior [48]. • Note that parameter ν dis appears when the joint pos terior is integrated ou t with respect to parameter γ . B. Stepsiz e an d Leapfro g Step s The performance of the HMC metho d is ma inly governed by the stepsize ε and the n umber of leapfrog steps N L . As pointed out in [34], a too lar ge stepsize will result in a very low acceptance rate and a too s mall stepsize yields high computational complexity . In order to ad just the steps ize parameter ε , we propose to mon itor the statistical accep tance ratio ˆ ρ t defined as ˆ ρ t = N a,t N W where N W is the len gth of the counting window (in our experiment, the c ounting window at time t c ontains the vectors ˜ x ( t − N W +1) , ˜ x ( t − N W ) , · · · , ˜ x ( t ) with N W = 50 ) and N a,t is the number of a ccepted samp les in this window at time t . As explained in [57], the a daptiv e tuning sh ould ad apt les s and less as the algorithm procee ds to gua rantee that the generate d sa mples form a stationary Markov cha in. In the proposed implementation, the parameter ε is adjusted as in Algo. 3. The thresh olds h ave been fixed to ( α d , α u ) = (0 . 3 , 0 . 9) and the scale parameters are ( β d , β u ) = (1 . 1 , 0 . 9) (thes e parameters were adjusted by cross-validation). Note that the initial value of ε sho uld no t be too lar ge to ‘blow u p’ the leapfrog trajectory [34]. Generally , the step size con ver ges after s ome iterations o f Algo. 3. Regarding the number of leapfrogs, s etting the trajec tory length N L by trial a nd error is nec essary [34]. T o av oid the potential resona nce, N L is rando mly cho sen from a uniform distributi on from N min to N max . After some preliminary runs and tes ts, N min = 50 and N max = 55 have been selec ted. C. Evaluation o f the F usion Quality T o ev aluate the qu ality of the propo sed fusion strategy , dif ferent imag e quality measu res can b e in ves tigated. Refe rring to [24 ], we propose to u se RSNR, SAM, UIQI, ERGAS and DD a s defined below . a) RSNR: T he rec onstruction SNR (RSNR) is related to the diff erence between the actual an d fused images RSNR ( x , ˆ x ) = 10 log 10 k x k 2 k x − ˆ x k 2 2 . (34) The larger RSNR, the be tter the fus ion quality an d v ice versa. 18 A L G O R I T H M 3 : Adjusting Stepsize Update ˆ ρ t with N a,t : ˆ ρ t = N a,t N W % Burn-in ( t ≤ N MC ): if ˆ ρ t > α u then Set ε = β u ε else if ˆ ρ t < α d then Set ε = β d ε end if % After Burn in ( t > N MC ): if ˆ ρ t > α u then Set ε = [1 − (1 − β u ) exp ( − 0 . 01 × ( t − N bi ))] ε , else if ˆ ρ t < α d then Set ε = [1 − (1 − β d ) exp ( − 0 . 01 × ( t − N bi ))] ε , end if ( t = N bi + 1 , · · · , N MC ) b) SAM: The spectral ang le mapper (SAM) measures the spe ctral distortion betwee n the ac tual and estimated imag es. The SAM of two s pectral vectors x n and ˆ x n is defin ed as SAM ( x n , ˆ x n ) = arcc os h x n , ˆ x n i k x n k 2 k ˆ x n k 2 . (35) The average SAM is finally ob tained by averaging the SAMs of all image pixels. No te that SAM value is expressed in radians and thus belongs to [ − π 2 , π 2 ] . The smaller the ab solute v alue of SAM, the less important the spectral distortion. c) UIQI: The uni versal image quality ind ex (UIQI) was propos ed in [58] for ev aluating the s imi- larity between t wo single band images. It is related to the correlation, lumi nanc e d istortion and contrast distortion of the estimated image to the referen ce image. The UIQI betwee n a = [ a 1 , a 2 , · · · , a N ] and ˆ a = [ ˆ a 1 , ˆ a 2 , · · · , ˆ a N ] is d efined as UIQI ( a , ˆ a ) = 4 σ 2 a ˆ a µ a µ ˆ a ( σ 2 a + σ 2 ˆ a )( µ 2 a + µ 2 ˆ a ) (36) where µ a , µ ˆ a , σ 2 a , σ 2 ˆ a are the sample means and variances of a a nd ˆ a , and σ 2 a ˆ a is the sa mple covari ance of ( a, ˆ a ) . The range of UIQI is [ − 1 , 1] and UIQI = 1 whe n a = ˆ a . For multi-band image, the UIQI is obtained band-by -band an d averaged over all ba nds. 19 d) ERGAS: The relati ve dimensionless g lobal error in synthes is (ERGAS) calculates the amou nt of spe ctral d istortion in the image [59]. This mea sure of fusion quality is defined as ERGAS = 100 × 1 d 2 v u u t 1 m λ m λ X i =1 RMSE ( i ) µ i (37) where 1 /d 2 is the ratio between the pixel sizes o f the MS and HS images, µ i is the mean of the i th band of the HS image, and m λ is the numbe r of HS bands. The s maller ERGAS, the smaller the spectral distortion. e) DD: The degree of dis tortion (DD) between tw o image s X and ˆ X is d efined as DD ( X , ˆ X ) = 1 M k vec ( X ) − vec ( ˆ X ) k 1 . (38) The smaller DD , the be tter the fusion. D. Compar ison with other Ba yesian models The Bayesian model propo sed he re differs from previous Ba yesian mo dels [23 ], [24 ] in three -fold. First, in addition to the target image x , the hierarchical Bayes ian model allo ws the distributions of the no ise variances s 2 and the hyperparame ter Σ u to be inferred. The hierarchical inference s tructure makes this Bayesian model more g eneral and flexible. Sec ond, the covari ance matrix Σ u is assume d to be block dia gonal, which allo ws u s to exploit the co rrelations be tween spectral bands. Third, the propo sed method takes advantage of the relation betwee n the multispectral imag e and the tar get image by introducing a forward model F 2 . This parag raph compares the proposed Baye sian fus ion method with these two state-of-the-art fus ion algorithms [23] [24] for HS+MS fusion. The MMSE estimator of the imag e us ing the proposed Baye sian method is ob tained from (22). In this simulation, N MC = 500 a nd N bi = 500 . Th e fus ion results obtained w ith d if ferent algorithms are depicted in Fig. 2. Graphically , the propos ed algorithm performs competiti vely with the state-of-the-art methods. This result is confirmed qua ntitati vely in T ab le II which shows the RSNR, UIQI, SAM, ERGAS an d DD for the three metho ds. It can be seen that the HMC me thod provides slightly better res ults in terms of image restoration than the o ther methods. Howe ver , the proposed method allo ws the image covari ance matrix and the noise variances to be estimated. The sa mples ge nerated by the MCMC method c an also b e use d to compu te confiden ce interv als for the es timators (e.g., s ee error b ars in Fig. 4). E. Estimation o f the n oise variance s The proposed Ba yesian method allows n oise variances s 2 p,i ( i = 1 , · · · , n λ,p , p = 1 , · · · , P ) to be estimated from the samples g enerated by the Gibbs sampler . The MMSE estimators of s 2 1 , ( · ) and s 2 2 , ( · ) are illustrated in Fig. 4 . Graphica lly , the estimations c an track the variations o f the noise powers within tolerable d iscrepancy . 20 T ABLE II P E R F O R M A N C E O F D I FF E R E N T F U S I O N M E T H O D S I N T E R M S O F : R S N R ( D B ) , U I Q I , S A M ( D E G ) , E R G A S A N D D D ( × 10 − 2 ) ( A V I R I S D A TA S E T ) . Methods RSNR UIQI SAM ERGAS DD T ime MAP 23.33 0.9913 5.05 4.21 4.87 1 . 6 W av elet 25.53 0.9956 3.98 3.95 3.89 31 Proposed 26 . 74 0 . 9966 3 . 40 3 . 77 3 . 33 5 30 20 40 60 80 100 120 140 160 10 −4 10 −3 10 −2 HS bands Noise Variances Estimation Actual 1 2 3 4 5 6 7 10 −4 10 −3 10 −2 MS bands Noise Variances Estimation Actual Fig. 4. Noise v ariances and their MMSE esti mates. (T op) HS image. (Bott om) MS image. F . Robustness with respect to the knowledge of F 2 The samp ling algorithm summarized in Algo. (2) req uires the knowledge of the sp ectral respons e F 2 . Howev er , this knowledge can be partially known in some practical applications. As the sp ectral response is the s ame for each vector x i ( i = 1 , · · · , m x m y ) , F 2 can be cons tructed from the matrix f 2 of size n λ, 2 × m λ (i.e., 7 × 172 ) as follows F 2 = diag [ f 2 · · · f 2 | {z } m x m y ] . (39) This paragrap h is dev oted to testing the robustness of the p roposed algorithm to the imperfect knowledge of f 2 . In order to analyz e this robustness, a zero-mea n wh ite Gaussian error h as been added to a ny non-zero co mponent of f 2 as sh own in the b ottom of Fig. 1. Of co urse, the lev el of uncertainty regarding f 2 is controlled b y the variance o f the error de noted as σ 2 2 . The correspond ing FSNR is de fined to ad just the knowledge o f f 2 : FSNR = 10 log 10 k f 2 k 2 F m λ n λ, 2 s 2 2 . (40) 21 5 10 15 20 25 30 23 23.5 24 24.5 25 25.5 26 26.5 27 FSNR(dB) RSNR(dB) MAP Wavelet HMC Fig. 5. Reconstruction errors of the different fusion methods versus FSNR. The larger FSNR, the more knowledge we have abo ut f 2 . The RSNR s betwee n the referenc e and estimated imag es are displayed in Fig. 5 as a function of FSNR. Obviously , the performance of the proposed Bayesian fusion algorithm decrease s as the uncertainty a bout f 2 increases . Howe ver , as long as the FSNR is above 8 dB, the p erformance of the propose d method always ou tperforms the MAP and wavelet-based MAP methods. Th us, the p roposed method is q uite robust with resp ect to the imperfect knowledge of f 2 . G. T est on additional dataset This section considers another reference image (the high sp atial and h igh spectral imag e is a 128 × 64 × 93 HS image with very h igh spatial resolution of 1.3 m/pixel) ac quired by the Refle ctiv e Optics Sys tem Imaging S pectrometer (R OSIS) optical sensor over the urban area of the University of Pavia, Italy . The flight was operated by the De utsches Zen trum f ¨ ur Luft- und Raumfahrt (DLR, the German Aerospa ce Age ncy) in the framew ork of the HySens project, man aged a nd sponso red by the Europ ean Union. This image was initially c omposed of 115 ba nds that have bee n reduce d to 93 bands a fter removing the water v apor abs orption bands (with spectral range from 0.43 to 0.86 µ m). This imag e has re ceiv ed a lot o f attention in the remote sensing literature [60]–[62]. The HS blurring kernel is the s ame a s in p aragraph V -A and the MS spec tral respon se is a 4 -band IK ONOS-like reflectance spec tral res ponse. The noise level is defin ed b y SNR 1 , · = 35 dB for the first 43 ba nds and SNR 1 , · = 30 dB for the remaining 50 band s of the HS image. For MS image , SNR 2 , · is 30dB for a ll bands. The grou nd-truth, HS, MS and fusion res ults ob tained with different algorithms are d isplayed in Fig. 6. The correspond ing image qua lity measures are reported in T able III. T he estimates of the noise v ariances are shown in Fig. 7. Th ese results are in go od agreement with the p erformance obtained before. 22 Fig. 6. R OS IS dataset: (T op left) HS Image. (T op middle) MS Image. (T op right) MAP [23]. (Bottom left) W a velet MAP [24]. (Bottom middle) Hamiltonian MCMC. (Bottom right) Reference. T ABLE III P E R F O R M A N C E O F D I FF E R E N T F U S I O N M E T H O D S I N T E R M S O F : R S N R ( D B ) , U I Q I , S A M ( D E G ) , E R G A S A N D D D ( × 10 − 2 ) ( RO S I S D AT A S E T ) . Methods RSNR UIQI SAM ERGAS DD T ime(s) MAP [23] 26.58 0.9926 2.90 1.36 3.61 1 . 5 W av elet [24] 26.62 0.9925 2.87 1.35 3.60 30 Proposed 27 . 30 0 . 9933 2 . 60 1 . 24 3 . 27 410 H. Application to pansha rpening The p roposed a lgorithm c an a lso b e u sed for pan sharpening , which is a quite impo rtant a nd p opular application in the area of remote s ensing. In this s ection, we focus on fusing pa nchromatic a nd hyperspe ctral images (HS+P AN), wh ich is the extension of conv entional pansha rpening (MS+P AN). The HS image conside red in this section was us ed in paragrap h V -G whereas the P AN imag e was obtained by averaging all the high resolution HS bands. The SNR of the P AN image is 30 dB. Apart from [23], [24], we also compare the results with the metho d of [63], whic h propose s a popular pansha rpening method. The results are displayed in Fig. 8 and the quan titati ve results are reported in T able IV. The propose d Bayes ian me thod still provides interesting results. 23 10 20 30 40 50 60 70 80 90 10 −4 10 −3 10 −2 HS bands Noise Variances Estimation Actual 1 1.5 2 2.5 3 3.5 4 10 −4 10 −3 10 −2 MS bands Noise Variances Estimation Actual Fig. 7. Noise v ariances and their MMSE esti mates (ROSIS dataset). (T op) HS image. (B ottom) MS image. Fig. 8. R OSIS dataset: (T op left) Reference. (T op middle) MS Image. (T op right) Adapti ve IHS [63]. (Bottom left) MAP [23]. (Bottom middle) W avelet MAP [24]. (B ottom right) Hamiltonian MCMC. V I . C O N C L U S I O N S This p aper p roposed a hierarchical Baye sian mode l to fus e mu ltiple multi-band images with various spectral and spatial resolutions . The image to be rec overed was assumed to be degraded acco rding to physical transformations included within a forward model. An a ppropriate p rior distribution, that exploited geo metrical conce pts encou ntered in spec tral unmixing problems was propo sed. The resulting posterior distribution w as ef ficiently s ampled thanks to a Hamilt onian Monte Carlo a lgorithm. Simulations c onducted on pseud o-real data sh owed that the p roposed method competed with the s tate- of-the-art techniques to fuse MS and HS images . These experiments also illustrated the robustness of 24 T ABLE IV P E R F O R M A N C E O F D I FF E R E N T F U S I O N M E T H O D S I N T E R M S O F : R S N R ( D B ) , U I Q I , S A M ( D E G ) , E R G A S A N D D D ( × 10 − 2 ) ( RO S I S D AT A S E T ) . Methods RSNR UIQI SAM ERGAS DD T ime(s) AIHS [63] 16.69 0.9176 7.23 4.24 9 .99 7.7 MAP [23] 17.54 0.9177 6.55 3.78 8.78 1 . 4 W av elet [24] 18.03 0.9302 6.08 3.57 8.33 26 Proposed 18 . 23 0 . 9341 6 . 05 3 . 49 8 . 20 387 the prop osed me thod with respect to the miss pecifica tion o f the forward mod el. Future work includes the es timation of the parameters in volv ed in the forward model (e.g., the s patial and s pectral res ponse s of the sens ors) to obtain a fully uns upervised fusion algorithm. The incorporation of spectral mixing constraints for a possible improved sp ectral accuracy for the es timated high resolution image would also dese rve some attention. A C K N O W L E D G M E N T S The authors would like to thank Dr . Paul Sc heunde rs and Dr . Y if an Z hang for sh aring the codes of [24] and Jo rdi Inglada, from Centre National d’ ´ Etudes Spatiales (CNES), for p roviding the LANDSA T spectral respons es use d in the experiments. The au thors a lso acknowledge Prof. Jos ´ e M. Bioucas Dias for valuable discu ssions ab out this work that were h andled during his visit in T o ulouse within the CIMI Labex. R E F E R E N C E S [1] I. Amro, J. Mateos, M. V ega, R. Molina, and A. K. Katsaggelos, “ A surve y of classical methods and new trends in pansharpen ing of multispectral images, ” EUR ASIP J . Adv . Signal P r ocess. , vol. 2011, no. 1, pp. 1–22 , 2011. [2] W . Dou, Y . Chen, X. Li, and D. Z. S ui, “ A general framew ork for component substitution image fusion: An implementation using the fast image fusion method, ” Comput. & Geosci. , vol. 33, no. 2, pp. 219–2 28, 2007. [3] L. W ald, “Some terms of reference in data fusion, ” IEEE T rans. Geosci. and Remote Sens. , vol. 37, no. 3, pp. 1190 –1193, May 1999. [4] T .- M. Tu, P . S. Huang, C.-L. Hung, and C. -P . Chang, “ A fast intensity-hue-saturation fusion technique with spectral adjustment for IKONOS i magery , ” IEEE Geosci. and Remote Sensing L ett. , vol. 1, no. 4, pp. 309–31 2, 2004. [5] H. Aanaes, J. Sveinsson, A. Niel sen, T . Bovith, and J. Benediktsson, “Model-based satellite image fusion, ” IEEE T ra ns. Geosci. and Remote Sens. , vol. 46, no. 5, pp. 1336–1346, May 2008. [6] M. Joshi and A. Jalobeanu, “MAP estimation for multiresolution fusion in remotely sensed images using an IGMRF prior model, ” IEE E T rans. Geosci. and Remote Sens. , vol. 48, no. 3, pp. 1245–1255, March 2010 . [7] D. Liu and P . T . Boufounos, “Dictionary learning based pan-sharpening, ” in Pr oc. IEEE Int. Conf. Acoust., Speech, and Signal Proce ssing (ICASSP) , Kyoto, Japan, March 2012, pp. 2397– 2400. 25 [8] D. Manolakis and G. Shaw , “Detection algorithms for hyperspectral i maging applications, ” IEEE Signal Proce ss. Mag. , vol. 19, no. 1, pp. 29–43, jan 2002. [9] C.-I Chang, Hyperspectr al Im aging : T echniq ues for Spectral detection and classification . Ne w Y ork: Kluwer , 2003. [10] J. M. Bi oucas-Dias, A. Pl aza, N. Dobigeon, M. Parente, Q. Du, P . Gader , and J. Chanussot, “Hyperspectral unmixing ov erview: Geometrical, statistical, and sparse regression -based approaches, ” IEEE J . Sel. T opics Appl. Earth Observations and Remote Sens. , vol. 5, no. 2, pp. 354–379, 2012. [11] M. Cetin and N. Mus aoglu, “Merging hyp erspectral and panchromatic image data: qualitati ve and quantitativ e analysis, ” Int. J. Remote Sens. , vo l. 30, no. 7, pp. 1779– 1804, 2009. [12] G. A. Licciardi, M. M. Khan, J. Chanussot, A. Montan v ert, L. Condat, and C. Jutten, “Fusion of hyperspectral and panchromatic images using multiresolution analysis and nonlinear pca band reduction, ” EURASIP J. Adv . Signal Pr ocess. , vol. 2012, no. 1, pp. 1–17, 2012. [13] M. Moeller , T . W ittman, and A. L. Bertozzi, “ A va riational approach to hyperspectral image fusion, ” in Pr oc. SPIE Defense, Security , and Sensing . I nternational Society for Optics and Photonics, 2009, pp. 73 341E–73 341E. [14] C. Chisense, J. Engels, M. Hahn, and E. G ¨ ulch, “Pansharpening of hyperspectral images in urban areas, ” in Pro c. XXII Congr . of the Int. Society for Photo grammetry , R emote Sens. , Melbourne, Australia, 2012. [15] M. E . Winter and E. Winter , “Resolution enhancement of hyperspectral data, ” in Pro c. IEEE A er ospace Confer ence , 2002, pp. 3–1523. [16] G. Chen, S. -E. Qi an, J.-P . Ardouin, and W . Xie, “S uper-resolu tion of hyperspectral imagery using complex ridgelet transform, ” Int. J. W avelets, Multireso lution Inf. Pr ocess. , vol. 10, no. 03, 2012. [17] D. Inc., “W orldvie w-3, ” http:/ /www .satimagingcorp.com/satellite- senso rs/W orldV ie w3- DS - WV3- W eb .pdf, Jan. 2013. [18] N. Ohgi, A. Iwasaki, T . Kaw ashima, and H. Inada, “Japanese hyper -multi spectral mission, ” i n Proc. IEEE Int. Conf. Geosci. Remote Sens. (IGARSS) , Honolulu, Hawaii, USA, July 2010, pp. 3756–3759. [19] N. Y oko ya and A. Iwasaki, “Hyperspectral and multispectral data fusion mission on hyperspectral imager suite (HISUI), ” in Proc . IEEE Int. Conf. Geosci. Remote Sens. (IGAR SS) , Melbourne, Australia, July 2013, pp. 4086–40 89. [20] V . Shettigara, “ A generalized component substitution technique for spatial enhancement of multispectral images using a higher resolution data set, ” P hotog ramm. Eng. Remote Sens. , vol. 58, no. 5, pp. 561–567, 1992. [21] J. Zhou, D. Civco, and J. Silander , “ A wav elet transform method to merge Landsat TM and SPOT panchromatic data, ” Int. J. Remote Sens. , vo l. 19, no. 4, pp. 743–7 57, 1998 . [22] M. Gonz ´ alez-Aud ´ ıcana, J. L. S aleta, R. G. Catal ´ an, and R. Garc´ ıa, “Fusion of multi spectral and panchromatic images using improved IHS and PCA mergers based on wa velet decomposition, ” IEE E T ran s. Geosci. and Remote Sens. , vol. 42, no. 6, pp. 1291–12 99, 2004. [23] R. C. Hardie, M. T . Eismann, and G. L. Wilson, “MAP estimation for hyperspectral image resolution enhanc ement using an auxiliary sensor , ” IEE E T rans. Image Pr ocess. , vol. 13, no. 9, pp. 1174–1184, Sept. 2004. [24] Y . Zhang, S. De Backer , and P . Scheunders, “Noise-resistant wav elet-based Bayesian fusion of multispectral and hyperspectral images, ” IEEE Tr ans. G eosci. and Remote Sens. , vol. 47, no. 11, pp. 3834 –3843, Nov . 2009. [25] Y . Zhang, A. Duijster , and P . Scheunders, “ A Bayesian restoration approach for hyperspectral images, ” IEEE Tr ans. Geosci. and Remote Sens. , vol. 50, no. 9, pp. 3453 –3462, Sep. 2012. [26] M. T . Eismann and R. C. Hardie, “ Application of the stocha stic mixing model to hypersp ectral resolution enhancement, ” IEEE T ran s. Geosci. and Remote Sens. , vol. 42, no. 9, pp. 1924–1933, S ept. 2004. [27] ——, “Hyperspectral resolution enhancemen t using high-resolution multispectral imagery with arbitrary response functions, ” IEEE T rans. I mag e Pro cess. , vol. 43, no. 3, pp. 455–465, March 2005. [28] X. Otazu, M. Gonzalez-Audicana, O. Fors, and J. Nunez, “Introduction of sensor spectral response into image fusion methods. Application to wa velet-based methods, ” IEEE T rans. Geosci. and Remote Sens. , vol. 43, no. 10, pp. 2376– 2385, 2005. 26 [29] M. V . Joshi, L. Bruzzone, and S. Chaudhuri, “ A model-based approach to multiresolution fusion in remotely sensed images, ” IEE E T r ans. Geosci. and Remote Sens. , vol. 44, no. 9, pp. 2549–2562, Sept. 2006. [30] G. Casella and E. I. George, “Explaining the Gibbs sampler, ” The American Statistician , vol. 46, no. 3, pp. 167–174, 1992. [31] W . K. Hastings, “Monte Carlo sampling methods using Marko v chains and their applications, ” B iometrika , v ol. 57, no. 1, pp. 97–109, 1970. [32] S. Duane, A. D. K ennedy , B . J. Pendleton, and D. Roweth, “Hybrid Monte Carlo, ” Physics L ett. B , vol. 195, no. 2, pp. 216–222, Sept. 1987. [33] R. M. Neal, “Probabilistic inference using Marko v chain Monte Carlo methods, ” Dept. of Computer Science, Univ ersity of T oronto, T ech. Rep. CRG -TR-93-1, Sept. 1993. [34] ——, “MCMC using Hamiltonian dynamics, ” Handbook of Marko v Chain Monte Carlo , vol. 54, pp. 113–162, 2010. [35] D. Fasbende r , D. T uia, P . Bogaert, and M. Kanevski, “Support-bas ed implementation of Bayesian data fusion for spatial enhancement: Applications to AS TER thermal images, ” IEEE Geosci. and Remote Sensing Lett. , vol. 5, no. 4, pp. 598–602, Oct. 2008. [36] M. Elbakary and M. Alam, “Superresolution construction of multispectral imagery based on local enhancement, ” IEE E Geosci. and Remote Sensing L ett. , vol. 5, no. 2, pp. 276–27 9, April 2008. [37] J. B. C ampbell, Intr oduction to r emote sensing , 3rd ed. Ne w-Y ork, NY : T aylor & Francis, 2002. [38] A. Jalobeanu, L . Blanc-Feraud, and J. Zerubia, “ An adaptiv e Gaussian model for satellite image deblurring, ” IE EE T ra ns. Imag e Pr ocess. , vol. 13, no. 4, pp. 613–621, 2004. [39] A. Duijster, P . Scheunders, and S. De Backer , “W avelet-based em al gorithm for multispectral-image restoration, ” I EEE T ra ns. Geosci. and Remote Sens. , vol. 47, no. 11, pp. 3892–3898, 2009. [40] M. Xu, H. Chen, and P . K. V arshne y , “ An image fusion approach based on Mark ov rando m fields, ” IEEE Tr ans. Geosci. and Remote Sens. , vol. 49, no. 12, pp. 5116–5127 , 2011. [41] N. Dobigeon, J. -Y . T ourneret, and A. O. Hero III, “Bayesian l inear unmixing of hyperspectral images corrupted by colored Gaussian noise with unkno wn cov ari ance matrix, ” in Pr oc. IEEE Int. Conf. Acoust., Speech, and Signal Pr ocessing (ICASSP) , Las V egas, USA , March 2008, pp. 3433–34 36. [42] R. Schultz and R. Stev enson, “ A Bayesian approach to image expansion for improv ed definition, ” IEEE T rans. Imag e Pr ocess. , vol. 3, no. 3, pp. 233–2 42, May 1994. [43] C.-I. Chang, X.-L. Zhao, M. L . Althouse, and J. J. Pan, “Least squares subspace projection approach to mixed pixel classification for hyperspectral images, ” IEEE Tr ans. Geosci. and Remote Sens. , vol. 36, no. 3, pp. 898–912 , 1998. [44] J. M. Bioucas-Dias and J. M. Nascimento, “Hyperspe ctral subspace identification, ” IEEE T ran s. Geosci. and Remote Sens. , vol. 46, no. 8, pp. 2435–2 445, 2008. [45] R. C. Hardie, K. J. Barnard, and E. E. Armstrong, “Joint MAP registration and high-resolution image estimation using a sequence of undersampled images, ” IEEE T ra ns. Imag e Process. , vol. 6, no. 12, pp. 1621–1633 , Dec. 1997. [46] N. A. W oods, N. P . Galatsanos, and A. K. Katsaggelos, “S tochastic methods for joint registration, restoration, and interpolation of multiple undersampled images, ” IEEE T ra ns. Imag e Pr ocess. , vol. 15, no. 1, pp. 201–213 , Jan. 2006. [47] Q. W ei, N. Dobigeon, and J.-Y . T ourneret, “Bayesian fusion of multi-band images, ” IRIT -E NSEEIHT , T ech. Report, Univ . of T oulouse , 2014. [Onli ne]. A v ailable: http://wei. perso.enseeiht.fr/papers/201 4QiT echnicalReport.pdf [48] E. P unskaya, C. Andrieu, A. Doucet, and W . Fit zgerald, “Bayesian curve fitti ng using MCMC with applications t o signal segmentation, ” IEEE T r ans. Signal Pr ocess. , vol. 50, no. 3, pp. 747–7 58, March 2002. [49] A. Gelman, “Prior distri butions for va riance parameters in hierarchical models (comment on article by bro wne and draper), ” Bayesian analysis , vol. 1, no. 3, pp. 515–534, 2006. [50] C. P . Robert, The Bayesian Choice: from Decision-Theor etic Motivations to Computational Implementation , 2nd ed., ser . Springer T exts in Statistics. New Y ork, NY , USA: Springer -V erlag, 2007. 27 [51] S. Bidon, O. Besson, and J.-Y . T ourneret, “The adapti ve coherence estimator is the generalized likelihood ratio test for a class of heterogeneous en vironments, ” IEEE Signal Pr ocess. Lett. , vol. 15, pp. 281–2 84, 2008. [52] M. Bouriga and O. F ´ eron, “Estimation of cov ari ance matrices based on hierarchical inv erse-Wishart priors, ” J. of Stat. Planning and Infere nce , 2012. [53] H. Zhang, Y . Zhang, H. Li, and T . S. H uang, “Generativ e Bayesian i mage super resolution with natural image prior, ” IEEE T ran s. Image Pr ocess. , vol. 21, no. 9, pp. 4054 –4067, 2012. [54] F . Orieux, O. F ´ eron, and J.-F . Giov annelli, “Sampling high-dimensional Gaussian distributions for gene ral l inear in verse problems, ” IEEE Signal Process. Lett. , vol. 19, no. 5, pp. 251–25 4, 2012. [55] D. Ceperley , Y . Chen, R. V . Craiu, X.-L. Meng, A. Mira, and J. Rosenthal, “Challenges and adv ances in high dimensional and high complex ity monte carlo computation and theory , ” in Banff International Resear ch Station , 2012. [56] R. O. Green, M. L. Eastwood, C. M. Sarture, T . G. Chrien, M. Aronsson, B. J. Chippend ale, J. A. Faust, B. E. Pavri, C. J. Chovit, M. Solis et al. , “Imaging spectroscopy and the airborne visible/infrared imaging spectrometer (A VIRIS), ” Remote Sens. of En vir onment , vol. 65, no. 3, pp. 227–248, 1998. [57] G. O. Roberts and J. S. Rosenthal, “Coupling and ergodicity of adaptiv e Markov Chain Monte Carlo algorithms, ” J . of Appl. Pr obability , vol. 44, no. 2, pp. pp. 458–475, 2007. [Online]. A v ailable: http://w ww .jstor .org/stable/2759 5854 [58] Z. W ang and A. C. Bovik, “ A uni versal image quality index , ” IEE E Signal Pr ocess. Lett . , vol. 9, no. 3, pp. 81–84, 2002. [59] L. W ald, “Quality of high resolution synthesised images: Is there a simple criterion?” in Proc. Int. Conf. Fusion of Earth Data , Nice, France, Jan 2000, pp. 99–103. [60] A. Plaza, J. A. Benediktsson, J. W . Boardman, J. B razile, L. Bruzzone, G. Camps-V alls, J. Chanussot, M. Fauv el, P . Gamba, A. Gualti eri, M. Marconcini, J. C. T ilton, and G. T rianni, “Recent advance s in techniques for hyperspectral image processing, ” Remote Sensing of E n vir onmen t , vo l. 113, Supplement 1, pp. S110–S122 , 2009. [61] Y . T arabalka, M. Fauve l, J. Chanussot, and J. Benediktsson, “SVM- and MRF -based method for accurate classification of hyperspectral images, ” IEEE T rans. Geosci. and Remote Sens. , vol. 7, no. 4, pp. 736–740, 2010. [62] J. Li , J. M. Bioucas-Dias, and A. Plaza, “Spectral-spatial classification of hyperspectral data using loopy belief propagation and activ e learning, ” IEEE Tr ans. G eosci. and Remote Sens. , vol. 51, no. 2, pp. 844–856, 2013. [63] S. Rahmani, M. Strait, D. Merkurje v , M. Moeller , and T . Wittman, “ An adaptiv e IHS pan-sharpening method, ” IE EE Geosci. and Remote Sensing L ett. , vol. 7, no. 4, pp. 746–75 0, 2010.
Original Paper
Loading high-quality paper...
Comments & Academic Discussion
Loading comments...
Leave a Comment