Identifying roles of clinical pharmacy with survey evaluation
The survey data sets are important sources of data and their successful exploitation is of key importance for informed policy-decision making. We present how a survey analysis approach initially developed for customer satisfaction research in marketi…
Authors: Andreja v{C}ufar, Alev{s} Mrhar, Marko Robnik-v{S}ikonja
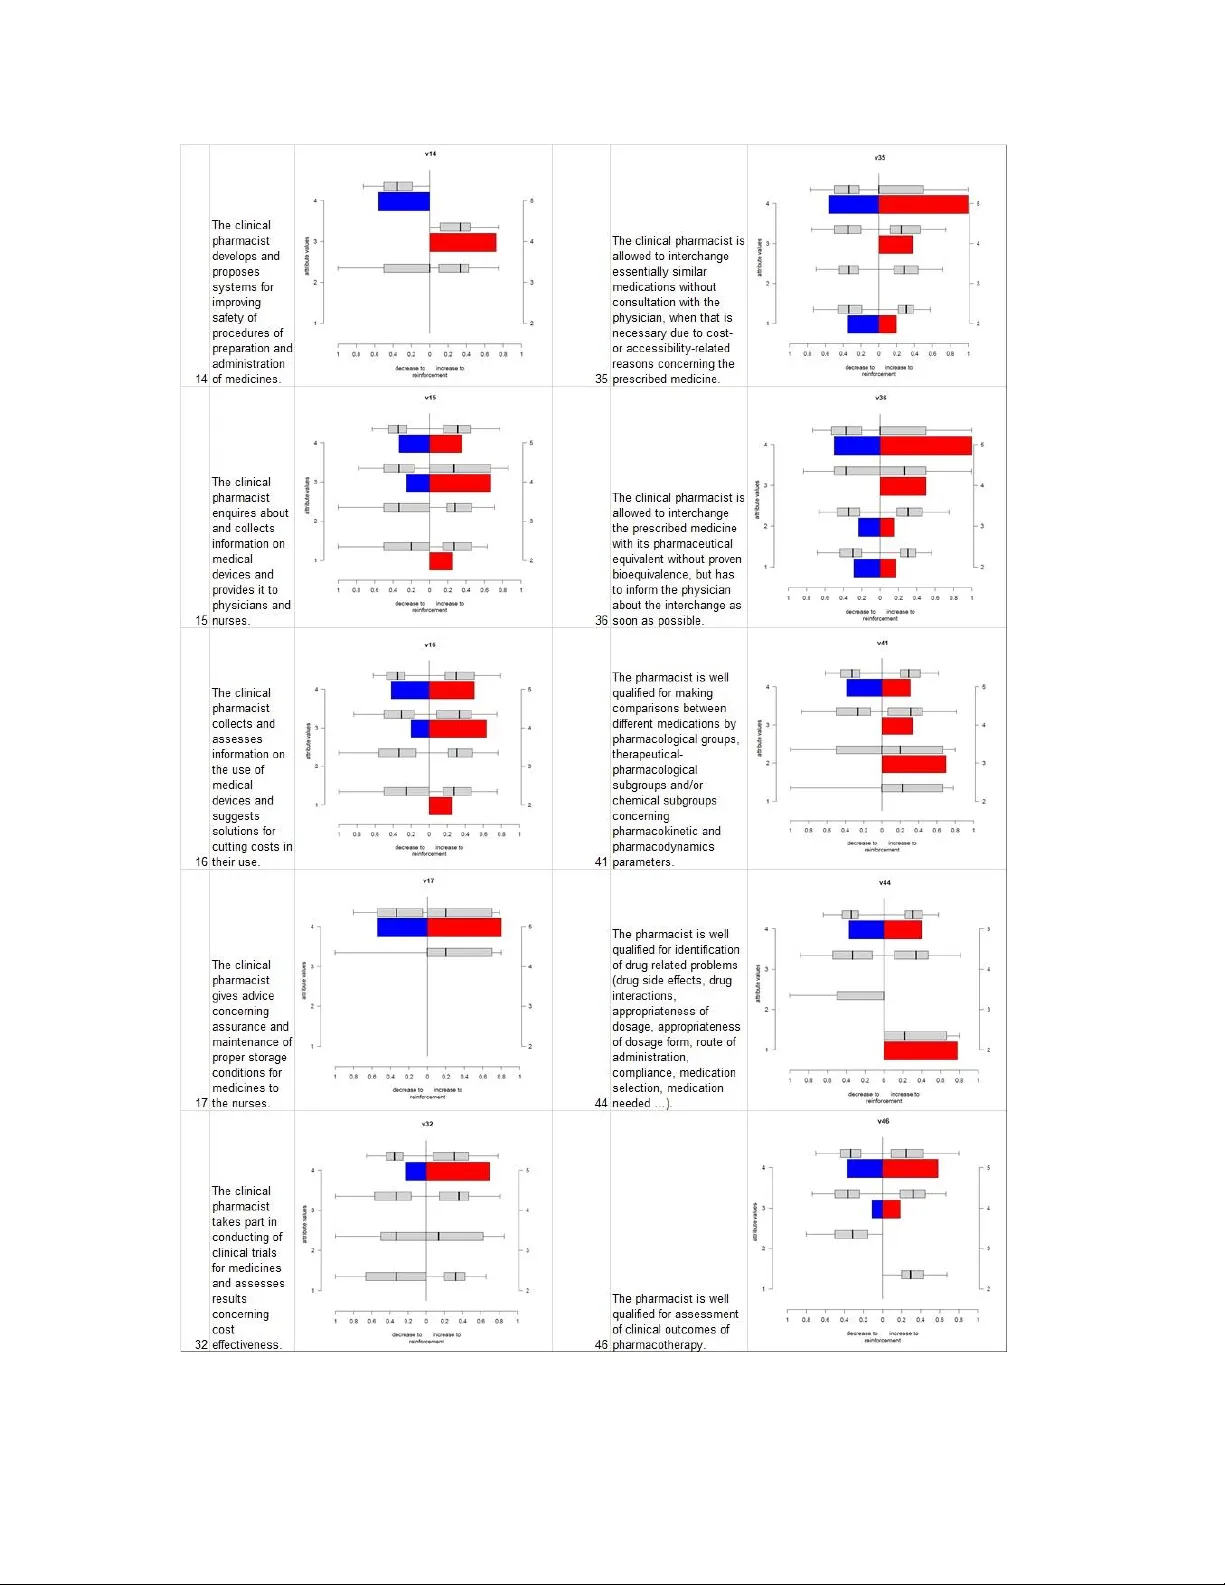
Technical report, University of Ljubljana, Faculty of Computer and information Science, 2014 1 Identifying roles of clinical pharmacy w ith survey evaluation Andreja Čufar, Un iversity Medica l Centre Ljubl jana, Pharmacy , Z aloška 7, 1000 L jubljana Aleš Mrhar, Univ ersity of L jubljana, Faculty of Pha rm acy , Aškerčeva 7, 1000 Ljubljan a Marko Robnik- Šikonja, University of Ljubljana, Facult y of Com puter and Inform ation Science, Tržaška 25, 1000 L jubljana (corre sponding auth or: marko.robnik@ fri.uni-lj.si ) Abstract The survey data sets are i mportant sources of data and their successful exploitation is of key importance for informed policy-decision making. We present how a survey analysis approach initially developed for customer satisfaction research in mark eting can be adapted for the introduction of clinical pharmacy services i nto hospital. We use t wo analytical approaches to extract relevant m anagerial consequenc es. With OrdEval alg orithm we first evaluate the importance of competen ces for th e users of clinic al pha rmacy and extract their nat ure according to the users’ expectations. Next, we build a model for predicting a successful introduction of clinica l pharmacy to the c linical depar tments. We the wards w ith the highest p robability of succ essful cooperation w ith a clinical pharm acist. We ob tain usef ul m anagerially re levant inform ation from a relatively small sample of hi ghly rel evant respondents. We show how t he OrdEval algorithm exploits the information hidden in the or dering of class and attribute values and their inherent correlation. I ts output can be effectiv ely visualized an d com plemented with con fidence interval s . Keyword: data m ining, surv ey analysis, classifica tion, clinical pharmacy, H R managem ent 1 Introduction In spite of a plethora of new information sou rces availa ble, surveys are still the m ost important and frequently used tool for manag ers and dec ision makers when inv estigating alternativ e outcomes and poss ible s trategies before mak ing important decisions. Any progress made in this standard tool which allows better i nsight into the information gathered is therefore an important contributio n, not only to the field o f data analy tics, but also to th e applicative f ields using the surveys. Clinical pharm acy is a relat ively new di scipline in th e pharmacy profession wh ich is patient rathe r than drug oriented and aims to improve the quality of drug therapy. The Clinical pharmacist’s activity is therefo re patien t cantered, cooperative, and inter -profess ional as they have t o collaborate with physicians and nurses in the health care t eam (Hepler, 2004 ; Miller, 1981). The add ed value of c linical pharm acy can be proven based on numerous publications (Bond & Raehl, 2008 ; Borenstein et al., 2003 ; Phillips & Lipman, 1981). Despite m any positi ve exam ples of cooperation between physicians and pharmacists, there ar e still some obstacles (De Rijdt, Willem s, & Si moens, 2008) hindering t he systemic regulation of clinical pharmacy services, which would promote this cooperation m ore widely. The phy si cians’ fea r of losing independence and p rofessional autonom y is one of the barriers and reasons for the negative attitude towards clinical pharm acists as inspectors Technical report, University of Ljubljana, Faculty of Computer and information Science, 2014 2 of their work (Alkhateeb et al., 2009). Physicians who hav e already had an opportunity to cooperate with a c linical pharmacist are more open to this cooperation than t hose who lack such k ind of an experience (Chevalier & Nev ille, 2011 ; Rauch, 1982 ; Zillich et al., 2004 ). Physicians’ and nurses’ acceptance of the clin ical pharmacist depend s on how well thei r act ivities meet their needs and expectations. Physicians’ perceptions of the impor tance o f clinical pharm acy activities differ substantially from phar macists’ perceptions (Sulick & Pathak , 1996). T herefo re it i s n ecessary to recognize t he m ost im portant c linical p harmacy activiti es from the p erspective of i ts use rs, nam ely physicians’ and n urses’. According to t he behavioral decision theory and total quality management approach of Kano (Berger et al., 1993 ; K ano et al. 1984 ), the analysis of custom er needs is a three ph ase process: (1 ) understanding customer preference s, (2) requirement prioritization, and (3) requirement classification. The Kano model is widely used in several industrie s as an effect ive tool to understanding customer preferences . Kano propose d a two dimensional system for quality manag ement, where he identified three levels of custom er expectations. Satisfy ing basic expectation s keeps customer satisfied, while not meeting hi s expectations mak es him dissatisfied. He denoted this kind of expectations as dissatisfies or basic or must be. The second type of expectations mak e customer satisfied/dissatisfied depending on the quality/quantity of performance, that’s why he called them perform ance expectations. T he third level of customer’s expectations is hidden, not self-confident expectations. Satisfying those m akes customer delighted. These are delig hters or excitem ent expectations . We present how a survey analysis approach initially developed for custom er satisfaction research in marketing can be adapte d to a com pletely different problem, nam el y the introduct ion of clinica l pharmacy services into hospital. The approach is b ased on the evaluation of o rdinal attributes i.e. survey questions and their r elation to the exp ected outcom e. By taking the ordinal nature of many surveys’ questions into account the approach allows a sort of what -if analysis where probabilities of the expected outcom e are computed cond i tioned on changes in outcom e of s urvey questions. An example of the outpu t would be a probabi lity of mor e successf ul serv ice introd uction i f c ertain feature of the service is better communicated to the users. As the human resources are li mited, such knowledge is valuab le for the management who wan ts t o allocate the resources efficiently. T he proposed appro ach also allows a ca tegorization of attributes ac cording to the Kano m odel. The OrdEval alg orithm (Robnik- Šikonja, Brijs, & Vanhoof, 2009 ; Robnik- Ši konja & Vanhoo f, 2007) is an ana lytical tool for evaluation of the importance and impact of various factors in the given survey. I n the analysis of cust omer satisfaction data for a particular product/service, OrdEval can determine the im portance of each product' s feature t o the overall cu stomer' s sa tisfaction, and also indicate the thresho lds where satisfaction wi th individual featu re starts having strong positive or negative impact on the overall satisfac tion. The outputs of OrdEval are probabilisti c factors indicating the probability that an inc rease/decrease in t he individual feature or t he feature's value will have i mpact on t he dependent variable. T he intuition behind this approach is to approximate the inner workings of the decision p rocess taki ng place in each individual respondent, which form s a r elationship between the features and the response. If such i ntrospect ion would be possible, one could observe a causal effect the change of a feature's value has on t he response value. By Technical report, University of Ljubljana, Faculty of Computer and information Science, 2014 3 measuring such an effe ct we could reason about t he im por tance of th e feature's values a nd the type of the attr ibute. Also, we could determ ine which valu es are th resholds for a change of behavior. OrdEval algorithm uses the data sample and approxim at es this reasoning . For each respondent i t selects respondents most similar to it, and does inference based on them. For example, to evaluate the effect an increase in c ertain feature value would hav e on overall satisfaction, the alg orithm computes the probability for such an effect from the similar responden ts wit h in creased v alue of that feature. T o get statistically valid and practically i nteres ting results, t he overall process is repeated for a larg e enough number of respondents, and weighted with a large enough number of similar responden ts. The motivation and cont ribution of this pape r is to demonstrate how O rdEval works i n a medical manag ement context, how its output can be visualized and adapted t o include information relevant for decision mark ers, and the n ew insights i nto clinical pharmacy services, which is used as ou r application topic . With this research we aim to demonstrate t he use of survey analysis method OrdEv al in a nov el context of clinic al pharmacy, where featu re evaluation and detec ted v al ue thresholds identify t he key activities needed to satisfy the expectations of physicians and nurses. This inform at ion coupled with the prediction model for introduction of clinical pharmacy services in the hospital i s a practically use ful aid for decision m aking. The p aper is d ivided into f ive secti ons. In Section 2 we present clinical pharmacy and the a ctivities it encompasses, followed by the survey we desi gned to measure the expectations of doctors, nurses, and pharmacists. In Section 3 we describe OrdEval approach to evaluation of attributes and the way the attribute s can be interpreted. In Section 4 we present the results o f the analysis with the emphasis on the methodological aspects of OrdEval. In Section 5 we conclude with the overview of the contributions and p lans for furthe r work. 2 Collecting clinical phar macy data University Medical Centre ( UMC) Ljubljana is the largest health care in stitution and univ ersity hospital in S lovenia. It has nearly 2200 beds and annually over 100,000 hospi talizations, more than 750,000 ambulatory visits and over 25 0,000 functional di agnostics visits. On Decem ber 31 2013 there were employ ed nearly 1200 phy sicians and 3.750 nurses. T he hospital has a central pharmacy with 45 pharm acists (De cem ber 31, 201 3) . The average cost of m edications is a pproxim ately 350€ per patient. As one of th e main st rategic goals of the hospital pharm acy departm ent , a stepwise introduction of clinical pharmacy se rvice in th e hosp ital began in 2010 with a strong support of the top m anagement. There are 64 clinics, clinical departments, centers a nd inst itutes opera ting w ithin the hosp ital. 49 of them are using medical prepar ations whil e pe rform ing their prac tice. 6 out of 49 departments have negligible drug consumption, so clinical pharmacy service would be useless there. In the other 43 departments there is a consider able amount of medications used; therefore we can expect clinica l pharmacy service being v aluable. Clinical pharm acy service is a set of activi ties including , but not limited to, providing and validation of al l k inds of information regarding medicines, cooperation in planning and performing of pharmacotherapy , medication reconciliati on, verification of prescrib ing, preparation and Technical report, University of Ljubljana, Faculty of Computer and information Science, 2014 4 administration of m edicines , outcom es assessment, procurem ent of quality m edicines and safe and cost effective m edi cines uti lization assuran ce. A comprehensiv e li terature search wa s pe rform ed to prepare a list of all possible cl inical pharm acy activities. The list wa s furt her used to construct a surv ey questionna ire with Likert m easurement scale t o conduct a descr iptive observational a ttitude study of physicians’ a nd nurses’ opinion about the importance of each of the li sted activities and com petencies of clinical pharmacists. T he participants had to choose the level of agreem ent with each of the l isted affirmative statements i n the questionnai re. We decided to perform the study on t he basis of directed sampling only among manag ement staff members because we were interested in getting the middle m anagement’s opinion which we expected to have a higher managerial i mpact than a wider population sampling among other staff members with less decision m aking i nfluence. Conseque ntly the questionnaire was sent only to medical d irectors and he ads of depa rtments – and to t heir head nurses. They we r e allowed to share the questionnaire to their colleagues – lover level l eading staff, upon their judgm ent. The questionnaire was composed of three types of questions. In the f irst part of the questionnaire (17 questions) clinical pharm ac y activities pertaining to the hospital system were stated, while the second part of the questionnaire ( 19 questions) contained activities directly connected to an individual patient care. The t hird part (16 questions) of t he question naire dealt with clinical pharmacist’s competencie s. The par ticipants had t o choose the l evel of agreement on the Likert scale f rom 1(I totally di sagree ) to 5 (I totally agree) with each of the listed affirmative statements in the p arts one and two of t he questionn aire wh ile indi cating the importance (f orm least i mportant – 1 t o very importa nt 5) of a particula r com petence in the third pa rt. The questionnaire wa s firs t tested on a group of pharmacists to check the scope of selected clinic al pharmacy activit ies. In the second step it was validated by a g roup of experts: a physician, a non -hospital pharmacist and an independent hum an resource m anager. The questionnaire was se nt to 43 physicians – medical directors or heads of depar tments – and to their head nurses. Beside them, the questionnaire was also sent by e -mail to all pharmacists employed in the hospital pharmacy at the time of performing the survey (27). T he pharmacists were instructed to answer the questionnaire only in case they were interested in partici pating in the performing of clinical ph arm acy services. The participants could choo se to fill the questionnaire electronically or to print it out and fill it in manually. 4 3 physicians from 27 cl inics/clinica l departments and 42 nu rses f rom 26 clinics/clin ical dep artments filled in the questionnaire. Som e of t he chief physicians and chief nurses di stributed the questionari es’ a lso to head s of sub- departments, while on som e ot her departments, physicians or nurses did not participate. T otal number of participating physicians and nurses from cli nics – divi sions of Univ ersity Medical Centre Ljubljana is presen ted in table 1. Technical report, University of Ljubljana, Faculty of Computer and information Science, 2014 5 Table 1: Total number of participating physicians and nurses from cli nics – divisions of University Medical Centre Ljubljana Out of tota l 27 pharm ac ists, 13 expressed t heir wish to w ork as clinica l pharmacists and filled in the questionnaire. The response of clinical pharmacists was therefore considered as 100%. 82 responses from physicians and nurses as users of clinical pharmacy service were analyzed in comparison to 13 responses of ph armacists as prov i ders of the service. T he survey results were collected in a tabular form, together with the demog raphic data of each respondent: profession (physician, nurse or pharmacist), name of t he cl inic/clinical department, age and gender, and t he level of agre ement (from 1 to 5) with each statement about c linical pharm ac y services. I n the second stage o f our research we established a collaborat ion of clinical pha r macists on som e wards providing a selected range of clinical pharmacy activities . We se lected activities most favored by physicians and nurses and for which pharmacists felt they h av e competences to provide them. We used a spreadsheet to keep records about the type of clinical pharmacy activities performed and time spent for e ach of them. For the w ards cooperating with a c linical pharmacist an estimated satisfaction score and an es timated influence of particular activity on the total satisfaction with the coope ration was assigned by the head of the p harmacy . The collected data wa s than divided into two groups, the fi rst g roup of data being collected from participants already cooper ating with clinical pharmacist t o serve as a training data set, and th e other collected from par ticipants lacking this coop eration form i ng a prediction data set. 3 Analytical approach Machine l earning and data mining have been used exte nsively in medicine and pharmacology. In a recent review (Es fandiary et a l., 2014) medical data mining is divided t o six medical task s (screening, diagnosis, treatm ent, prognosis, m onitoring and manag ement) and f or each task five data mining approaches are studied (classification, regression, clustering, associati on and hybrid). Our work could be classified as manag ement task, but the methodology presented is aimed towards decision support, which is also frequently used in pharmacology, e.g. (Rommers, 2013). Our approach is based on evaluation of ordinal features, though we use also classificat ion. T his is Technical report, University of Ljubljana, Faculty of Computer and information Science, 2014 6 different to classical and modern approaches t o evaluation of services and also different to classica l analysis of survey s in medical d ecision suppor t, e.g. (Scheepers-Hoek s, 2013). We use two analytical approaches to extract relevant managerial consequences. With OrdEval algorithm we first evaluate the i mportance of competences for the users of clinical pharm acy and extract their ty pe according to the users’ e xpectation s. Next, we build a model f or predic ting a successful introdu ction of clinica l pharmacy to the clinical dep artments. 3.1 Evaluation of o rdinal featu res Based on the Kano model o f custom er satisfaction we aim to classify clinical pharmacy activities into three categ ories of attribu tes, namely basic or t hreshold, performance, and excitem ent activities. Not m eeting the expectations of basic act ivities would cause dissatisfaction with the new clinical pha rmacy service. The influence of performance activit ies on the total value of clinical pharmacy i s approximately linear, wh ile excitement activities have a po sitive impact on the satisfaction with c linical p harm acy serv ices when provi ded, but do not af fect the satisfaction valu e when not p rovided and ca n th erefore be an opportunity to in crease the ov erall satisfaction (Deng et al., 2008) . Figure 1 presents at tributes’ charact eristics acco rding to the K ano model. Feature (attribute) evaluation i s an important component of many machine learning tasks, e.g. feature subset se lection, constructive induction, decision and regression tree learning. Scores assigned to attributes durin g ev aluation also p rovide important inform ation to t he dom ain expert trying to get an insight into the problem do main. We are interested in a subclass of feature evaluation, namely the evaluation of conditional ly strongly dependent ordinal attributes whe re each of the indiv idual attribut e’s v alues may depend on other att ributes in a d i fferent wa y. The prob lem of feature (attribute) evaluation has received a lot of attention in literatu re. There are several measures for the ev aluation of a ttributes’ quality . For classific ation problem s t he m ost popular are e.g. Gini index (Breiman et al., 1984), gain ratio (Quinlan, 1993), MDL (Kononenk o, 1995), and ReliefF (Robnik- Šikonja & Kononenko, 2003 ). The first three are impurity based and measure quality of attribute accordin g to the purity of c lass v alue dis tribution a fter the split on the values of that attribute. They evaluate each attribute separately , are not aware of the ordering of the attribute’ s values and cann ot prov ide u seful information f or ea ch individual value of the a ttribute. ReliefF, on the other hand, is co ntext sensitive (by measuring how t he attribute separates similar instances) and could be adapted to handle ordered attr ibutes (by changing the definition of its sim ila rity measure), but cannot provide information for each value separately and does not differentiate between the positive and neg ative changes of the attribute and t heir im pact on the class v alue. Technical report, University of Ljubljana, Faculty of Computer and information Science, 2014 7 Figure 1: The Kano model for clinical pharm acy activities The goal of featu re analysis in our research is m anifold: 1. identify features which present the most important com petences and influence the overall (dis)satisfaction most, 2. identify types of features; b as ed on t otal qua lity m ana gement (Berger et a l., 1993 ; Kano et al., 1984) we differen tiate between three types o f importan t features: a) Basic f eatures are taken for granted by user s. H igh score in these features does not significantly increase the overall satisfaction, while a low score usually causes dissatisfaction; an example of such feature would be ability to provide information about accessibili ty of m edications, which is taken for granted and will no t increase satisfaction but will alm ost certainly cause d issatisfaction if not p rovided by clinical pharm acists. b) Performance fea tures are im portant features not taken for granted; they usually have a positive corre lation with overall sat isfaction: the higher the sc ore, the bigger the effect on the overall satisfaction. An example would be personal involvem ent Technical report, University of Ljubljana, Faculty of Computer and information Science, 2014 8 and effort of the personnel which will correlate positiv ely with satisfaction of the users. c) Excitement features usually describes properti es of product/service which are normally not very i mportant to t he users, but ca n cause excitement (and boos t in satisfaction) if the scor e is very high. An example would be par ticipating in clinical studies which will be an important fe ature for som e physicians and nurses. 3. Identify t hose attribute values (thresholds) which have a positiv e/negative i mpact on overall satisfact ion. There are many different f eature evaluation algorithm s in data mining which can evaluate, rank and/or select the most informative f eatures (goal 1). Other goals (2 and 3) are tackled by t he OrdEval algorithm but remain mostly untouched by other work in machine learning and data mining. The OrdEval algorithm can be used for analysis of any data where the dependent variable has ordered values, meaning t hat it is also suitable for surveys where answ ers are given in the graded manner. The methodology uses condit ional probabilities called ’reinforcem ent f actors’ as they approximate the upward and downward reinforcement effect th e particular feature value has on the dependent attribute. For each value of the feature we obtain estimates of two conditional probabilities: the probab ility that the response value increases given the increas e of the feature value (upward reinforcement), and the probabili ty that the response value decreases given the decrease of the featu re value (downward re inforcem ent). To take the context of oth er features in to account, these probabil ities ar e com puted in the local context, from the most sim ilar i nstances. The visualization of these factors with box-plots gives clear clues about the role o f each feature, the importance of each value and the threshold valu es. To unde rstand the idea of the OrdEval algorithm, the feature should not be treated as a whole. Rather than that, w e shall observe the effect a single value o f the feature m a y have. We also compute confidence interv als for each reinforcem ent factor. Since we cannot assume any parametric distribution and have to t ake the context of a similar res ponden t int o account we construct bootstrap est imates and form confiden ce intervals based on them (Efr on & Tibshirani , 1993). We plot obtain ed random reinforcement fact ors based on boots trap sampling with a box - and-whisk ers plot: the box is constructed from the 1st and 3rd quartile, middle line is median, while the whiskers are 100α/2 and 100(1 - α) /2 percentiles ( e.g. 2.5 and 97.5 percentiles) giving the borders of confidence interval (e.g., 95% confidence interval). The box -and-whiskers sho wing confidence intervals are put abov e the box -plots showing rei nforcem ent factors (Robnik- Ši konja et al., 2009). We used the O rdEval algorithm for evaluating the importance of a particular clinical pharm acy activity and its in fluence on the overal l satis faction with clinical pharmacy services. The Algorithm deals independently w ith each value giving us in sight into a par ticular activity v alue, i ts po sitive or negative influence, the strength of t he influence, and the information whether t he influence is significant or no t. Technical report, University of Ljubljana, Faculty of Computer and information Science, 2014 9 3.2 Classification m odels In the introduction of cli nical pharmacy comprehensi bility of the m odels i s an im portant factor. Since we have only a limited am ount of data availab le we opted for simple and comprehensible models and selected naïve Bayesian classifier and decision trees. To check whether we lose some predictive accuracy compared to more advanced methods, we also tried random forests ( Breim an, 2001), which is known for its robus t performance, but did not observe any advant ages over the simple methods. The naïve Bayes cl assifier i s based on a presumption of i deal independency of attributes, and classifies them according to their important features, minimiz ing the probabili ty of misclassificat ion. It also works on small training sets which gives it i ts main advantage (Gupta & Suma, 2013) . It has been used successfully for attitude and behavior prediction, and we also expected it to be a successful tool in constructing the prediction model for introduction of clinical pharmacy in the hosp ital. Decision trees are branched structures of decision sets which generate classifica tion r ules for data sets. The decision t rees are part of a s tandard toolbox o f numerous analy tical softw are solutions. 4 Understanding of important factors for clinical pharmacy The aim of the data analysis was to discover the most influential clinical pharmacy activities regarding the total satisfaction with clinical pharmacy service as a whole. The OrdEval al gorithm was used for processing of the sur vey data. Based on the findings we constr ucted a p rediction mode l for the introduction of clinical pharm ac y services on the w ards, where such c ooperation has n ot yet been established. We aim ed to id entify t he wards with the highest probability of successf ul cooperation with a clinical pharmacist. We used a Naïve Bayes and decision tree classifiers to construct a prediction model. The model was then used to compute the est imated overall satisfaction v alue for each of the wards whe re cooperation has not yet been established. 4.1 Results of the Or dEval Using t he OrdEval algorithm we performed an analysis and a v isualization of the results for each attribute (question), taking into account all t he answers to a particular question. Attribut e importance scores (reinforcement factors ) com put ed by the OrdEval a lgorithm are presen ted on Figure 2. T he length of the bar r eflects t he prob ability of the influ ence of a p articular attribute (question) on the ov erall satisfaction value. Red bars (rig ht from the median line) represent positive influence, which m ea ns that in case of increas ing the value for a particular question the ov erall satisfaction value wo uld increase. The c ontrary holds for blu e bars: decreasing of the value of a particular question w ould decrease the overall satisfac tion value. We can notice a statisticall y significant i nfluence in two questi ons (the leng th of the bar reaching beyond the box- and -whiskers). I n the case of decr easing of the values for question s 26 and 38, the Technical report, University of Ljubljana, Faculty of Computer and information Science, 2014 10 overall satisfac tion value c ould decrease. We assum e that poor statistical significance f or other questions is partly the resul t of a relatively sm al l sample we had. Therefore we also decided to take into a ccount some other question s with substant ial influence (the long est bars) reach i ng at least beyond the box, which means that the p r obability of th e reinforcem ent facto r lies within the fourth quartile. We can see that questions 21, 26 and 38 have the longest red and blue bars which means that changing the value f or thes e questions upwa rds o r downw ards would increase/d ecrease the overal l satisfaction value. This kind of attributes are designated as performance attribute s, where quality and/or quantity of activit ies are the key determinants for t he customer' s satisfaction or dissatisfaction (Deng et al., 2008) . In quest ions 14, 17, 28 and 33 we can notice a substantial length of blue bars, which m eans tha t decreasing the v alue for a particular question w ould decrease the ov erall satisfaction v alue while increasing the particula r v alue would not influence the overall satisfaction value. In this case we talk about basic attributes or dissa tisfiers becaus e they can only cause dissatisfaction when not observed at an adequ ate level. Besides perform anc e and basic attribu tes, the Kano model defines excitement attributes (satisfiers) which c an only increase the overall satisfacti on value when observed at s ufficient level but having no inf luence when they are not observed (D eng et al ., 2008). Among all the questions, question 38 ha s t he most noticeable positive and neg ative impacts. It is pertaining to t he provision of all kind of information about medicines. Providing of objective quality information about medicines i s o ne of the most frequent activities o f clinical pharm ac ists and it has also been pr oven to be successful elsewhere (Chevalier & Neville, 2011 ; Kjeldsen, Jensen, & Jensen, 2011). Besides the negative reinforcem ent, t he question 38 also has the strongest upwards reinf orcement f actor which is however not statistically significant, since its downwards reinforcem ent is stronger. When taking into account al l the answers for each quest ion, t here were no excitem ent attributes identified by the O rdEval al gorithm in our dataset. Technical report, University of Ljubljana, Faculty of Computer and information Science, 2014 11 Figure 2: OrdEval algorithm values for all attributes As the Or dEval al gorithm also enabl es fea ture level detailed data analysis and visu al ization, taking into accoun t a value change for a certain feature, we com puted and visualized all the questions and their reinforcem ent factors at each value. The length of the bars reflects the streng th of the influence of the change at a certain value. For each value also the 95% confidence interval is computed and visualized with box- and-whiskers plot above each b ar. The bars reaching beyond the box -and- whiskers plot depict st atistic ally significant reinforcem ent factors for each upwards or downw ards value chan ge. Besides seven sta tistically significant reinforcem ent f actors we a lso analy zed the question s with reinforcem ent factor at least 0.6. We assumed t he questions with reinforcem ent p robabilities lower than 0.6 hav e a neglecting i nfluence. Technical report, University of Ljubljana, Faculty of Computer and information Science, 2014 12 In a detailed analysis, we identified six questions, 9, 19, 21, 26, 33 and 38, where decreasing of a value could decrease the overall satisfaction value while increasing of a value would i ncrease the overall satisfactio n. These questions are therefore assigned as performance attributes. T he questions and the OrdEval visualization of t he reinforcement factors for performance attributes are shown in Figure 3 . Figure 3: A visualization of the OrdEval a lgorith m for questions where increasing/decreasing of a certain value could increase/decrease the overall satisfaction v alue. The question 33 deals with the competence of pharmacists rather than their activity. There are some other qu estions like this in the survey . Per formance of an activity has a direct impact on its quality and consequently on the sat isfaction. On the other ha nd this is not true for the competence. Rathe r we can say t hat perfo rmance is a funct ion of competence. In future it would be reas onable to includ e into the satisfact ion surv ey questionnaire only questions concerning activities and not competencies. Technical report, University of Ljubljana, Faculty of Computer and information Science, 2014 13 The analysis of the inf luences of other quest ions gives us very useful information for dire cting the clinical pharm acists' act ivities. On the wards where t he coope ration of a clinical pharm acist was established, pharm acists mostly perform the activities described in questions 9, 19, 21, 2 6 and 38. Based on informal contacts with the medical and nursing staff mem ber s we realized that satisfact ion with the cooperation wit h a clinical p harmacist depends on quantity, namely on the amount of time that pharmacis ts are able to dedicate to c linical pharm acy ser vices and th e am ount of work done o n the ward. Some of the ward chi ef physicians expr ess their demands very clearly saying they don't want c linical pharmacy to only be a boutique se rvice for selec ted pat ients. Rather than that, th ey want this serv ice for all of t heir patients. In questions 19 and 38, only downwards reinforce ment factors are statistica lly significant. Therefore we can conclude that these two activ ities h ave a tendency to becom e basic (dissatisfiers) attributes where decrease of the value would decrease the overall satisfaction while increasing the value wouldn' t have a considerab le influence. With question 21 we can notice a statistically significant in fluence o n the ov erall satisfaction v alue when decrea sing th e value from 3 to 2 but also when increasing the value from 3 to 4. Consider ing the mean scores for physicians and nurses in the survey, 4 .2 and 3.0 respectively, the result of the OrdEval algorithm is expected. A statistically significant influence of decreas ing the valu e from 2 to 1 for question 19 can be noticed. The mean scores of physicians and nurses in the survey were 3.5 and 2.9 respect ively, which indicates relat ively l ow expectations. As the pharmacists' mean score for this question wa s 4.8 we c an anticip ate th at the decrease from 2 to 1 is not really likely to happen. I n t hat case we can assig n certa in im portance also to the upwards reinforcement factor when changing the value from 3 to 4, although it is st atistically not significan t. For that reason w e included th e qu estion 19 into t he pe rform ance attr ibutes g roup. On t he b as is o f the results ob tained with the OrdEval a lgorithm we can assume tha t this ac tivity is going to becom e a basic one. I t was shown t o be one of t he most v al uable activities of clin ical pharmacists in (Kaboli et al., 2006 ; Knez et al., 2011 ; Rež onja et al., 2010). In the visualization of the results for questions 14, 15, 16, 17, 32, 35, 36, 41, 44 and 46 we notice a subs tantial asymm etry of the reinforcem ent factors in t he upwards direction. In c ase of increase of a value for these questions the overall satisfact ion value would increase. Activ ities described in these questions therefore belong to a group of exc itement attributes. Their description and visualization are show n in Fig ure 4. Technical report, University of Ljubljana, Faculty of Computer and information Science, 2014 14 Figure 4 : A Visualization of the OrdEval algorithm for questions where increasing of a c ertain value could increase the overall satisfaction value. Technical report, University of Ljubljana, Faculty of Computer and information Science, 2014 15 The questions 35 and 36 describe pharmacists' competences and we cannot use t hem for the evaluation of the satisfaction with the clinical pharmacy service (same as for the question 33) . Anyway, the results of the OrdEval algorithm give us i mportant information for the planning and direction of clinical pharmacy services. Despite low median sco res for these two ques tions from physicians and nurses we can expec t an increase in the overall satisfact ion when increasi ng scores for these two ques tions. According to th e results giv en by the OrdEval algor ithm, question 17 is an excitement attribute , too. High mean scores reached by physicians (4 .8) and nurses (4 .5) in the survey could lead us to a false conclusion t hat this activity is basic, however t he OrdEval algorithm shows us an opportunity to increase the overall satisfaction value. Reinf orcem ent factors for other questions in this group are high as well and are meaningful and usef ul in planning of activities. Although statistically not significan t (possibly due to a small sample) they show us t he activities with considerable poten tial of in creasing the overa ll satisfaction val ue. The only question where an alysis shows a substantial d ownwards reinforcem ent f actor is question 11. Decreasing the value from 3 to 2 w ould have stat istically si gnific ant decreasing impact to the overall satisfact ion value. C onsequently w e place this activ ity into the basic type of attribu tes. While ana lyzing the detai led attribu te results of the Or dEval alg orithm we detec ted the sam e set of important questions as wh en conside ring all scores of a certa in quest ion. T he o nly exc eption is question 28 which showed too little impact (reinforcement < 0.6) in deta iled analy sis. Besid es these, the detailed analy sis revealed some other important questions. How ever, the most important finding of the comparison of the two levels of the analysis is that in some questions the direction of influence has cha nged when examining detailed r esults. For example, questions 14 and 17 would be in the basic group of attributes when considering average over all values, while value level analysis display s the excitem ent f eature of thes e two attributes. Furthermore we can notice that f or some questions t he reinforcement factors are ext remely low (value < 0.4) and some v alues even do not oc cur in the visualization of the collecte d answers (Fig. 2, questions 7,8 and 3,4). S ome of these questions hav e sim ilar context and it wo uld be r easonable to merge them into a common-meaning question in t he f uture. This analysis unveils another application of the OrdEval algorithm, namely it ca n be used for testing and validating survey questions during the dev elopm ent phase of a questionn aires’ . We noticed in some cases that the overall satisfaction with the cooperation w ith clinical pharmacists depends not only on t he services they provide but also on their personality characteristics where a proactive approach is desired. With future evaluations of satisfaction it would be necessary to consider also the pe rsonal chara cteristics of pharm ac ists. There are at least two no table advantag es of the OrdEv al algorithm for managerial analysis. First, it provides user-friendly visualization supporting decision mak ing process, and second, its two- level structure enables a detailed insig ht into the direction and strength of the i nflue nce of particular values and threshold s. Technical report, University of Ljubljana, Faculty of Computer and information Science, 2014 16 4.2 Prediction m odels In order to construct the prediction model we used the 10-fold cross v alidation m ethod, which i s known to be suitable for sm al l samples (Molinaro, Simon, & Pfeiffer, 2005). We used Orange Canvas environment ( Dem šar et al., 2013 ). Am on g different c lassifiers t ested, Naive Bayes, classification trees, and random forests, g ave us t he best c lassification accurac ies, 57%, 55% an d 50% respectively . These classification accur acies are better than 40.9%, which is a prior probability for the most frequen t answer 5 . If we assume pr edictions differing on l y for one v alue are still acceptable, the classificat ion accuracies of the classification tree and naive Bayes are 77.3% and 72.7%, respectiv ely. These classification accuracies are good enough and we can rec omm end these two clas sifiers to be used for prediction pur poses in the fu ture . The constructed pr ediction m odel forecasts the highest value (5) for four clinical departm ents, a value of 4 for six c linical d epartments and a v alue of 3 or less fo r other clinical departm ents. From a practical poi nt of v iew it is the m ost i mportant for a prediction m odel to cor rectly predict the highest values. After the analysis we introduced clinical pharmacists to some of the clinical departments with the highest predicted value. We currently have a very positive feedback in all departments, although the satisfaction has not been measured objectively yet. We can conclude that in spite of using the analytical tools known to be suitable for small samples, the sample size remains a limiting factor for our study, which has to be considered while interpreting the prediction mode l results. When introducing further clinical ph armacy services, we will have t o take i nto account that the predicted v alues hold to some degree for the heads of the de partment but not necessarily for the whole departm ent and for all the phy si cians. 5 Conclusions We adapted a g ene ral methodology for analy sis of ordered da t a t o the spe cifics of hum an resources manag ement in hospital. We were able to obtain useful managerially relevant inform ation from a relatively small sam ple of highly rel evant respondents. We show ed how the Or dEval algorithm exploits the information hidden in the or dering of class a nd attribute values and their inherent correlation. T he algorithm can handle ordered attributes and ordered classes, i s aware of the information the ordering contains, and is able to handle each value of the attribute separately. The provided output can be effectively visualized and complemented with confidence i ntervals f or reinforcem ent factors. The visualizations turned out useful in our clinical pharmacy research case study. Contrary to other su rvey analysis algorithm s, using the OrdEval algorithm we c ould g et a deep insight into the opp ortunities to infl uence the satisfa ction with clinic al pharm acy services. OrdEval served us as a tool to reveal the crucial attributes wh ich, whe n dec reasing, decrease t he ov erall satisfaction value, and increase the overall satisfac tion v alue wh en i ncreasing . We were able to Technical report, University of Ljubljana, Faculty of Computer and information Science, 2014 17 detect basic, per formance, and ex citement a ttributes expressed in our survey question s, which w as important for planning and managing of the introduction of new clinical pharmacy services in clinical departm ents of the hospi tal. While we had good r easons to limit the size of the sample to t he most import ant decision makers, from anal ytica l point of view it would be reasonable to take a larger sample. A future s urvey involving all th e physicians and nurses w ould be h ighly welcom e and would allow constru ction o f a new predic tion m odel. Am ong prediction m odels constructed on existing data, w e selected the model wit h the h i ghest num ber of corr ectly predicted high values . As we introduce clinical pharmacists to a limited num ber of departments, from practical point of view, they will be only introduced to the departments with th e high prediction value. The constructed prediction model was found to be successful and useful by the head of th e pha rmacy who was responsible for hum an resources a llocation. I n the futu re an objec tive m easur e of success has to be us ed to val idate the generated model to av oid a possible bi as introduced by sub jective judgment of the head of pharmacy. Finally, the survey data sets are i mportant sources o f data and their successful analysis is o f key importance for inform ed poli cy-decision making . We showed that the OrdEval can be efficient i n this respect. Acknowledg ements Andreja Čufar was sup ported by the Universit y of Ljubljan a innovative sheme for PhD study. Al eš Mrhar and Mark o Robnik- Šikonja were supported by th e Slovenian Research Agency, ARRS, through research pr o grammes P1 -0189 (B) and P2-0209, respectiv ely. 6 Refer ences Alkhateeb, F. M., Claus on, K. A., McCaffer ty, R., & Latif, D . A. ( 2009). Physician attitudes toward pharmacist provision of medication therapy m anagemen t services. Pharm World Sci, 31 (4), 487-49 3. Berger, C., Blauth, R., Boger, D., Bolster, C., Burchill, G., DuMouchel, W., Walden, D. (1993). Kano's method for understand ing customer-defined quality. Center for Quality of Management Journal, 2 (4), 3 – 35. Bond, C. A., & Raehl, C. L. (2008). 2006 nati onal clinical pharmac y services survey: clinical pharmacy services, collaborative drug management, medica tion errors, and pharmacy technology. Pharmac otherapy, 28 (1), 1- 13. Borenstein, J. E., Graber, G., Saltiel, E., Walla ce, J., Ryu, S., Archi, J., Wein garten, S. R. (2003). Physician-pharmacist comanagement of hypertensi on: a randomized, comparati v e trial . Pharmacotherapy, 23 (2), 209-216. Breiman, L. (200 1). Random f orests. Machine learnin g , 4 5(1), 5- 32. Breiman, L., Fried man, J., & Olsh en, R. (1984). Classi fication and Regressi o n Trees. Wadsworth, Belmont, California . Chevalier, B., & Neville, H. L. (2011). Evaluating clinical ph armacy ser vices on a surgical patient- care area: a nurses' sa tisfaction sur vey. Int J Pharm Pra ct, 19 (1), 61-69. Technical report, University of Ljubljana, Faculty of Computer and information Science, 2014 18 De Rijdt, T., Willems, L., & Si moens, S. (2008). Economic effects of clin ical pharmacy interventions: a literature revie w. Am J Heal th Syst Pharm, 65 ( 12), 1161-1172. Demšar, J ., Curk, T., Erjavec, A., G orup, C., Ho čevar, T., M ilutinović, M., Zupan, B. (2013). Oran ge: Data Mining Toolb ox in Pyth on. Journal of Machine Le arning Research, 1 4 , 2349-2353. Deng, W.-J., Kuo, Y.-F., & Chen, W.-C. (2008). Revised Importance-Perfor mance Analysis: Three- Factor Theory and Benchmarkin g. The Service Industri es Journal, 28 (1), 3 7-51. Efron, B., & Tibshiran i, R. J. (1993). An Introduction to the Boo tstrap. . London, G reat Britain; New York, United State s of America: Chap man & Hall Esfandiary, N., Babavalian, M. R., M oghadam, A. M. E., & Tabar, V. K. (2 014). Knowledg e Discovery in Medicine: Current Iss ue and Future Trend. Expert Syste ms with Applications , 41 (9 ): 443 4 – 4463. Gupta, S., & Suma, V. (2013). Enhancing human aspect of software engin eering using Baye sian classifier. International Journal of Cognitive Science, Engineering, and Technology, 1 (1), 16 -20. Hepler, C. D. (2004). Clinical pharmacy, pharmaceuti cal care, and the quality of drug therapy. Pharmacotherapy, 24 (11), 1491-1498. Kaboli, P. J., Hoth, A. B., McClimon, B. J., & Schnipp er, J. L. (2006). Clinical pharmacists and inpatient medical care: a syste matic review. Arch Inte rn Med, 16 6 (9), 955-964. Kano, N., Seraku, N., Takahashi, F., & Tsuji, S. (1984). Attractive quality and must-be quality. The Journal of the Japa nese Society for Quality Control, 14 (2), 39 – 48. Kjeldsen, L. J., Jensen, T. B., & Jensen, J. J. (2011). Physicians' evaluation of clinical pharmacy revealed increased focus on quality improvement and cost savings. Dan Med Bull, 5 8 (5), A4261. Knez, L., Suskovic, S., Rezonja, R., Laaksonen, R., & Mrhar, A. (2011). The need for medication reconciliation: a cross-sectional observational study in adult patients. Respir M ed, 105 Suppl 1 , S60-66. Kononenko, I. (1995). On biases in estimating multi-valued attributes. Paper presented at the 14th International Joint C onferen ce on Artificial Intelli gence, Montr eal, Quebec, Can ada. Miller, R. R. (1981). History o f clinical pharmacy and clinical pharma cology. J Clin Pharmacol, 21 (4), 195-197. Molinaro, A. M., Simon, R., & Pfeiffer, R. M. (2005). Prediction error estimation: a comparison of resampling methods. Bioin formatics, 2 1 (15), 3301-3307. Phillips, R. C., & Lipman, A. G. (1981). Physicians' perceptions of clinical pharmac y service. Hosp Formul, 16 (9), 988- 991, 994-985, 9 98-1000 passim. Quinlan, J. R. (199 3). C4. 5: programs for machine lea rning. (Vol. 1): Morgan kaufmann. Rauch, T. M. (1982). The pe rceptions o f a rmy ph ysicians and nurse s on the relative importanc e o f clinical pharmacy s ervices. Mil Med, 1 47 (5), 391-395. Režonja, R., Knez, L ., Šuškovič, S., Košnik, M., & M rhar, A. (2010). Comprehensive medication history: the ne ed for the implementation of m edication reconciliation pr ocesses. Slovenian Journal of Public Health, 4 9 (4). Robnik- Šikonja, M., Brijs, K., & Vanhoof, K. (2009). Ordinal Evaluation: A New Perspective on Country I mages. In P. P erner (Ed.), Advances in Data Mining . Ap plications and Theo retical Aspects (Vol. 56 33, pp. 261-275): Springer Be rlin Heid elberg. Robnik- Šikonja, M., & Kononenko, I. (2003). Theoretical and empirical analysis of ReliefF and RReliefF. Machin e Learning Journa l, 53 , 23 – 69. Robnik- Šikonja, M., & Vanhoof, K. (2007). Evaluati on of ordinal attributes at v alue level. Data M in. Knowl. Discov., 1 4 (2), 225-243. Technical report, University of Ljubljana, Faculty of Computer and information Science, 2014 19 Rommers, M. K., Zwaveling , J., Guchelaar, H. J., & Teepe -Twiss, I. M. (2013). Evaluation of rule effectiveness and positive predictive value o f clinical rules in a Dutch clinical decision support system in daily hospital pharmacy practice. Artificial Intelligence in Medicine, 59(1), 15- 21. Scheepers-Hoeks, A. M. J., Grouls, R. J., Neef, C., Ackerman, E. W., & Korsten, E. H. (2013). Physicians’ responses t o clinical decision support on an intensive care unit — Comparison of four different aler ting methods. Artificia l Intelligenc e in Medicine , 59(1 ), 33- 38. Sulick, J. A., & Pathak, D. S. (1996). The perceived influence of clinical pharmacy services on physician prescribing behavior: a m atched-pair comparison of pharmacists and physicians. Pharmacothe r apy, 16 (6), 1133-1141. Zillich, A. J., McDonough, R. P., Car ter, B. L., & Doucet te, W. R. (2004). Influential characteristics of physician/phar macist collaborativ e relationship s. Ann Pharmacother, 38 (5), 7 64-770.
Original Paper
Loading high-quality paper...
Comments & Academic Discussion
Loading comments...
Leave a Comment