A Study on Stroke Rehabilitation through Task-Oriented Control of a Haptic Device via Near-Infrared Spectroscopy-Based BCI
This paper presents a study in task-oriented approach to stroke rehabilitation by controlling a haptic device via near-infrared spectroscopy-based brain-computer interface (BCI). The task is to command the haptic device to move in opposing directions…
Authors: Berdakh Abibullaev, Jinung An, Seung-Hyun Lee
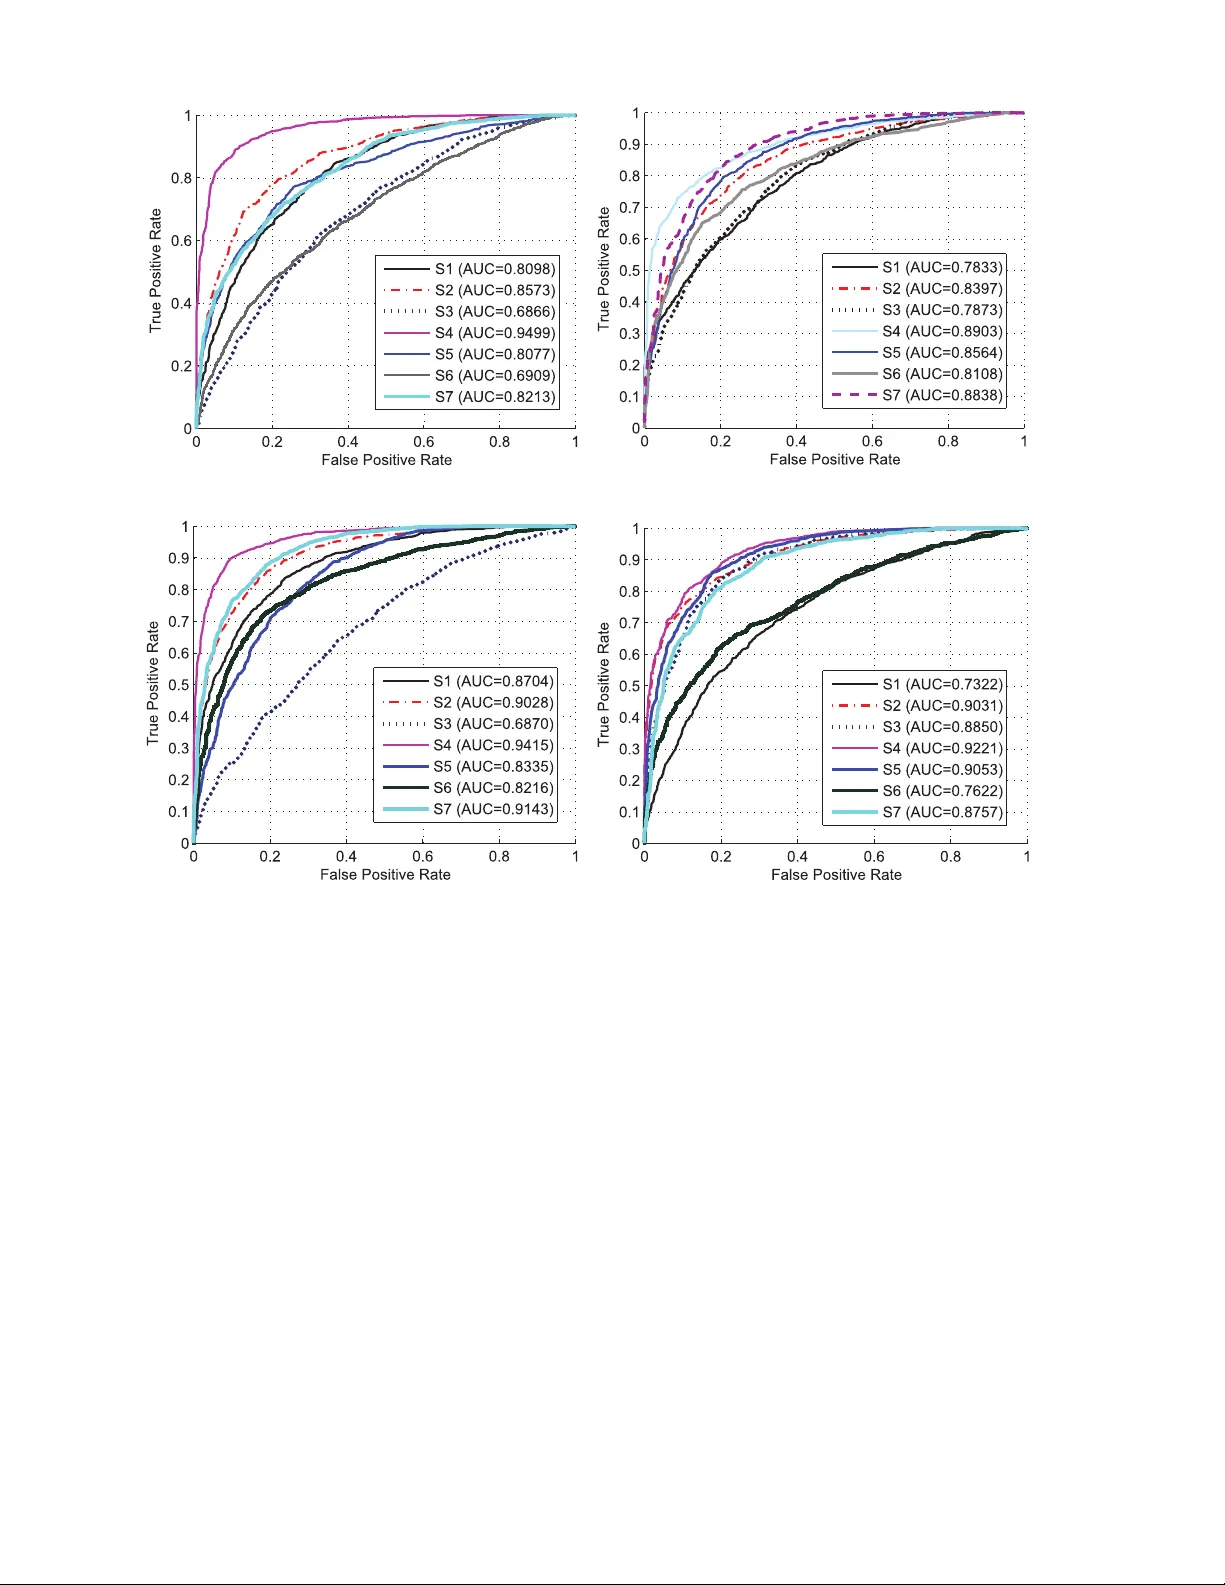
1 A Study on Stroke Rehabilitation through T ask-Oriented Control of a Haptic De vice via Near -Infrared Spectroscopy-Based BCI Berdakh Abibullae v , Jinung An, Seung-Hyun Lee, and Jeon-Il Moon Abstract —This paper presents a study in task-oriented approach to strok e rehabilitation by controlling a haptic device via near-infrar ed spectroscopy-based brain-computer interface (BCI). The task is to command the haptic device to move in opposing directions of leftward and rightward movement. Our study consists of data acquisition, signal pre- processing, and classification. In data acquisition, we conduct experiments based on two different mental tasks: one on pure motor imagery , and another on combined motor imagery and action observation. The experiments were conducted in both offline and online modes. In the signal prepr ocessing, we use localization method to eliminate channels that are irrelevant to the mental task, as well as perform feature extraction for subsequent classification. W e propose multiple support vector machine classifiers with a majority-voting scheme for impro ved classification results. And lastly , we present test results to demonstrate the efficacy of our proposed approach to possible stroke r ehabilitation practice. Index T erms —Strok e rehabilitation, brain-computer inter - face, non-in vasiv e, task-oriented, near-infrar ed spectroscopy , haptic device, offline and online classification, principal com- ponent analysis, multiple support vector machines, channel localization I . I N T RO D U C T I O N Recent rehabilitation methods utilize brain-computer in- terface (BCI) to induce brain plasticity for motor con- trol, or achie ve some degree of patient self-suf ficiency by commanding through thinking [1]. This approach gained heightened interest in the research community and opened new possibilities for a considerable number of medical applications. Howe ver , there is still a significant work to be performed before this technology can be fully used in practice, as there is still no overwhelming evidence of functional recov ery on stroke rehabilitation through BCI [2]. This paper presents a task-oriented training for on- line stoke rehabilitation by controlling a haptic device through leftward and rightward mov ement via near-infrared spectroscopy (NIRS)-BCI [3], as shown in Fig. 1. This emerging modality of non-in vasi ve BCI [4], [5] measures the cortical hemodynamics and oxygenation status through chromophore concentration levels of oxyhemoglobin (oxy- Hb) and deoxyhemoglobin (deoxy-Hb) [6],[7], [8], [9]. B. Abibullaev , J. An, J.I. Moon, and S.H. Lee are with the Robotics Research Division. All are with Daegu-Gyeongbuk Institute of Science & T echnology , 50-1 Sangri, Hyeonpung-Myeon, Dalseong-gun, Daegu, 711-873, Republic of Korea. E-mail: {berdakho}@dgist.ac.kr . Fig. 1. A subject commands the haptic device to mov e rightward and left- ward through commands generated by his brain signals and read through near-infrared spectroscopy-BCI. This experiment is performed based on both motor imagery and action observation. A demonstration video of performed experiments is shown here: http://youtu.be/bYdJWdPn_LI. BCI-based rehabilitation has been the focus of many lit- erature studies which include studies of its different aspects on signal, control, and usage [10]; interacti ve feedback and control strategies[11], [12]; progress of rehabilitation strategies [13]; motor imagery to facilitate rehabilitation [14]; and implications of BCI to rehabilitation [15]. More recent literature studies looked into virtual reality and its applications to neuroscience research for neuroreha- bilitation [16]; BCI in communication [17], motor control and neural activities [18]; its dependence on signal acquisi- tion, validation to real-world use, and reliability of function [19]; and recov ery of hand motor function [20]. A considerable number of experiments related to BCI- based rehabilitation have been conducted. These include minimal training and mental stress to patient [21], re- habilitativ e intervention for hand plegia [22], control of 9-degrees-of-freedom (DOF) wheelchair-mounted robotic arm [23], and virtual environment to facilitate neuroplas- ticity [24]. More recent experiments include detection of mov ement intention [25], exoskeleton to control fingers with feedback [26], removing artifact in motor imagery [27], calibrating imagery through passi ve mov ement [28], studying motor learning after stroke [29], and test of feasibility of single-trial, individually-tuned classifiers [30]. Despite the abov e efforts, only a few BCI-based reha- bilitation studies ha ve included a haptic de vice in their approach. Interestingly , there are empirical e vidences that tactile sensing through haptic feedback [31] and vibro- tactile stimulus [32] show improved rehabilitation results. Our work aims to contribute to the same efforts of in- cluding haptic device to BCI-based rehabilitation, and is 2 -channel minimization - feature extraction by PCA Multiple SVM Classifiers Fig. 2. Flowchart of the task-oriented control of a haptic device via NIRS-BCI. Concentrations of oxy-Hb and deoxy-Hb are read from 45-channel of NIRS. Input signals are pre-processed by identifying the more significant channels, and by performing feature extraction through principal component analysis (PCA). Classification is performed via multiple support vector machines (SVMs), whose output is also used for tenfold cross validation (CV). The decoded outputs are then used to control movements of an external haptic device in either leftward or rightward motion. Success or failure of the task required is determined through the visual feedback of the haptic motion. implemented by using both motor imagery and combined motor imagery-action observation methods. T o driv e the haptic de vice, signals are pre-processed and most significant channels are identified, then the output signals are classified to move the haptic de vice to a desired direction. V isual feedback determines the success or failure of the desired action based on the subject’ s brain signal command. Our experimental setup will be described and results of training the classifier will be shown. Online and offline test results will be presented which determines the efficac y of our proposed method for stroke rehabilitation. This work proceeds as follows. Section II presents how our classifiers are trained and optimized through offline supervised learning. Once these classifiers are optimized, we test them with offline and online data sets. The offline test data results are sho wn in Section III, while the more challenging case of testing via online data streaming is shown in Section IV. And lastly , Section V shows the discussion and comparison between our results and the previously published results in BCI-based rehabilitation. I I . M A T E R I A L S A N D M E T H O D S Offline supervised learning is used to train and optimize our classifiers. First, raw signals are pre-processed using feature extraction through principal component analysis (PCA). This reduces the noise from the raw signal that was read through NIRS-BCI. Furthermore, more significant channels of NIRS-BCI are identified through recursi ve channel elimination (RCE). This eliminates the non-task- relev ant channels, which can be another source of signal noise. From the processed signals that were read through task-relev ant channels, classification is performed based on the actions commanded by the subject. Our classification uses multiple support vector machines (SVMs), where a majority voting mechanism is then used to further refine the classification process. Output from SVMs is used for tenfold cross v alidation (CV) in the signal pre-processing stage. T est data from both offline and online data sets verifies the efficac y of the trained classifiers. The flo wchart of the entire experimental process is shown in Fig. 2. A. Data Acquisition Experimental subjects consist of se ven healthy , right- handed males ages 28 ± 4 years. All study participants ga ve informed consent. The ethical approv al of the research was granted by the research ethics committees of the Daegu- Gyeongbuk Institute of Science and T echnology . The NIRS-BCI used in our work has 45-channel optical brain-function imaging system for data acquisition (FOIRE- 3000, Shimadzu Co. Ltd., Japan). It uses safe near-infrared light to assess the oxy-Hb and deoxy-Hb concentrations of the brain at wav elengths of 780 nm, 805 nm, and 830 nm. This study uses concentration levels of oxy-Hb for analysis and classification, which are found to be more correlated with the regional cerebral blood flo w (rCBF) than deoxy-Hb and total-Hb [33]. An increase in rCBF reflects an increase in neural acti vity [34]. W e placed the optical fiber probes on the frontoparietal regions of the brain cortex to cover an area of 21 × 12 cm as sho wn in Fig. 3A. The subjects performed three types of mental tasks denoted by { t rig ht } , { t lef t } and { t rest } as follows: • { t rig ht } - subjects repetitively performed an imaginary rightward movement of the haptic device, • { t lef t } - subjects repetitiv ely performed an imaginary leftward movement of the haptic device, and • { t rest } - subjects rest and perform no actual task. The signals during rest were used as the baseline in a classification process. Each subject performed five-session mental tasks for a total of 35 sessions for all subjects. W e 3 0 40 70 Fig. 3. (A) The locations of NIRS emitter-recei ver optodes with 30-mm interoptode distance. The red circles represent emitters and blue circles represent receivers. The yellow circles represent the locations of the 45 channels recorded. (B) The timing of a single experimental trial of data acquisition, shown with its corresponding oxy-Hb, deoxy-Hb, and total Hb concentrations at each stage of the task. split every session into three blocks [ Rest → T ask → Rest ] as sho wn in Fig. 3B. In the same figure, the cor- responding levels of oxy-Hb, deoxy-Hb, and total Hb are also sho wn during one experimental session of MI task. B. T ypes of Experiments This work uses two types of tasks to control the haptic device: 1.) motor imagery (MI) task, and 2.) a combined action observation (A O) and MI tasks. The latter type of task is also referred to as A OMI task. In MI tasks, subjects merely imagine the task without an external cue. In A OMI tasks, the subject performs an A O task follo wed by an MI task. The A O task consists of w atch- ing a video that shows the movements of a subjectâ ˘ A ´ Zs forearm in the intended direction. Our motiv ation for the A OMI task experiment is based on earlier studies related to the putative human mirror neuron system that describe how predictions and interpretations of the actions of others were exploited for BCI systems [35] [36]. W e want to in vestigate whether the combined A OMI task provides higher BCI classification rates than a pure MI task. C. Signal Pre-pr ocessing W e consider two significant factors that affect the accu- racy of a BCI system: 1.) background noise, and 2.) task- irrelev ant channels. The noise interference in hemodynamic signals may arise from instrumental, experimental, or physiological sources. Particularly , physiological noise often overlap in frequency with the expected neural signals [3]. In this study , we em- ploy PCA for noise reduction and feature extraction, which has shown to be more reliable in eliminating background noises in NIRS signals [37]. Other noise-reduction methods use W einer filtering [38], wav elets [39], [40], and adapti ve filtering [6]. Selecting task-relev ant channels may yield the required accuracy with greater con venience [41], [42]. Unfortu- nately , optimal channel selection is not a trivial task, in particular for NIRS-BCI, when extracting neurophysiologic knowledge corresponding to a specific mental task. The next section describes our BCI channel selection strategy in more detail. D. Principal Component Analysis The neural datasets are denoted by X ∈ R l × m , such that l is the number of channels and m is the number of samples. W e denote a single trial dataset as a matrix X ∈ R l × m that has its ro ws { x 1 , x 2 , ..., x l } T composed of the channel observations with m features or dimensions. Our goal is to find a ne w data matrix X ∈ R l × k where k < m . W e emplo y a PCA method for this purpose. It is based on projecting signal features x ∈ R m onto a subspace defined by a set of orthonormal vectors u ∈ R m that maximize the data v ariance E , maximize E = u T X T X u (1) subject to k u k = 1 Solving the optimization in Eq. 1 by the Lagrangian method yields the eigenv alue equation X T X u = λu . It follows that to maximize the variance, the chosen u must be the eigenv ector of X T X corresponding to the largest eigen value. In order to compute k directions, we must find eigen vectors u 1 , ..., u k corresponding to the k largest eigen values giv en λ 1 , ..., λ k , such that λ 1 ≥ λ 2 ... ≥ λ k . Algorithm 1 shows our method to find the PCA projection directions. The resulting features extracted by PCA are X u 1 , ..., X u k . E. Recursive Channel Elimination W e employ a recursiv e channel elimination (RCE) al- gorithm [41],[43] for identifying the recording positions most relev ant to cognitiv e tasks. The method is based on recursiv e feature elimination [44], which is an iterativ e, embedded, greedy backward method of feature selection. The best channels are determined by training several SVMs 4 Algorithm 1: PCA Pre-procesing 1 Input : Data matrix X l × m , dimension k 2 Process: X 1 = X ; 3 for each i = 1 , ..., k do 4 Select u j as the first eigenv ector of X T i X j ; 5 X j +1 = X j I − u j u T j u T j u j 6 Output : Projection directions u and features X u and exploring their marginal characteristics. Algorithm 2 describes our method for channel selection. The algorithm can can be summarized as follows: • make ten disjoint training datasets (Line 2) for tenfold CV , • train a linear SVM (Line 9) and estimate the general- ization error (Line 10) for each fold, • estimate the rank of the channels based on a margin ranking criterion (Lines 11-14), and • eliminate channels with the lowest ranking score cri- terion (Line 15). W e repeat the procedure until the required number of channels is retained throughout all ten datasets. W e define a threshold v alue for the number of channels that potentially need to be retained. This is done by trial and error on the basis of the test error rate at Line 10. W e tried sev eral channel combinations and decided to select only 20 of the 45 channels for subsequent classification. Algorithm 2: Recursive Channel Elimination 1 Input : { x i , y i } l i =1 , x i ∈ X , y i ∈ {± 1 } , training set with l channels related to either { t rig ht } or { t lef t } tasks. 2 Perform tenfold, divide the training set (of size) m into p disjoint sets S j , ..., S p of equal size p/m ; 3 for each S j do 4 Initialize: Rank ed = [ ∅ ] ; 5 Surviving channels C h j = [1 , 2 , ..., l ] 6 while Surviving channel is not empty do 7 for each channel in C h j = [1 , 2 , ..., l ] do 8 T emporarily remove channel j in C h ( j =1 ,...,l ) ; 9 T rain a linear SVM with the remaining channels of S/S j and estimate | w | (from Eq. 2, Eq. 3); 10 T est it on S j 7→ {± 1 } ; 11 Compute the ranking score: R j = 1 | C h j | P l ∈ C h j | w l | ; 12 Locate channels with smallest ranking criterion: Rank C han = ar gmin { R j } ; 13 Update channel rank: Rank ed = [ Rank C han, Rank ed ] ; 14 Eliminate the channel with smallest R j score; 15 Output : Extracted channel list: Rank ed F . Classification Giv en set of pre-processed training dataset X := { x 1 , ..., x m } with corresponding labels Y := { y 1 , ..., y m } , where y i ∈ {± 1 } for i = 1 , . . . , m , our next goal is to estimate a function f : X → {± 1 } to predict whether a new signal observation z ∈ X ∗ will belong to class +1 or − 1 . W e defined the classes for the mental tasks [ { t rig ht , +1 } , { t rest , , − 1 } ] as patterns related to rightward mov ement ( y = +1 ) and the baseline ( y = − 1 ). Similarly , we define [ { t lef t , +1 } , { t rest , − 1 } ] as patterns related to leftward mov ement and the baseline ( y = − 1 ). W e estimate a set of SVM functions for classification with a soft margin loss function L ( x, y , f ( x )) = max (0 , 1 − y f ( x )) . The solution of SVM is based on the following optimiza- tion [45]:, min α ∈ R,b ∈ R 1 C m X i =1 ξ i + m X i,j =1 α i y i K ( x i , z j ) α j y j subject to y j m X i =1 α i y i K ( x i , z j ) + b ≥ 1 − ξ i ξ i ≥ 0 , ∀ i = 1 , 2 , ..., n (2) where α = ( α 1 , ..., α m ) are Lagrange multipliers, the ξ i are slack variables and a user defined regularization parameter C > 0 . The corresponding decision function is giv en by , f ( z ) = sign m X i =1 α i y i K ( x i , z ) + b . (3) From Eq.2 and Eq. 3, the K ( x, z ) is a reproducing kernel function which gi ves rise to a Gram matrix K i,j := ( x i , z j ) , K ∈ R m × m [ 20 ]. This matrix contains all the information av ailable in order to perform data analysis and modeling of SVM algorithm. Note that we use this formulation of the SVM for two different purposes. First, we use SVMs for the recursiv e channel elimination method in Algorithm 2. Second, SVMs constitute the bases functions of multiple classifiers which we use for decoding of signal features related to MI and A OMI tasks. G. Multiple SVM Classifiers Instead of training a single classifier , we study train multiple SVMs with the purpose of further improving the ov erall BCI accuracy . W e consider a multiple n - classifier functions { f 1 , f 2 , ..., f n } and a data set { ( x i , y i ) m i =1 } , x i ∈ X, y ∈ Y . Each classifier is trained independently to predict f n i =1 : x → {± 1 } n . The outputs from all classifier functions are then defined as an m -dimensional binary vector y = [ y 1 ,i , ..., y m,i ] , such that y j,i = 1 if f i recognizes x j and 0 otherwise for i = 1 , ..., n . T able 1 sho ws that the number of correct assignments is N 1 ( f i ) = P m j =1 y j,i and the number of mistakes is N 0 ( f i ) = m − P m j =1 y j,i . In order to make the final decision from the set of functions { f i , ..., f n } , we define 5 Algorithm 3: Multiple SVM Training and T esting 1 Define : E 1 = { f 1 , ..., f 6 } and E 2 = { f ∗ 1 , ..., f ∗ 6 } ; 2 Input : { x i , y i } m i =1 , x i ∈ X , y i ∈ {± 1 } , training set related to either { t rig ht } or { t lef t } mental tasks. 3 for each f i ∈ E 1 or f ∗ j ∈ E 2 , i, j = 1 , ..., 6 do 4 Perform tenfold CV and a search on optimal C ; 5 Divide the training set (of size) m into p disjoint sets S j , ..., S p of equal size p/m ; 6 for each S j do 7 T rain a f i ( x ) on S/S j ; 8 T est it on S j 7→ AU C ( j ) ; 9 Output : Optimized classifier model : f ( · , α, b ) 10 Output : Set of optimized E 1 = { f 1 ( · , α 1 ) , ..., f 6 ( · , α 6 ) } E 2 = { f ∗ 1 ( · , α 1 ) , ..., f ∗ 6 ( · , α 6 ) } . 11 Input : { z i } n i =1 , z i ∈ X unseen test patterns related to either { t rig ht } or { t lef t } mental tasks. 12 for each f i ( · , α i ) ∈ E 1 or f ∗ j ( · , α j ) ∈ E 2 , i, j = 1 , ..., 6 do 13 Evaluate E : f i ( x j , α i ) → y N ,l , where y j,i {± 1 } are the columns of T able 1, i = 1 , ..., l classifiers and j = 1 , ..., n test patterns; 14 (1)- Majority vote : define k -of- l majority voting classifiers as defined in Eq. 4.; 15 (2)- Output : compute the final A UC value for majority classifiers E → AU C ; 16 Output : E 1 → AU C 1 and E 2 → AU C 2 the follo wing majority voting rule: F ( z ) = +1 if P n i f i ( z ) ≥ k − 1 else P l i f i ( z ) ≤ n − k U Otherwise (4) where k < n and i = 1 , ..., k making similar predictions defined by the k − of − n majority classifier for k ≥ n 2 . In this case, U represents the unknown outputs or failure in predicting both outputs. Thus, we ha ve three possible outcomes from all classifiers F : X → { +1 , − 1 , U } . Algorithm3 gives the details of the proposed multiple SVM classifier training and validation sequentially . This consists of two main phases, namely , the training phase and the testing phase. In both phases, we train and test two different group of multiple classifiers E 1 and E 2 . T ABLE I S T RU CT U R E O F M U L T IP L E O U T PU T S f 1 · · · f i · · · f n x 1 y 1 , 1 · · · y 1 ,i · · · y 1 ,n . . . . . . . . . . . . x j y j, 1 . . . y j,i . . . y j,n . . . . . . . . . . . . x m y m, 1 . . . y m,i . . . y m,n The group E 1 is trained by taking the examples from rightward task { t rig ht } as positive and the examples from the rest task { t rest } as negativ e. Likewise, the group E 2 is trained by taking the examples from the leftward task { t lef t } as positive and the examples from the rest task { t rest } as neg ati ve. Each group consists of six base SVM functions with linear kernels. In the training phase, each individual base SVM function is trained separately using the same input data from the tenfold CV (Algorithm 3, Lines 1-9). During the testing phase, unseen examples are applied to all base functions simultaneously in real time. Further, a collectiv e decision is obtained on the basis of the majority voting scheme using Eq. 4 (Algorithm 3, Lines 12-16). In other words, once each of the six base classifiers has cast its vote, the majority voting strategy assigns the test patterns to the class with the lar gest number of votes and outputs are provided as the final prediction. Then, the final decision on which direction to mov e the haptic device with the output control command is based on the area under the receiv er operating characteristic (R OC) curve. This area under the R OC curve is also referred to as A UC. The A UC is a comparatively robust measure that is insensitiv e to class distributions and misclassification costs [46]. For instance, A UC = 1 indicates perfect classification, whereas A UC = 0 . 5 indicates that the result from the classifier is no better than a random guess. In our case, an A UC > 0 . 70 moves the haptic device to the desired direction. I I I . O FFL I N E T E S T R E S U LT S A N D A N A L Y S I S For each of the sev en subjects, we trained subject- specific multiple SVM classifiers (Algorithm 3) with an input dataset consisting of 20 channels selected using the RCE algorithm. The relev ant channel locations varied among subjects and sessions, and were updated e very time a subject performs mental tasks. The search for an optimal penalty parameter was conducted to obtain the best CV performance. Then we gathered offline data set to test the performance of our resulting classifier . The resulting UA C values are shown in Fig. 4 in moving the haptic device in rightward and leftw ard direction, in both MI and A OMI task commands. W e assign A UC > 0 . 70 to be acceptable, such that the haptic device is moved to the desired direction. For the sake of discussion, we introduce the following three classifier performance regions: • Θ best := (0 . 80 , ..., 1] , if A UC ≥ 0 . 80 , • Θ accept := (0 . 70 , ..., 0 . 80] , if 0 . 70 < A UC ≤ 0 . 80 , • Θ wor st := (0 . 60 , ..., 0 . 70] , if 0 . 60 < A UC ≤ 0 . 70 . The haptic system is the PHANTOM Premium 1.0 haptic device (19.5 cm × 27 cm × 37.5 cm workspace, two activ e degrees of freedom). Real-time neural data were acquired through a LabVIEW - NIRS interface, wherein the proposed algorithms were implemented. Let us consider the decoding results of MI task com- mands in Figs. 4A (rightward mov ement) and 4B (leftward 6 (A) - MI { t right } (B) - MI { t left } (C) - AOMI { t right } (D) - AOMI { t left } Fig. 4. Offline classification results from seven subjects for random test patterns. Plots (A) and (B) represent decoding of motor imagery (MI) tasks: (A) for { t rig ht } task, and (B) for { t lef t } task. Plots (C) and (D) represent decoding of action observation-motor imagery (A OMI) tasks: (C) for { t rig ht } , and (D) for { t lef t } . The value of A UC > 0 . 70 is acceptable. mov ement). In particular , for the rightward movement two subjects showed superior results: S 4 (A UC=0.9499) and S 2 (A UC=0.8573). In addition, three more subjects sho wed satisfactory results: S 1 (A UC=0.8098), S 5 (A UC=0.8077), and S 7 (A UC=0.8213). Howe ver , we noted inferior clas- sifier performance for the remaining two subjects: S 3 (A UC=0.6866) and S 6 (A UC=0.6909). For the leftward mov ement, all subject showed satisfactory results, with three subjects S 4 , S 5 , and S 7 showing superior results. Inconsistency of results in the offline mode can be attributed to BCI intersession v ariability [47]. This problem of dramatic variability arises in neural signal measurements obtained during different recording sessions, even when the same subject is used. In addition, many other factors may affect the characteristics of neural signal measurements, resulting in v ariations. Such factors include the subject’ s condition, mood, fatigue, and drowsiness or even the sub- ject’ s lev el of attention to a particular mental task [48]. W e subsequently in vestigated A OMI task commands. The plots of the decoding signal patterns are shown in Figs. 4C for the rightward task command, and Figs. 4D for the leftward task command. Significant improv ements in A UC values with A OMI tasks were noticeable. For instance, superior results were observed for four subjects ( S 1 , S 2 , S 4 , and S 7 ) in the rightward command task, with only one subject ( S 3 ) that consistently remained with unsatisfactory results in the rightward command task. In addition, all subjects showed improved performance in A OMI compared to MI, with only one subject, S 4 , degrades by A UC=0.0084, but still showed superior results at A UC=0.9415. One subject, S 6 , the previously showed unsatisfactory results with MI now has a much better per- formance with an A UC=0.8216. For the leftward command task, all the subjects sho wed satisfactory results with four subjects ( S 2 , S 3 , S 4 , S 5 ) showing superior results. Degraded results showed for subjects S 1 , S 6 , and S 7 , but remained within satisfactory results. In summary , the offline results showed that our proposed 7 R est MI AO MI MI MI MI MI AO MI AO MI AO MI AO MI R est R est R est R est R est R est R est R est R est R est R est 10 20 30 40 50 60 70 80 90 100 110 120 130 140 150 160 (B) - t [seconds] 10 20 30 40 50 60 70 80 90 100 110 120 130 140 150 160 (A) - t [seconds] Fig. 5. Online experimental protocol for data acquisition. (A) Pure motor imagery (MI) task command. (B) Action observation-motor imagery (A OMI) task command. In both e xperiments, the classifiers decode a user’ s intent every MI execution. classification method in reading brain signal commands to move the haptic device leftward and rightward, has successfully achiev ed the desired motion at 25 out of 28 test cases with only three that showed unsatisfactory results. Furthermore, we observed that signal patterns using A OMI task commands produced better classification results than those using pure MI task commands. This offline analysis may seem uninformativ e so far . Ho we ver , a more important aspect of our research is stable performance of the deriv ed classification models during the real-time BCI experiments. In the next section we report the online results. I V . O N L I N E T E S T R E S U LT S A N D A NA LY S I S In this experiment, NIRS reads input brain signals from the subjects to move the haptic device in real-time. As in the of fline case, we use both MI and A OMI task commands. Communication between NIRS and the haptic device is established through the user datagram protocol. The online experimental steps are listed starting from Line 12 onwards of Algorithm 3. The input data defined in Line 12 correspond to streaming data giv en in real-time to the optimized classifiers. The final output command is attained on the basis of the A UC value. W e conducted both experiments in at least five sessions, not exceeding one session per day or eight sessions in total for a giv en subject. The sessions were organized by inserting A O from the data acquisition protocol, shown in Fig. 3B. W e set the timing of session blocks as shown in Fig. 5. The input consisted of test points 3-5 sec long for E 1 and E 2 , which were equiv alent to 42 samples and 20 channels, that is, X ∈ R 42 × 20 . The classifier performance is measured during MI task execution periods as shown in Fig. 5. 1) Experiment 1 (MI T ask): T able 2 lists classification results from three different sessions corresponding to the pure MI task command. In general, lower classification accuracies were obtained in the online experiment than in the offline experiments. A strong variability is observed in the performances of classifiers across different subjects, ses- sions, and tasks. The mental tasks were more recognizable in some subjects than in other subjects, resulting in larger deviations in A UC values. Classifier performance in the Θ accept are shown in boldface, while Θ wor st are italicised. The trained classifier was successful in 55 out of the total 63 cases with eight unacceptable cases. On average, the classifier performances were equi v alent to ( AU C = 0 . 74 ± 0 . 2 ) within the Θ accept region. W e obtained the maximum possible accuracy ( AU C = 0 . 8441 ) in classifying { t lef t } data from Subject 4. It is noted that the case of Θ best performances were not consistent when classifying the same mental task by the same subject. This emphasizes the major BCI problem of inter-subject and inter-session variabilities with large standard deviations as shown in the table. Even if a participant performed well in one session, the performance within the session may hav e varied greatly among the Θ best , Θ accept and Θ wor se regions. Let us consider the rest task { t rest } in all three sessions. W e note that during the first 3 s of a task period the clas- sifiers produced increased false positiv e rates by detecting task-relev ant signals as baseline signals. This is because of the high inherent latenc y of the brain hemodynamic response, which occurs ov er the interval 4-8 s after the task onset [4],[33]. Moreover , we hav e observed the occurrence of the U case in Eq. 4 when multiple classifiers did not detect any of the mental activity . 2) Experiment 2 (A OMI T ask): T able 3 lists the decoding results of signals corresponding to A OMI task commands. Compared to the MI task commands, A OMI task commands achiev ed superior accuracy . A OMI task commands were successful in 60 out of the total 63 cases with only three cases of failure. Let us compare some specific results between MI and A OMI experiments. For instance, consider the T able 2 entries for Subject 1 during Session 2 { t rig ht } , and Session 3 { t lef t } when the classifier accuracies were in the Θ wor st region. In contrast, the corresponding entries of T able 3 show much improv ement in the A UC values from the A OMI experiments. By comparativ e analysis, we conclude the following. First, the average A UC values in the A OMI experiment were not significantly better than those of pure MI tasks. Howe ver , individual comparisons show improv ements by subjects between sessions. Second, the standard deviations of A UC values were in a range similar to that of the last experiment. And lastly , the dominating inter-subject and inter-session variabilities were observed in terms of A UC values on both MI and A OMI experiments. 3) Brain Mapping Analysis: W e assumed that the clas- sifier performances were affected by the v ariability in the task-relev ant cortical activ ation areas. Because the exact locations of the task-relev ant channels were not always the same, we further analyzed a topographic cortical mapping of task-rele v ant oxy-Hb level changes by using a general linear model (GLM) algorithm explained in [42]. The significance thresholds for the statistical parametric maps were set to p < 0 . 05 . W e separated the topographic map into nine regions of interest according to the functional anatomy of the premotor and prefrontal regions including the sensorimotor cortex (SMC), supplementary motor area (SMA), presupplemen- tary motor area (preSMA), dorsal premotor cortex (PMC), and dorsolateral prefrontal cortex (PFC). The right lateral SMC was covered by Channels 1, 7, 8, and 9; the left lateral SMC by Channels 5, 6, 11, 12, and 13; the SMA by Channels 16, 17, 22, and 23; the preSMA by Channels 8 T ABLE II E X PE R I M EN T 1 : T H E O N L IN E P E RF O R MA N C E O F C L A SS I FI ER S I N D E CO D I N G S I G NA L S C O RR E S PO N D I NG T O P U R E M OT O R I M AG E RY ( M I) TA SK C O MM A N D S O F { t rig ht } , { t lef t } , A N D { t rest } . Subjects Session 1 Session 2 Session 3 { t rig ht } { t lef t } { t rest } { t rig ht } { t lef t } { t rest } { t rig ht } { t lef t } { t rest } (A UC) (A UC) (A UC) (A UC) (A UC) (A UC) (A UC) (A UC) (A UC) Subject 1 0.7781 0.8101 0.1824 0.6987 0.7754 0.1624 0.7141 0.6998 0.2811 Subject 2 0.8115 0.6755 0.3045 0.7375 0.6589 0.1847 0.7157 0.8095 0.1450 Subject 3 0.7801 0.7787 0.2104 0.7584 0.8201 0.1279 0.6590 0.7189 0.2515 Subject 4 0.7124 0.8441 0.1980 0.8014 0.7352 0.1848 0.7684 0.7871 0.2801 Subject 5 0.8380 0.7600 0.1709 0.7412 0.7278 0.2812 0.6971 0.7358 0.2103 Subject 6 0.7312 0.7112 0.1782 0.7813 0.7177 0.2104 0.7300 0.7784 0.2081 Subject 7 0.6819 0.7211 0.1541 0.7987 0. 8380 0.1784 0.7630 0.6798 0.2765 Mean 0.7618 0.7572 0.1997 0.7596 0.7533 0.1899 0.7210 0.7441 0.2360 S.D. 0.0557 0.0590 0.0496 0.0371 0.0622 0.0475 0.0378 0.0484 0.0509 T ABLE III E X PE R I M EN T 2 - T H E O N L IN E P E RF O R MA N C E O F C L A SS I FI ER S I N D E CO D I N G S I G NA L S C O RR E S PO N D I NG T O A C TI O N O B S ERV AT IO N - M OTO R I M AG ERY ( AO MI ) TA S KS C O MM A N D S O F { t rig ht } , { t lef t } A N D { t rest } . Subjects Session 1 Session 2 Session 3 { t rig ht } { t lef t } { t rest } { t rig ht } { t lef t } { t rest } { t rig ht } { t lef t } { t rest } (A UC) (A UC) (A UC) (A UC) (A UC) (A UC) (AUC) (A UC) (A UC) Subject 1 0.8103 0.7811 0.1441 0.7217 0.8125 0.1341 0.8974 0.7489 0.1481 Subject 2 0.7357 0.6982 0.2105 0.7875 0.7510 0.1671 0.8300 0.7712 0.1901 Subject 3 0.7508 0.7517 0.2100 0.8780 0.7982 0.1569 0.7124 0.7680 0.2074 Subject 4 0.8142 0.7802 0.1870 0.7984 0.6815 0.1908 0.8670 0.7046 0.2011 Subject 5 0.7918 0.6901 0.2650 0.7550 0.7201 0.2233 0.7919 0.9308 0.1030 Subject 6 0.8301 0.7011 0.1982 0.8183 0.7870 0.1789 0.7710 0.7118 0.1900 Subject 7 0.7416 0.7809 0.1455 0.7004 0.7909 0.1399 0.7321 0.7808 0.1987 Mean 0.7820 0.7407 0.1923 0.7799 0.7630 0.1701 0.8002 0.7737 0.1769 S.D. 0.0387 0.04255 0.0417 0.0603 0.0477 0.0309 0.0683 0.0752 0.0379 35, 36, 42, and 43; the right PMC by Channels 14, 15, 20, and 28; the left PMC by Channels 18, 19, 24, 25, and 26; the left PFC by Channels 27, 33, 34, 40, and 41; and the right PFC by Channels 31, 32, 37, 38, 39, 44, and 45. The location of a Cz reference point is represented by Channel 10 (see Fig. 2(A)). Fig. 5 sho ws a distinct cortical activ ation pattern reconstructed from data on Subject 1 across dif ferent sessions for both MI and A OMI tasks. T ask-relev ant increases of oxy-Hb were prominent in the prefrontal regions but were strongly dependent on the task type and the session type. For instance, with repetition of the session the increase of oxy-Hb appeared to intensify for the channels covering the right and left PMC for both MI and A OMI while performing the { t lef t } task. The oxy- Hb was augmented in the channels cov ering the SMA and remained unchanged in the channels cov ering the left SMC. For the MI-based t rig ht task, we hav e observed the rev erse case; that is, with repetition of the session the oxy-Hb concentration lev els were observed to decrease in the pre- SMA and PFC regions. By using Algorithm2 each time, we tend to select for a classifier only those task-rele v ant channels with higher acti v ations. Therefore, each time the locations of task-relev ant channels vary , the performance of a classifier is affected. In general, cortical acti vation in the pre-SMA and PFC remained relatively unchanged among most of the subjects within a session. W e visually inspected all changes in the regional activ ation with respect to the subject, task, and session type. W e briefly summarize our findings of the mapping anal- ysis as follo ws: • A session-dependent cortical activ ation was seen for both MI and A OMI tasks. • In some subjects, the cortical activ ation levels in- creased with the number of sessions. • The A OMI task produced higher cortical activ ation than the MI task. The major acti v ation locations for the A OMI task included the PFC, PMC, SMA, and pre-SMC regions. 9 MI AOMI Session 1 Session 2 Session 3 Session 1 Session 2 Session 3 Left Right Fig. 6. Representative cortical mapping of oxy-Hb level changes related to MI and A OMI tasks. The data were obtained from Subject 1 over three sessions. The color scale indicates the coordinates of concentration changes in oxy-Hb with t-values. • The effect size calculated by using oxy-Hb levels showed no significant dif ference in either the { t rig ht } ( p = 0 . 203) or the { t lef t } ( p = 0 . 535) . In terms of the course of oxy-Hb changes during the A OMI period, two tasks showed comparable intervals between the start of the { t rig ht } task and the peak of oxy-Hb in the { t lef t } . • No strong correlation between the MI and A OMI tasks was observed. The ef fect of preparation on the increases in oxy-Hb level during the MI task and A OMI task was ev aluated by calculating ef fect sizes. In terms of oxy-Hb lev els, a one-way ANO V A showed a significant main effect for site during both the MI period ( p < 0 . 05) and in the A OMI period ( p < 0 . 05) . V . D I S C U S S I O N W e ha ve sho wn that it is possible to command a haptic device to move in opposing directions by detecting oxy-Hb signal reading from NIRS-BCI system. This study proposes that such capability can be used for neurorehabilitation to induce brain plasticity for stroke patients, or possibly provide them with some degree of self-sufficiency . MI and A OMI task commands were implemented in both online and offline modes. Feature extraction and channel localization reduced noise in the input signals for classifi- cation of multiple SVMs. The online BCI classification of pure motor imagery tasks was 76% accurate on av erage. And we observed a significant improvement in the BCI accuracies of up to 93% when using signals from A OMI task compared to pure MI. Compared to other studies, ours has obtained improv ed classification rates, as shown in T able 4. Note that only a fe w online classification results achiev ed performances in the range of 70%-90% [57], [51]. Except for the results of Abdelnour et al. [49] whose online classification rate ranges from 68.8% to 100%, our work showed better results. Howe ver , it is noted that [49] used real finger tapping which is more discriminable than pure mental task. The methodology proposed in this paper differs from that in the other studies by virtue of the following attributes: • W e use 45-channels recordings which cover the most important regions of the brain cortex (SMC, SMA, and PFC). This is in contrast with other NIRS-BCI methods, which usually cover minimal locations of the brain cortex . W e then perform an automated channel selection method which allowed us to localize 20 most task rele v ant channels for subsequent clas- sification. Using multiple channels can be seen as a disadv antage, in general. Howe ver , our motiv ation was to accurately localize task relev ant channels each time when subjects perform a specific mental task. Further , because we conduct two different experiments with ne w tasks (the imaginary directional movement tasks are not common BCI research) there was a need to in vestigate multiple channel recordings. Moreover , before each online experiment we perform a channel localization within minutes in each session and for each subject. Such localization helps to capture the session or subject specific neural activ ation within the few relev ant channels. For instance, we hav e noticed that the classifier uses different channel combina- tions to discriminate between the imaginary rightward mov ement and the imaginary leftward movement. In case the fixed number of channels over a specific brain region were used then the classification accurac y could be very unsatisfactory . This is a different mechanism which allowed us to automatically switch the strong task rele v ant channels among various mental tasks. • W e performed different BCI experiments that included directional hand mov ement tasks based on pure motor imagery (MI) tasks and combined action observation and motor imagery (A OMI) tasks. W e found that 10 T ABLE IV A NA L Y S IS M E TH O D S U S ED I N P R EV I O U S N I R S -B C I S T U DI E S . T H E A S TE R I S KS D E NO TE O N LI N E C L A SS I FI C A T I O N R E S U L T S Author (Ref) Brain region Input features Classifier Performance Our study Prefrontal, OxyHb Ensemble SVM 76% - 93% ∗ Sensorimotor PCA Classifiers cortex Abdelnour ([49]) Motor cortex OxyHb after Linear discriminant 68%-100% ∗ Kalman filtering analysis (LDA) Coyle ([50]) Motor cortex mean OxyHb OxyHb amplitude 80% ∗ threshold detector Utsugi ([51]) Prefrontal OxyHb Artificial Neural 70%-90% ∗ cortex Networks Abibullae v ([40]) Prefrontal OxyHb wavelet Linear discriminant LD A 81%-95%, cortex coefficients analysis , Artificial ANN 69%-91% Neural Networks, SVM SVM 94%-97% Coyle ([3]) Motor cortex mean OxyHb Simple threshold 75% of 20sec data detector Cui ([52]) Motor cortex different features Support V ector 70% - 90% OxyHb, deOxyHb Machines Fazli ([53]) Prefrontal, EEG& fNIRS Linear Discriminant 78.6%-92.9% Motor cortex Hybrid features Analysis Sassaroli ([54]) Prefrontal OxyHb, deOxyHb K-means 55.6%-72.2% cortex raw features algorithm Sitaram ([13]) Frontal OxyHb intensity Hidden Markov SVM 73% cortex Models (HMM), SVM HMM 89% T ai ([55]) Prefrontal OxyHb intensity LDA, SVM 75%-96% cortex T ruong ([56]) Prefrontal OxyHb wav elet Artificial Neural 95% cortex decomposition Networks (ANN) A OMI tasks were more classifiable compared to the pure MI tasks. Our idea of designing the directional mov ement tasks are intended for application in stroke rehabilitation physical therapy , which is en visaged to combine BCI with therapeutic de vices for upper limb ex ercises. W e have e xtracted the tasks after revie wing the important tasks used in stroke rehabilitation to improv e the activities of daily living (ADL). The example of other tasks include "reaching", "pulling", "flexion" and "extension" of upper limb. Among them in our initial phase we implemented “leftward” and “rightward” mov ements. The haptic device was just a test platform, howe ver it can be easily replaced with the av ailable upper limb physical therapy devices (e.g. MIT Manus). The limitation of our study is that we study only normal subjects at present study . Moreov er , the number of subjects are limited to sev en. Because our initial goal was to verify the feasibility of our BCI approach. Nonetheless, we measured the data from extensi ve number of sessions to support the potential of the present approach. Another important question is that whether the A OMI task is ef fectiv e for effecti ve neuro-rehabilitation (e.g. improved cortical re-organization or neuroplasticity). W e focus to study these question in our future study . Due to the possible application of our study , we put higher priority in the detection of MI tasks in a direct (non-interpretive) way to provide natural BCI outputs. • W e presented a different classification approach which is robust against the major BCI classification prob- lems. Because we have optimized the classifiers in the offline settings from vast data from as many sessions as possible, they performed robust throughout online experiments. There were only fe w exceptions of lower classification results. T o date, most NIRS-BCI studies used standard classifiers such as SVMs, LDA, HMM, or ANNs from T able 3. This study presents another classifier which achiev es higher accuracies by using a multiple learning strate gy . Howe ver , it is not appropriate to compare and judge the research results in terms of classification accuracy , because many factors influence the difficulty and the accuracy in a particular BCI study . For instance, such factors include the type of BCI paradigm and whether the NIRS signal characteristics used are ra w , preprocessed, or transformed. In addition, the type of the system used to acquire the NIRS signals is a factor . In our study , the signal sampling frequency was 14.28 Hz, whereas other NIRS-BCIs use signals with sampling rates from 2 Hz to 10 Hz. The lower the sampling frequency , the lower the signal quality and harder the extraction of the true neural signals from background noise. One known limitation of the present NIRS-BCI approach is the delay in operating a haptic de vice because of the 11 intrinsic latency of the brain hemodynamics. With an EEG- BCI system, an operation can be performed over a few milliseconds. W e plan to experiment two possible ways of ov ercoming the slo wness of the NIRS-BCI that we aim to research in the next step. The first is based on exploring fast hemodynamic responses as was done by Cui et al. (2010) . The other is to dev elop a hybrid BCI paradigm that combines EEG and NIRS signals for rapid detection of mental state as in (Fazli et al., 2012). In addition, we plan to extensi vely study the influence of the v arious feedback types (visual, auditory , or haptic) and their ef fects on the improvement of the overall classification accuracies. In general, the NIRS-BCI may not be suitable for a fast translation of mental intent, howe ver we believ e that it has potential for a neurorehabilitation and motor learning of post-stroke patients that in volv es slow operations. R E F E R E N C E S [1] G. Pfurtscheller, G. Muller-Putz, R. Scherer, and C. Neuper , “Reha- bilitation with brain-computer interface systems, ” Computer , vol. 41, no. 10, pp. 58–65, 2008. [2] M. Grosse-W entrup, D. Mattia, and K. Oweiss, “Using brain- computer interfaces to induce neural plasticity and restore function, ” J. Neural Eng. , vol. 8, no. 2, p. 025004, 2011. [3] S. Coyle, T . W ard, C. Markham, and G. McDarby , “On the suitability of near-infrared (NIR) systems for next-generation brain-computer interfaces, ” Physiol. Meas. , vol. 25, pp. 815–822, 2004. [4] E. Coffe y , A. Brouwer, E. W ilschut, and B. Jan, “Brain-machine interfaces in space: Using spontaneous rather than intentionally generated brain signals, ” Acta Astr onautica , vol. 67, no. 1, pp. 1–11, 2010. [5] F . Matthews, B. Pearlmutter , T . W ard, C. Soraghan, and C. Markham, “Hemodynamics for brain-computer interfaces, ” IEEE Signal Pr o- cessing Magazine , vol. 25, pp. 87–94, 2009. [6] Q. Zhang, G. Strangmana, and G. Ganis, “ Adapti ve filtering to reduce global interference in non-in v asiv e NIRS measures of brain activ ation: How well and when does it work?” Neur oimage , vol. 45, no. 3, pp. 788–94, 2009. [7] J. An, S.H. Lee, S.H. Jin, B. Abibullaev , “The beginning of neuro- haptics: Controlling cognitive interaction via brain haptic interface, ” Brain-Computer Interface (BCI), 2013 International W inter W ork- shop on , pp. 103–106, 18-20 Feb . 2013. [8] B. Abibullaev , J. An, S.H. Jin, S.H. Lee,J.I. Moon, “Minimizing inter-subject variability in fNIRS-based brain-computer interfaces via multiple-kernel support vector learning, ” Med Eng Phys , vol. 35, pp. 1811–8, 2013. [9] B. Abibullae v ,J. An,S.H. Jin,J.I Moon, “Classification of brain hemo- dynamic signals arising from visual action observ ation tasks for brain-computer interfaces: A functional near-infrared spectroscopy study , ” Measurement , vol. 49, pp. 320–328, 2014. [10] A. Nijholt and D. T an, “Brain-computer interfacing for intelligent systems, ” Intelligent Systems, IEEE , vol. 23, no. 3, pp. 72–79, 2008. [11] L. Marchal-Crespo and D. J. Reinkensmeyer , “Revie w of control strategies for robotic mov ement training after neurologic injury , ” Journal of NeuroEngineering and Rehabilitation , vol. 6, no. 20, pp. 1–15, 2009. [12] R. Krepki, G. Curio, B. Blankertz, and K.-R. Müller , “Berlin brain- computer interface – the hci communication channel for discovery , ” International Journal of Human-Computer Studies , vol. 65, no. 5, pp. 460 – 477, 2007. [13] R. Sitaram, H. Zhang, C. Guan, M. Thulasidas, Y . Hoshi, A. Ishikawa, K. Shimizu, and N. Birbaumer , “T emporal classification of multichannel near-infrared spectroscopy signals of motor imagery for dev eloping a brain-computer interface, ” Neuroimag e , vol. 34, pp. 1416–27, 2007. [14] R. Dickstein and J. E. Deutsch, “Motor imagery in physical therapy practice, ” Physical Therapy , vol. 87, no. 7, pp. 942–953, July 2007. [15] K. Jerbi, J. V idal, J. Mattout, E. Maby , F . Lecaignard, T . Ossando, C. Hamamé, S. Dalal, R. Bouet, and J.-P . Lachaux, “Inferring hand movement kinematics from the MEG, EEG and intracranial EEG: From brain-machine interfaces to moto rehabilitation, ” IRBM , vol. 32, no. 1, pp. 8–18, 2009. [16] C. J. Bohil, B. Alicea, and F . A. Biocca, “V irtual reality in neuro- science research and therapy , ” Nature Revie ws Neur oscience , vol. 12, no. 12, pp. 752–762, Dec. 2011. [17] B. Lance, S. Kerick, A. Ries, K. Oie, and K. McDowell, “Brain- computer interface technologies in the coming decades, ” Pr oceedings of the IEEE , vol. 100, no. Special Centennial Issue, pp. 1585–1599, May 2012. [18] S. Machado, F . Araujo, F . Paes, B. V elasques, M. Cunha, H. Budde, L. Basile, R. Anghinah, O. Arias-Carrion, M. Cagy , R. Piedade, T . Graaf, A. Sack, and P . Ribeiro, “EEG-based brain-computer interfaces: An overvie w , ” Reviews in the Neurosciences , vol. 21, no. 6, pp. 451–468, Oct. 2010. [19] J. J. Shih, D. J. Krusienski, and J. R. W olpaw , “Brain-computer interfaces in medicine, ” Mayo Clinic Proceedings , vol. 87, no. 3, pp. 268 – 279, 2012. [20] D. Mattia, F . Pichiorri, M. Molinari, and R. Rupp, “Brain computer interface for hand motor function restoration and rehabilitation, ” in T owards Practical Brain-Computer Interfaces , ser . Biological and Medical Physics, Biomedical Engineering, B. Z. Allison, S. Dunne, R. Leeb, J. Del R. Millà ˛ an, and A. Nijholt, Eds. Springer Berlin Heidelberg, 2013, pp. 131–153. [21] O. Bai, P . Lin, D. Huang, D.-Y . Fei, and M. K. Floeter , “T owards a user-friendly brain-computer interface: initial tests in ALS and PLS patients, ” Clinical Neur ophysiology: Of ficial Journal of the International F ederation of Clinical Neurophysiolo gy , vol. 121, no. 8, p. 1293, 2010. [22] E. Buch, C. W eber , L. G. Cohen, C. Braun, M. A. Dimyan, T . Ard, J. Mellinger, A. Caria, S. Soekadar, A. Fourkas, and N. Birbaumer, “Think to move: a neuromagnetic brain-computer interface (BCI) system for chronic stroke, ” Str oke , vol. 39, no. 3, pp. 910–917, 2008. [23] M. Palankar , K. De Laurentis, R. Alqasemi, E. V eras, R. Dubey , Y . Arbel, and E. Donchin, “Control of a 9-dof wheelchair-mounted robotic arm system using a P300 brain computer interface: Initial experiments, ” in Robotics and Biomimetics, 2008. R OBIO 2008. IEEE International Conference on , 2009, pp. 348–353. [24] A. S. Merians, E. T unik, and S. V . Adamovich, “V irtual reality to maximize function for hand and arm rehabilitation: exploration of neural mechanisms, ” Studies in Health T echnology and Informatics , vol. 145, pp. 109–125, 2009. [25] I. K. Niazi, N. Jiang, O. Tiber ghien, J. Nielsen, K. Dremstrup, and D. Farina, “Detection of movement intention from single-trial movement-related cortical potentials, ” Journal of Neural Engineer- ing , vol. 8, no. 6, p. 066009, 2011. [26] A. Ramos-Murguialday , M. SchÃijrholz, V . Caggiano, M. W ild- gruber , A. Caria, E. M. Hammer , S. Halder , and N. Birbaumer, “Proprioceptiv e feedback and brain computer interface (BCI) based neuroprostheses, ” PLoS ONE , vol. 7, no. 10, p. e47048, 10 2012. [27] A. Murguialday , E. Soares, and N. Birbaumer, “Upper limb emg artifact rejection in motor sensitive bcis, ” in Engineering in Medicine and Biology Society (EMBC), 2010 Annual International Conference of the IEEE , 2010, pp. 1–6. [28] K. K. Ang, C. Guan, C. W ang, K. S. Phua, A. T an, and Z. Y . Chin, “Calibrating eeg-based motor imagery brain-computer interface from passiv e movement, ” in Engineering in Medicine and Biology Soci- ety ,EMBC, 2011 Annual International Confer ence of the IEEE , 2011, pp. 4199–4202. [29] T . Meyer, J. Peters, D. Brtz, T . Zander , B. Scholkopf, S. Soekadar , and M. Grosse-W entrup, “ A brain-robot interface for studying motor learning after stroke, ” in Intelligent Robots and Systems (IROS), 2012 IEEE/RSJ International Conference on , 2012, pp. 4078–4083. [30] R. Zimmermann, L. Marchal-Crespo, J. Edelmann, O. Lambercy , M.- C. Fluet, R. Riener , M. W olf, R. Gassert et al. , “Detection of motor execution using a hybrid fNIRS-biosignal BCI: a feasibility study , ” Journal of Neuroengineering and Rehabilitation , vol. 10, no. 1, p. 4, 2013. [31] M. Gomez-Rodriguez, J. Peters, J. Hill, B. Schölkopf, A. Gharabaghi, and M. Grosse-W entrup, “Closing the sensorimotor loop: haptic feedback facilitates decoding of motor imagery , ” J. Neural Eng. , vol. 8, no. 3, p. 036005, 2011. [32] A. Chatterjee, V . Aggarwal, A. Ramos, S. Acharya, and N. Thakor , “ A brain-computer interface with vibrotactile biofeedback for haptic information, ” J. Neur oeng. Rehab . , vol. 4, no. 1, p. 40, 2007. 12 [33] E. Gratton, V . T oronov , U. W olf, M. W olf, and A. W ebb, “Mea- surement of brain activity by near-infrared light, ” J . Biomed. Opt. , vol. 10, no. 1, p. 011008, 2005. [34] M. Juepntner and C. W iller, “Does measurements of regional cere- bral blood flow reflects synaptic activity? - implications for PET and fMRI, ” Neur oImage , vol. 2, pp. 148–156, 1995. [35] J. Jarvelainen, M. Schurmann, and R. Hari, “ Activ ation of the human primary motor cortex during observation of tool use, ” NeuroImag e , vol. 23, pp. 187–192, 2004. [36] D. Tkach, J. Reimer, and N. Hatsopoulos, “Congruent activity during action and action observ ation in motor cortex, ” J of Neur osci , vol. 27, no. 48, pp. 13 241–13 250, 2007. [37] J. V irtanen, T . Noponen, and P . Merilainen, “Comparison of princi- pal and independent component analysis in removing extracerebral interference from near-infrared spectroscopy signals, ” J Biomed Opt , vol. 14, no. 5, p. 054032, 2009. [38] M. Izzetoglu, A. Dev araj, A. Bunce, and B. Onaral, “Motion artifact cancellation in NIR spectroscopy using wiener filtering, ” IEEE T ransactions on Biomedical Engineering , vol. 52, pp. 934–38, 2005. [39] K. Jang, S.T ak, J. Jung, Y . Jeong, and J. Y e, “W avelet minimum description length detrending for near-infrared spectroscopy , ” J. Biomed. Opt. , vol. 14, pp. 034 004–13, 2009. [40] B. Abibullaev and J. An, “Classification of frontal cortex haemo- dynamic responses during cognitive tasks using wavelet transforms and machine learning algorithms, ” Med. Eng. Phys. , vol. 34, no. 10, pp. 1394–410, 2012. [41] L. Lal, M. Schroder, T . Hinterberger , J. W eston, M. Bogdan, N. Bir- baumer , and B. Scholkopf, “Support vector channel selection in BCI, ” IEEE T ransactions on Biomedical Engineering , vol. 51, no. 6, pp. 1003–1010, 2009. [42] M. Schroeter, M. Bucheler , K. Muller, K. Uludag, H. Obrig, and G. Lohmann, “T owards a standard analysis for functional near- infrared imaging, ” NeuroIma ge , vol. 21, pp. 283–90, 2004. [43] M. Schroder, T . Lal, T . Hinterberger , M. Bogdan, N. Hill, N. Bir- baumer , W . Rosenstiel, and B. Scholkopf, “Robust EEG channel selection across subjects for brain-computer interfaces, ” EURASIP J. Appl. Signal Process. , vol. 19, pp. 3103–3112, 2005. [44] I. Guyon, J. W eston, S. Barnhill, and V . V apnik, “Gene selection for cancer classification using support vector machines, ” Mach. Learn. , vol. 4, no. 1, pp. 389–422, 2002. [45] B. Scholkopf and A. Smola, Learning with Kernels, Support V ector Machines, Regularization, Optimization,and Beyond . MIT Press, Cambridge, 2002. [46] A. Bradley , “The use of the area under the ROC curve in the ev aluation of machine learning algorithms, ” P attern Recogn. , vol. 30, pp. 1145–1159, 2009. [47] M. Gerven, J. Farquhar , R. Schaefer, R. Vlek, J. Geuze, A. Nijholt, N. Ramsey , P . Haselager , L. V uurpijl, S. Gielen, and P . Desain, “The brain-computer interface cycle, ” J. of Neural. Eng. , vol. 6, no. 4, pp. 1–9, 2009. [48] B. Blankertz, F . Losch, M. Krauledat, G. Dornhege, G. Curio, and K. Muller, “The Berlin brain-computer interface: Accurate perfor- mance from first-session in BCI-naiv e subjects, ” IEEE T ransactions on Biomedical Engineering , vol. 55, pp. 2452–2462, 2008. [49] A. Abdelnour and T . Huppert, “Real-time imaging of human brain function by near-infrared spectroscopy using an adaptiv e general linear model, ” NeuroIma ge , vol. 46, pp. 133–143, 2009. [50] S. Coyle, T . W ard, and C. Markham, “Physiological noise in near- infrared spectroscopy: implications for optical brain computer inter- facing, ” in 26th Annual Int. Conf. of the IEEE Eng. in Med. and Biol. Soc. , vol. 2, 2004, pp. 4540–4543. [51] K. Utsugi, A. Obata, H. Sato, T . Katsura, K. Sagara, A. Maki, and H. K oizumi, “Dev elopment of an optical brain-machine interface, ” in Proc IEEE EMBS L yon Fr ance , 2007, pp. 5338–5341. [52] X. Cui, S. Bray , and A. Reiss, “Speeded near infrared spectroscopy response detection, ” PLoS ONE , vol. 5, no. 11, p. e15474, 2010. [53] S. Fazli, J. Mehnert, J. Steinbrink, G. Curio, A. V illringer, K. Muller , and B. Blankertz, “Enhanced performance by a hybrid NIRS-EEG brain computer interface, ” NeuroIma ge , vol. 59, no. 1, p. 519:29, 2012. [54] A. Sassaroli, F . Zheng, L. Hirshfield, A. Girouard, E. Solov ey , R. Jacob, and S. Fantini, “Discrimination of mental workload levels in human subjects with functional near-infrared spectroscopy , ” J. Innov . Opt. Health. Sci. , vol. 1, no. 2, pp. 227–37, 2008. [55] K. T ai and T . Chau, “Single-trial classification of NIRS signals during emotional induction tasks: T owards a corporeal machine interface, ” J. Neuroeng. Rehabil. , vol. 9, pp. 9–39, 2009. [56] Q. Truong and N. Masahiro, “Functional near infrared spectroscope for cognition brain tasks by wa velets analysis and neural networks, ” Int. J. of. Biomed. Med. Sci. , vol. 4, no. 1, pp. 28–33, 2009. [57] S. Coyle, T . W ard, and C. Markham, “Brain-computer interface using a simplified functional near -infrared spectroscopy system, ” J. of Neural Eng , vol. 4, pp. 219–26, 2007.
Original Paper
Loading high-quality paper...
Comments & Academic Discussion
Loading comments...
Leave a Comment