On the Reproducibility of TCGA Ovarian Cancer MicroRNA Profiles
Dysregulated microRNA (miRNA) expression is a well-established feature of human cancer. However, the role of specific miRNAs in determining cancer outcomes remains unclear. Using Level 3 expression data from the Cancer Genome Atlas (TCGA), we identif…
Authors: Ying-Wooi Wan, Claire M. Mach, Genevera Allen
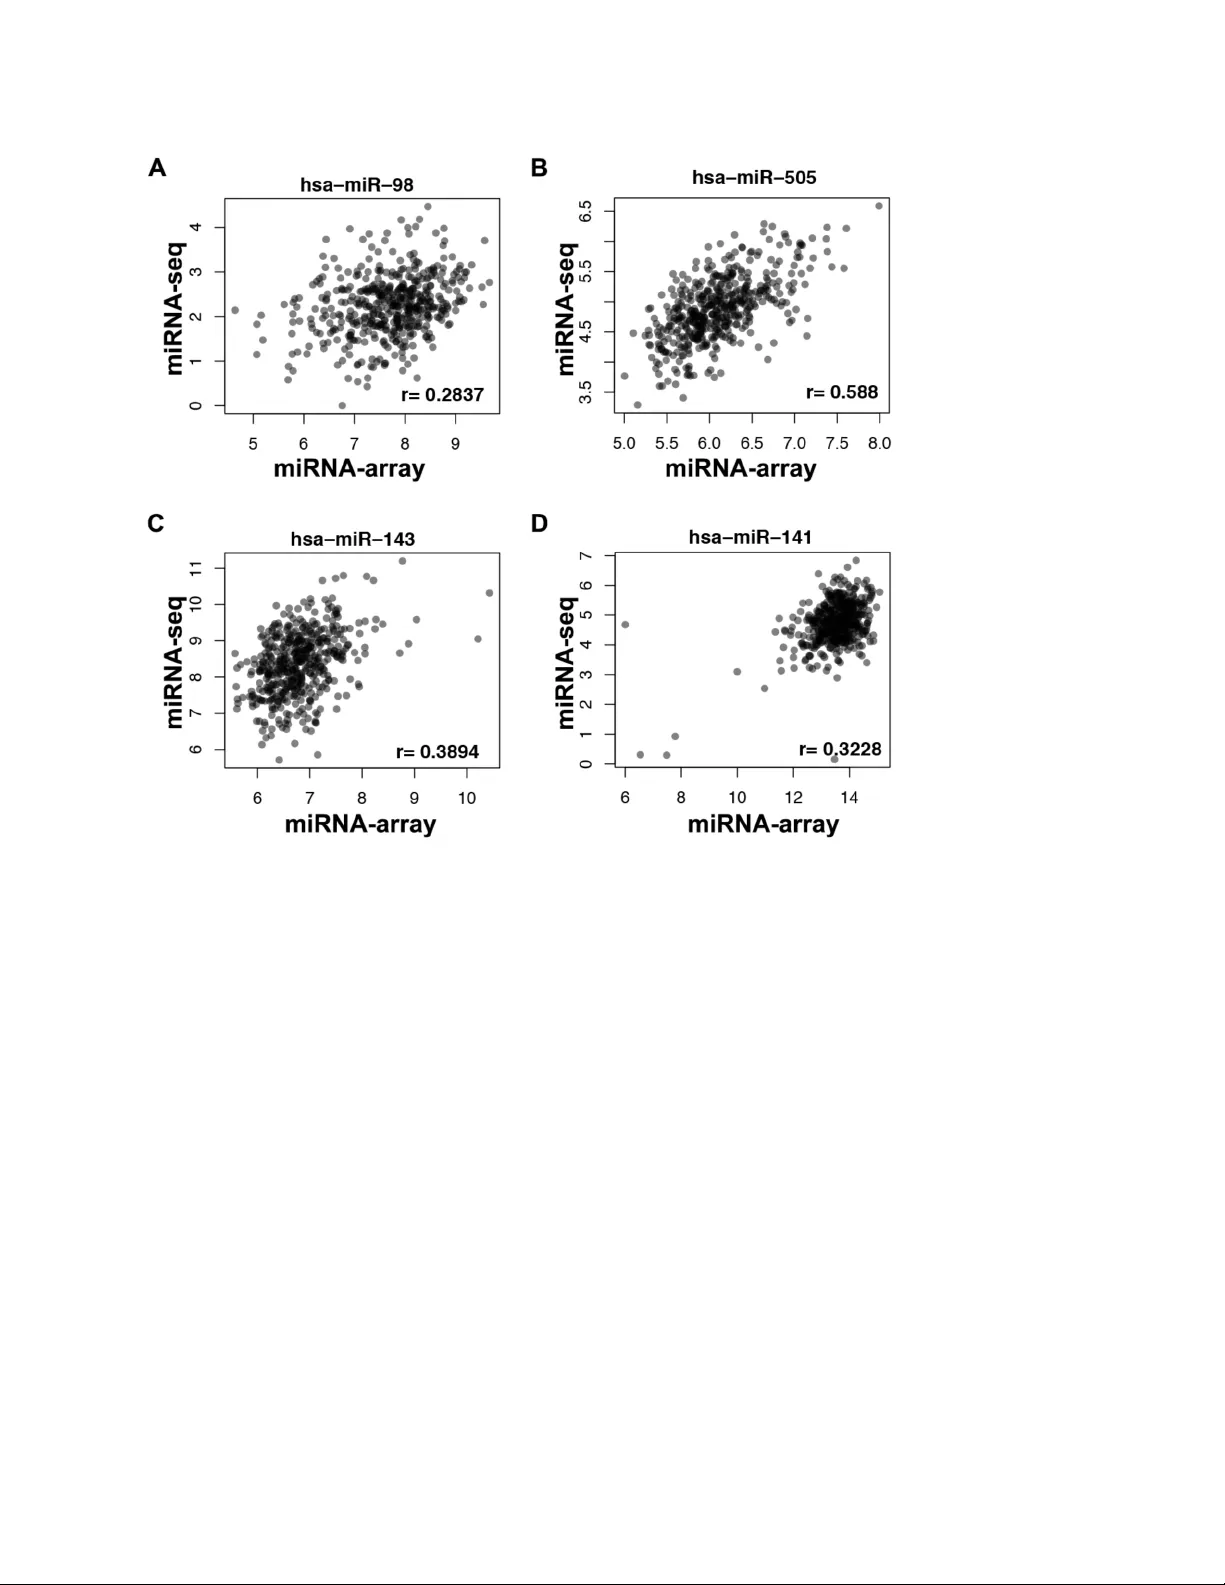
!" " On the Repr oducibi lit y of TCGA Ov arian Cancer Micr oRNA Pr ofil es Ying - Wooi Wan 1,2,4 , C laire M. Mach 2,3 , G eneve ra I. Allen 1,7,8 , M atthew L . A nderso n 2,4,5 *, Zhandong Liu 1,5,6,7 * 1 Depart ments of Pediat rics 2 Obstet ric s and Gynecolo gy and 4 Patholog y and Immunology, 5 Dan L. D uncan Cancer Center, 6 Computat ional and Integrat ive Biomedic al Research (CIBR) Center, Baylor College of Medi cine. 3 Colle ge of Pharmac y, Uni versi ty of Ho uston 7 Neurol ogical Resea rch I nsti tute , Tex as Chi ldren’ s Hos pital 8 Depart ment of St atist ics and El ectrical & Computer Engineeri ng , Rice U niversity * Correspon dence : One Bay lor Plaz a, BC M320 Phone: 8 32 - 824 - 8788 FAX: 713 - 789 - 4855 Email: Zhandonl@bcm.edu or matthew@bcm.edu #" " ABSTRACT Dysregu lated mi cro R NA ( mi RNA ) expres sion is a well - establ ished feature of human cancer. H owever, the role of specific miRNAs in determining cancer o utcomes remains unclear. Using Lev el 3 expression data from the Cancer Genome Atlas (T CG A), we iden tified 61 miRNAs that are associated with overall survival in 469 ovarian cancers profiled by microa rra y (p<0.01) . We also i dentif ied 12 mi RNAs that are associat ed with survi val when miRNA s w ere profiled in the same specimens using Next Generation Sequ encing (miRNA - Seq) (p<0.01) . Surpri singly, only 1 miRNA tr ansc rip t is associa ted with ovari an cancer survival in both datasets. Our analyses indicate that t his discrepancy is due to the fact that miRNA levels repo rted by the two platfo rms correlate poorly , even after corre cting for pote ntial issues inherent to sign al detection algorithms. F urther inves tigation is warrante d . $" " INTR ODU CTION Micr oRNAs (miRNAs) are endogenou s RNA tra ns cripts that regulate diverse patterns of gene expression. 1 Most h uman miRNAs are trans cribed as long precursors known as pri - miRNAs . Start ing in the nucleus , p ri - miRNAs und ergo a seri es of proce ssi ng even ts th at ultimatel y result in the cytop lasm ic re lease of matur e tr anscr ipt s ~ 22 nucleotides in length. M ature miRNAs catalyze translational inhibiti on by directly bindi ng to messe nger RNAs ( mRNAs ) and promo ting th eir d egrada tion . 2 R ecent data also ind icate that miR NAs can inh ibit translatio n inde pend ent of th eir ability to indu ce mR NA d egrad ation. P atterns of miRNA expression have now been extensively profiled in many dif feren t hum an tissues. It i s now clear that dysregulated miRNA exp re ssion is a f eature of many dif fer ent cancers, including carcinomas of the breast, ov ary and lung. 3-5 However, d etermin ing the mechan isms by whi ch individual miRNA s contribute to cancer outcome s rem ains a key challenge for biologists h oping to exploit the ir power. Recen tly, the Cancer Genome Atla s Consort ium (TCGA) report ed that ovarian cancer s cluster i nto dist inct molecular subtypes based on their pat terns of gene and micr oRNA expression . 6 However, we have d isco vered an al arming lack of consis tency be tween the m icro RNA ( mi RNA) expres sion prof ile s initially used by the TCGA and a subsequent profile of miRNA expression generated by this group for the same ovarian cancer specimens using miRNA - Seq. As these observations challenge the validity of the un derlying data, the y also c halleng e scientific discove ries base d on this data . RESULTS To deli neate miRNAs associated with ovar ian canc er pat ient survival , we perfo rmed a univariate Cox regression analysis using L evel 3 TCGA m iRNA data for 469 ovarian cancer s profiled using Agilent microarray technology . W e found that 61 mature miRNAs are significantly associated with ovarian cancer survi val (p<0. 0 1 ) (Figure 1A) . Of th e se, miR - 505 , miR - 652 and miR - 551b * demonstrate the most robust associations. H azard ratios (HR ) calculated fo r these %" " miRNAs were - 1.73 , - 1.8 , a nd 9.3 , respec tively , ind icating that e ach miRNA potentially play s an impo rtant role in dete rminin g ovarian cancer sur vival. To validate these observat ions, we next inter rogate d a sec ond datas et o f miRNA expression generated for the sam e ovarian cancer specimens using N ext G eneration S equencing (miRN A - Seq) . The TCG A ovaria n cancer project is unique in tha t mi RNA expression has been profil ed using both miRNA arr ay and miRN A - Seq. U se of these techn ically dis tinct platfo rms create s a unique opportunity to vali date discoveries made using one dataset against the othe r. Idea lly, the resu lts obtaine d sh ould correlate tightly . Using Cox Proporti onal Hazards analysis, we fou nd that 12 miRNA transc ripts are associated with survival when miRNAs were profi led in ov arian cancers using miRNA - Seq (Figure 1B) . However, the hazard rati o s estimated for the 12 miRNAs iden tified fro m m iRNA - Seq data are all very close to 1.0 . Surprisingl y , o nly miR - 652 is associated with survival in both the m iRNA - Seq and microarr ay datasets. To correct for multipl e hypothesis testing , we adjuste d our C ox model p - values using Benjamini – Hochbe rg procedure . 7 After completing these analyses, no miRNA s are correlated w ith survival in both dataset s when the fals e discov ery rate was s et at 10% . To elucidat e potential causes for this unexpected discrepancy, we examined the reproducib ility o f miRNA e xpression between th e two TCGA files th at desc ribe this da ta. Pearson correlat ion coefficien ts (r) were calcul ated for each of the 359 mature human miRNAs for which Level 3 expression data was availabl e in both the miRNA - Seq and m icroar ray databases . We fou nd that corr ela ti on coeff ic ien ts for levels of indiv idual miR NA s rep orted b y each technique varied w idely. For example, miR - 505 is the miRNA most robus tly associated with patien t outcome in our analyses of the miRNA ar ray data (HR = - 1.7 , p< 9e - 5) . H oweve r, when assessed using sequencing data, the hazard ratio for m ir - 50 5 was 0.998 (p= 0.03) . L evels of miR - 505 measured by miRNA - array and miRNA -S eq da ta correlated only m odestly (r = 0.59 ) (Figure 2B) . Discr epanci es were also observe d in a number of other miRNAs that hav e be en previously implicated in ovarian cancer , such as m iR - 143 . 8 T he correlati on coefficient for miR - &" " 143 in our analyses w as 0.39 (Figure 2C ) . Another miRNA well - studied in ova rian ca ncer is miR - 141 , whic h ha s b een previou sly re ported to ta rget p 38 α and modu late the ox idative stress r esponse. 9, 10 However, the correlati on between lev els of m iR - 141 in TCGA mi cro a rray and miRNA -S eq expression data is on l y 0 .32 (Figure 2D ) . Overall , w e found that co rrelation coefficients for ~ 72 % of miRNAs prof ile d in both datas ets we re ' 0.5 (Figure 3A , 3C ) , indic ating poor reproducibilit y . In co ntrast, only 2 2 % of the mRNAs measure d by Agil ent micr oarr ay and Illumina H iSeq usin g th e same o varian can cer spec imens correlate poorly ( r ' 0.5 ; Figure 3B , 3C ). Thus, the disc repan cy we re port he re appears to be limited to th e TCGA miRNA dat a set . One potenti al cause for poor re produc ib ility may be the sig nal dete ction a lgorithm used to report levels o f miRNA expression . Level 3 TCGA miRNA data are reported in two formats. The first, labe led as a “ Q uantificati on Data, " reports levels for individu al human m iRNA s . However, o ne of the advantages of miRNA - Seq is that tra nscripts retrie ved by this techn ique can be precisely mapped . A second file, la beled as “ Iso form D ata , " has also been released by the TCGA . This file repo rts read counts for transc ripts a ccording to their geno mic locatio n. As part of this file, transc ripts are identified as e ither ma ture miRNA, miRNA* (3p a rms of hu man miR NAs ) , ste m - loo p trans cript or precursor. Whil e work ing throu gh thi s data , we lear ned that miRNA levels reporte d in the TC GA qua ntificatio n file inc lude read coun ts for miRNA precursor s as well as mat ure miRNAs. Because m iRNA precursor s typicall y lack biologi c activity , inclusio n of precursors with counts for mature miRNAs could confound survival anal yses. To address this issue , w e retriev ed read counts for mature miRNA s only from the isofor m data fil e and repeated our analyses . How ever, the p roportio n of miR NA c orrelation coe fficients ' 0.5 remained as high as 71 % des pit e t he use of t his more preci sely defi ned data . A second possib le exp lanation fo r th e discre pancy w e obser ved might be that co rrelations between measures of m iRNA expression depend on the frequency with which individual miRNA transcrip ts are ex presse d. If so, infre quen tly expre ss ed miRNAs might be repo rt ed by one or (" " both of the platform s used to profil e miRNA expression randomly or inaccurately . T o explore this hypothesis , we re - calculat ed correlati on coefficient s for each miRNA identified by both platforms after exclud ing any transcript in the m iR NA - Seq dataset with a read count less than 5. T his reduced the nu mber o f distinct miRNAs avai lab le for ana lysis in the m iRN A - Seq data fil e from 705 to 380 . However, t he proportion of miRNAs with correlati on coefficients ' 0.5 also dec reased from 72 % to 56 %. Similarly r emoving poorly expressed tra nscripts from the pool of mRNAs profi led by Illumina HiSeq reduces the proportion of mR NAs whose correlation coefficients ' 0.5 from 22% to 20%. These observati on s indicate that pro blems dete cting infrequ ently expres sed m iRN A m ay im pact the ab ility or one o r both platfo rms to reliab ly rep ort miRNA expre ssi on. However , the fact that m ore th an half of miRN A transcr ipts still had correlation coefficients ' 0.5 even after correcting for this issue indicates that poorly expressed transcrip ts are not solely responsible for the discordant patterns of miRNA expression reported by the t wo platforms. DISCUSSION Much to our surpr ise , our analyses indicate that the microRNA s as sociated wit h survival in ovarian cancer depend highly on whet her specimens w ere profiled by the TCGA using micr oarr ay or miRNA - Seq . Our analyses indi cate that this discr epancy exists becaus e miRN A - Seq and microarr ay have generated very different profil es of miRNA expression , even though the data is based on the sam e ovari an cancer specimens . We do not currently have a c lear explanation for why miRNA expres sion profil es reported by the TCGA are discordant . However, u nde r standing this discrepancy will ultima tely be impo rtant fo r iden tifying w hich m iRN As if a ny are impo rtant for determining ovarian cancer outcomes. A variety of DNA microarr ay technologi es have been previousl y validate d by investigat ors examining within platf orm and cross - platform reproducibili ty. 11 - 13 Spearman correlat ion )" " coefficients report ed in these studies range from 0 .59 to 0.94 with a mean of 0. 82. These results are similar to what we have observed for correlations between patterns of gene expression profiled using microarray and Illumina HiSeq platforms by the TCG A . B oth miRNA - Seq and micr oarr ay technol ogie s are asso ciated with multiple technical limitations that might a ccount for the diffe rences we have observ ed . For example, cross - hybridi zation is a well - re cognized iss ue that can reduce signal specificity when profil ing RNA trans cript s by microar ray . 14 However, i t seem s unlikely th at c ross - hybridization can fully explain th e discrepancy we observed , a s th e number of transcripts correlated with survival by array is greater than the number associated with survi val by m iRNA - Seq. One alternat e explanat ion might be that the signal extractio n algorithm used to an alyze miR NA - Seq data does not accurately report miRNA leve ls . In general, miRNA - Seq allows for precis e transc ript mapping with m uch greater confidence . T he signal extraction algorithm currently used by the TCGA to re port m iRNA levels in cludes read counts for both a m ature miRNA and its corresponding precursor . Precursors account for fewer than 1% of th e total miR NA coun ts in the TCG A isoform file, likely re flecting the u se of size - fractiona ted total R NA to prep are sm all R NA libra ries for miR NA - Seq. 5 Ou r an alyses indicate that their inclu sion has little bearin g on which miRNA s are associated with ovarian cancer survival . T hese observations underscore the urgent need for well - defined algorithms for processing signals generated by m iRNA - Seq and transcri ption al profil ing platfor ms. O ur understanding is that the sam e analy ses have been performed by TC GA for other cancers , in cluding colon, breast and lung . 15 - 17 Because m iR NA exp ressio n in the se other ca ncers h as not been profiled by microarray , it is no t possible to rep eat o ur an alyses to de termine whether t he disc repancy w e report is observed in other cancers . Ulti mately , consistent and reliable genomic data is criti cal for constructing testable hypotheses and achieving the full potential of the TCG A . O ur observations identify an important hazard of which investigat ors should be aware as they utilize the TCGA miRNA data to study *" " ovarian cancer . This hazard underscores the need to validate observations made with one or both of TCGA miRNA dataset s. Over the long term, r esolution of t h is discrepancy will be impo rtant for determin ing the most effec ti ve platfo rm and signal extraction algorithms for profili ng miRNA expression as part of large sc ale ge nomic profiling efforts . MATERIA LS AND METHODS Gene and microRNA Express ion Dat a. Level 3 data documenting patterns of gene e xpressi on for 296 ovarian cancer specimens profiled using Agilent G4502A array s and Ill umina HiSeq were downloaded from the TCGA data portal . Leve l 3 micr oRNA expres sion data were also retrieved fo r 469 ovarian cancer specimens profiled using the Agilent 4X15k array and miRNA - Seq. Level 3 miRN A data prof il ed by miRNA - Seq were retrieved from bot h the miRNA quantifi cation and isofor m file s avail able at the TCGA data portal along wi th metafiles annotating e ach dataset. Permission to access all data was obtained from the D ata Access Committee for the Nationa l Ce nter for Biote chnolo gy Informatio n G enotyp es a nd Phenoty pes Databa se (dbGAP ) at the Nati onal Inst itutes of Health. Survival Analyse s. Coded patient su rvival data was extracted from the T CGA clinical inform ation file . A Cox P rop ortional H azards model was used to estimate association between levels of individ ual m iRNA s . P atient survival was calculated as time in m onths elapsed from date of diagno si s until date of last contac t. Statist ical A nalyse s. Spearman’s rank correlation coe fficient s, histogram s , and the em pirical cumulative distribution w ere computed and plotted fo r e ach m iRNA and gen e using r . Sequencing data w ere log tra nsform ed for plo tting. Both dir ect read counts and counts normalized according to milli ons of miRN As were examined as part of our analyse s. All analyses were performed using both raw and normalized read counts reported as part of the TCGA miRNA - Seq dataset s. ACKNOWLEDGEMENTS +" " The authors gratef ully acknowledge communication from David Wheeler, Rehan Akba n, Gordon Robert son and Andy Chu re gardi ng TCGA mi RNA dat a anal ysis algo rith ms. REFERENCES !" ,-." /0" 1 " 2345678. "90":0" /3;"<3"78-=;" ;>3"?5@6A" <37>5=B6<6"8C"D3=3 "E3D-45;B 8="F@"3EE ."W0"WB7E8GHI"5=J"4-=D" 75=73E0" +,$)-$.)/01# '02)3"&(0'#)"4 )5$26%60$ " 352 ." #%%( K #%%*."J8BA!M0!M&(SHX9W7BFEM&!#M!" N#MM&O0 " %" Y>5=D."/0 ) $7)'#8 " BF B;" >BD> "CE 3[-3 =7@" D3=8-< 5="75= 73 E0" 9("%) -'7#):% '2);%6 )<);): " 103 ."+!$( K +!%!"N#MM(O0 " &" \E3BD>;8=." \0"90 ) $7)'# 8 " W8437 -45 E"Q E8C B4B =D" -=7 8]3E 6"5 "Q& $ K 56687B5;3J"E843"C8E " 3 "Q E8 4BC3 E5 ;B8 = "8 C"63 E8 - 6"8 ] 5 EB5= "7 5 E7B= 8 < 56"5=J "8; > 3E "75 = 73 E6 0" *'0%$() =$> " 70 ." !+M( K !+!&."J8BAMMM* K &%)#0\IH K M+ K $*)&"PQBBR " !M0!!&*SMMM* K &%)#0\IH K M+ K $*)&"N#M!MO0 " (" ^=;3DE5; 3J "D 3 = 8 < B7"5=54@6 3 6"8 C"8 ]5EB5="7 5E 7B= 8 < 50" -'7&($ " 474 ."(M+ K (!&." J8BA!M0!M$*S =5;-E3!M!(("N# M!!O0 " )" 23=T5F3ED ."_0" \8=;E84 4B=D" ;>3"a54 63"UB 678]3E@ "G5;3A "I"VE57 ;B754 "5=J"V8 ?3EC-4" IQQE857>";8" W-4;BQ43"b3 6;B=D0" ?"&(0'#)"4)7,$)="@'#);7'76>76%'#);" %6$ 7@8);$(6$ >)A)B! $ 7," 2 "#" 16%' #C " 57 ."#*+ K $MM."J8BA!M0#$M)S#$%(!M!"N!++&O0 " *" W5E7 >B=B ." L0 ) $7)'#8 " I6687B5;B8=" F3;?33 ="3" 6-E]B]54"8C" Q5;B3=;6"?B;>"6 ;5D3"^" 3QB;>34B54"8]5E B5="75=73EA"5" E3;E86Q37;B]3"6;-J@" 8C";?8"B=J3Q3=J3=;";-<8-E";B 66-3"784437;B8=60" D'0%$7)E0%"# " 12 ."#)$ K #*&."J8BA!M0 !M!(SL!%)M K #M%&N!!O)MM!# K #"N#M!!O0 " +" W5;3 367- ."2 0 ) $7)'#8 " 3 " W363= 7>@< 54" L-F; @Q3" B= "L3 E8-6 " d]5EB 5="\5= 73E0" *'0%$()*$## " 23 ."!*( K !++." J8BA!M0!M!(S T077E0#M! #0!#0M#M"N# M!$O0 " !! " L5;8."a0." b6-7>B@5."L0. "b3E565?5."e0"1"b6 -TB<8;8.":0"^=;E 5 K Q45;C8E<"E3Q35;5FB 4B;@"5=J" B=;3E K Q45;C8E<"78=84 8D@0" 9# ";)"0$ " 4 ."3&& % M ." J8BA! M0!$)!ST8-E =540Q8=30MMM&&%M"N#MM+O0 " !# " _5-c."\0"/0. "G8?5= K \5EE844." I0."L;3 5J."90" U0"1",B44B 5<6."I0"\E86 6 K Q45;C8E<"5=54 @6B6"8C" D48F54" " 11 ."$$M."J8BA!M 0! ! * ( S ! % ) ! K #!(% K !! K $$M" N#M!MO0 " !$ " L>B."/0 ) $7)'#8 " b>3"WB7E8IEE 5@"f-54B;@" \8=;E84"NWIf\O"QE8T37;"6 >8?6"B=;3E K" 5=J"B=;E5Q45;C8E<" E3QE8J-7BF B4B;@"8C"D3= 3"3Z QE3 66B8= "< 35 6-E3 < 3= ;60" -'7&($)A6"7 $%,0"#"1@ " 24 ."!!&! K !!(!." J8BA!M0!M$*S =F;!#$+"N#MM(O 0 " !% " ,-." \0. "\5 E;5 ." G0" 1"Y >5=D ."/ 0" L3[- 3=73 "J3Q 3=J3 =73" 8C" 7E 866 K >@FEBJBg5;B8=" 8= " 6>8E;"84BD8" )=$> $'(%, " 33 ."3*%."J8BA! M 0! M + $ S= 5ESD=BM * # "N # M M & O0 " !& " \83=6B]3"<8437-4 5E"7>5E57; 3EBg5;B8=" 8C">-<5="7848=" 5=J"E37;54" 75=73E0" -'7&($ " 487 ."$$M K $$)."J8BA!M0!M$*S =5;-E3!!#&#"N#M!#O0 " !( " \83=6B]3"D3=85E57;3EB g 5;B8="8C" 6[-5<8-6"7344"4-=D"75=73E60 " -'7&($ " 489 ."&!+ K &#&." J8BA!M0!M$*S =5;-E3!!%M%"N# M!#O0 " !M " " !) " \83=6B]3"<8437-4 5E"Q8E;E5B ;6"8C" >-<5="FE356;";-<8-E6 0" -'7&( $ " 490 ."(! K )M." J8BA!M0!M$*S =5;-E3!!%!#"N# M!#O0 !! " " FIGURE S FIGURE 1. MicroRNAs a ssociated wi th ovari an ca ncer survi val. P- value plots of univariat e Cox re gressi on f or mi croRNAs associ ated with ovari an can cer s urviv al i denti fied by microar ray (A) or miRNA - Seq (B) data. P - value < 0.0 1 (Solid line). False d iscovery rate (F DR) < 0.1 (D otted line). In b oth A& B, blue d ots indic ate miR NAs associated with survi val b y miRNA array , whi le red dots indica te miRN As associated with surv ival by mi R - Seq. Green stars are mi RNAs associated wit h sur vival in both data sets . !# " " FIGURE 2. S catter - plots of microRNA expression measured by microarray and miRNA - Seq. (A) miR - 98, (B) miR - 505 (C) miR - 143 and (D) miR - 141. !$ " " FIGURE 3. Dist ribut ion of corr elati ons be tween mi croarr ay and sequenci ng pr ofil es for miRNA and gene ex pres sion . (A) Histogram of correlation coefficients for individ ual miRN As measur ed by mi RNA - Seq an d miRNA ar ray. (B) Histogram of corre lation coefficients for m RNA s profiled by Ill umina HiSeq and mRNA array. (C) The em pirical cumu lative distribution fun ction (ECDF ) of the co rrelation betwee n array and se quen cing for m iRNA (black) a nd mR NA (gr ay) measur ement s. Near ly, 72 % of miRNA s d emons tra te a c orr elat io n co eff ic ient ' 0.5 whereas 22 % of R NAs h ave a corr ela ti on c oef fic ien t ' 0.5.
Original Paper
Loading high-quality paper...
Comments & Academic Discussion
Loading comments...
Leave a Comment