Teaching precursors to data science in introductory and second courses in statistics
Statistics students need to develop the capacity to make sense of the staggering amount of information collected in our increasingly data-centered world. Data science is an important part of modern statistics, but our introductory and second statisti…
Authors: Nicholas J Horton, Benjamin S Baumer, Hadley Wickham
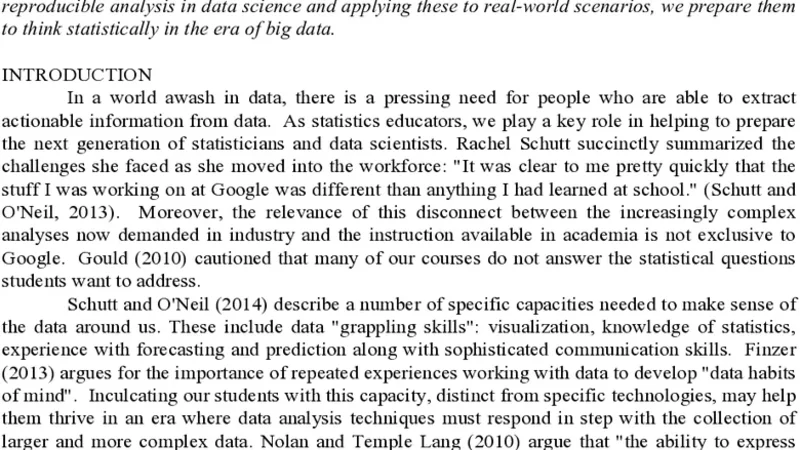
TEACHING PRECURSORS TO DATA S CIENCE IN INTRODUC TORY AND SECOND COURSES IN STATISTIC S Nichol as J . Hor ton 1 , Benjam in S. Ba umer 2 and Hadley Wickham 3 1: Department of Mathematics, Amherst Coll ege, Amherst, MA USA 2: Department of Mathematics and Stati stics, S mi th Colle ge, North ampton , MA U SA 3: Rice Universi ty and RStudio, USA nhorton@amherst.edu Statistics students need to develop the capacity to make sense of the staggering amount of informatio n collected in o ur increasing ly data - centered world. Data science is an im portant part of modern statistics , but our introductory and second statistics courses often neglect this fact. This paper discusses ways to provide a practical foundation for students to lear n to "compute with data" as defi ned by Nolan and Templ e Lang (2010) , as w ell as dev elop "data habits of mind" (Finzer, 2013). We describe how introductory and second courses can integrate two key precursors to data science: the use of reproducible analysis tools and access to large databases. By introdu cing student s to com monplace tools for data manag ement, visualization, and reproducible analysis in data science and applying these to real - world scena rios, we prepare them to think statistic ally in the era of big data. INTRO DUCTIO N In a world awash in data, there is a pressing need for people who are able to extract actionable information from data. As statistics educators, w e play a key role in helping to prepare the next generation of statistic ians and data scien tists. Rach el Schutt succinctly summar ized the challenges she faced as she moved into the workforce: " It was cle ar to m e pretty q uickly that the stuff I was working on at G oogle was different than anything I h ad learned at sch ool ." (Schu tt and O'Nei l, 2013). Mor eover, the relevanc e of this disconne ct betwe en the i ncreasingly complex analyses now demanded in i ndustry and the instruction available in academia is not exclusive to Google . Gould (2010) cauti oned t hat many of our courses do not answe r the statis tica l quest ions students want to address. Schutt an d O'Neil (201 4 ) describe a number of specific cap acities n eeded to make sense of the da ta arou nd us. These include data "grappling skills": visualization , know ledge of statistics , experience with forecasting and prediction along with sophisticated communication skills. Finzer (2013) argu es for the importance of repeated experiences w orking with data to de velop "data habits of mind". Inculcating our students with this capacity, distinct from specific technol ogies, may help them thrive in an e ra w here data analysis techniques must respond in step with the collect ion of larger and mo re co mplex data. Nolan and Temple Lang (2 010) argue that " the ability to express statistical com putations is an essential skill, " and that major changes to foster this capacity are needed in the statistics curriculum at the graduate and undergraduate level s. In this paper, we discuss two precu rsors to data sc ience that we believe shou ld be incorpora ted into a ra nge of introductory and second course s in s tatistics to ensure that st udents begin to develop the ability to frame and answer statisti cal questions with richer supporting data. The two precursor s are the use of reproducibl e analys is tools and the integrati on of large databases into first and seco nd stage cour ses. T hese "ba by - steps" are a necessary but not sufficient way to engage students in data science. W e detail our experiences with these changes and describe ways to integrate a dditional tools into the curricu lum. REPRODUCIBLE ANALYSI S AND R MARKDO WN Recent effort s in statistics education have advocated for an increased use of com puting in the statis tics curricu lum (A merican Statistical Association, 2000; Nolan and Temple Lang, 2010; Americ an St atis tica l Ass ociat ion, 2013 ). At th e same ti me, t here has bee n a startli ng r ealization that many mod ern scientific findings cannot be reproduced (Nature, 2013). W hile there are many causes for irreproducibilit y of results (including issues of multiplicity and data - dredging), a copy - and - paste workflow — an artifact of antiquated use r- interface desig n — makes r eproducibility of statistical analysis more difficult, especially as data become increasingly complex and statistical metho ds be come incre asin gly sophi stic ated (Baum er et al, 2014) . Reproduc ible analysis (Gentleman & Temple Lang , 2 004; X ie, 20 14) f acilitates th e ability of an analyst to conduct an d present data analysis in a w ay that another pers on can understand and replicate (or that they can do thems elves at a later point in time). This is the core of collaborative science. Th e emphasis on reproducibility can be seen as a necessary but not sufficient part o f ensuring that students have capaci ty to “think with data." A nat ural enviro nment to provi de this mento ring is the first time most young scienti sts will encounte r the formal principles of scientif ic inquiry an d reproducibility : in introductory statistics . R Markdown (Allair e et al, 2013) is a new techno logy that simplifies the creation of fully - re producible statistic al analysis. This system , in c onjunctio n w ith the op en - sour ce RStudio environment (R Core Team 2013 and RStudio, 2013), enables students witho ut prior knowl edge of a m arkup language to com bine statistical com puting and w ritten analysis in one document . Briefl y, it transfo rms a well - annotated sou rce file into a sel f- contained HTML file with emb edded graphics, commands, and stylized text. By integrati ng the analysis, documentati on, and interpre tatio n, a structured workflow is provided to novice statisticians. This helps to minimize the pain o f iterative analyses, an d leaves behind a clearly marked set of instructions. Additi onal conten t in the form of text, lists, head ers, tables, exte rnal images , and web lin ks, etc. can su rround the command chunks in a standar d way. Baumer et al (2014) describes experien ces i ntegra ting R M arkdow n into introdu ctory statistics courses i n both small (Smith College) and large (Duke Unive rsity) program s. With appropriate support mechanisms, introductory statistics students were receptive to its adop tion. R Mark down was an improvement ov er th e traditional copy - an d - paste w orkflow. Students left the course equipped with the ability to underta ke reprod ucible an alysis, alo ng with a clear sense for the advantages of this approach. ACCESSING LARGE DATA SETS WITHIN R Nolan and Temple Lang (2 010) also stress the importance of knowledge of information technolog ies, along w ith the ability to w ork with large datasets . Relational da tabases, first popularized in the 1970's, provide fast and effici ent access to terabyte - sized datasets (Taha ghoghi a nd W illiams, 2006). Connections between general purpose statistics packages such as R and database systems can be facilit ated through use of SQL (structured query language). Such interfaces are attractive as they allo w the exploration of large da tasets t hat would be impracti cal to analyze using general purpose st atistical packages (Ripley, 2001). The use o f SQL withi n R is st raightf orward once the dat abase has been crea ted. An add - on package (such as RMySQL or RPostgreSQL) must be installed and loaded, then a con nection m ade to a local or re mote datab ase. MOTIVA TING EXAMPLE : AI RLINE DEL AYS These two precursors make it possible to realist ically analyse a large dataset stored in a database in an introductory or second course. Student s can use thi s to address questions that they find real and relevan t (G ould, 2010) , s uch as airline d elays. It is not ha rd to find motivat ion for investigati ng patterns of flight delays. Ask students: have you ever been stuck in an airport because your flight was delayed o r cancelled and wondered if you could ha ve predicted it if y ou'd had more data? This dataset, which contains more than 150,000,000 observations corresponding to each commercial airline flight in the United States between 1987 and 2012, was utilized in the ASA Data Expo 2009 (Wickha m, JCGS, 2011). The ASA D ata Expo 2009 websit e ( http:// stat - computing.org/dataexpo/2009 ) provides full details regarding how to download the Expo data (1.6 gigabytes compres sed, 12 giga bytes uncompressed throu gh 2008), set up a database, ad d indexing, and then access it f rom within R and RStudio. This opportunity to make a c omplex and i ntere sti ng d atas et accessi ble to s tuden ts in introducto ry statis tics is q uite c ompelling . In the first co urse, this was introdu ced thro ugh u se of the "Ju dging Airlines" m odel e liciting activ ity (M EA) documented by the CA TALST Gro up (2009). This MEA requires no techn ology, but guides students to develo p ideas regarding center and variability us ing sm all sam ples of data for pairs of airlines flying out of Chica go. Later in the course, students return to the inform al "rule" they developed in an extension to determine whether to make the call ab out one a irline being more reliable th an the oth er. Their rule can be automat ed, and then carried out on a series of random samples from the flights from that city on that airline withi n that year. This allows them to see how often their rule picked an airline as being more reliable. Finally, students can sum marize the po pulation of all flights, as a way to better understand sampling variability. This process reflects the process followed by analysts working with big data: samplin g is used to generat e hypoth eses that are then test ed against the complete da taset. The computa tion for the compar ison of their inf ormal "rul e" and analyses of the distributi on of the populat ion values requires some co ding (see examp les at http:// www.amherst.edu/~nhorton/ icot s2014 ). It would n ot be feasible to have studen ts run these commands without some support. The provision of an instructor - provided R Markdown tem plate (leveraging earlier work an d demonstrating the power of the tools) allows R to be used as a tool in a small component of the course . In a second course, more time is available to develop diverse statistical skills. This includes m ore s ophisticated da ta m anageme nt an d m anipulation , suc h as the calc ulation of the weekly count of flig hts over this perio d (re prising the display from Wickham (2009)) with additional years of data. This can be undertaken with a single SQL SELECT statement and some modest pos t - processing in R. Figure 1 displays the pattern, which ha s many interesti ng aspects. Figure 1: display of weekly count s of c ommercia l flights in the Un ited States o ver the p eriod 1 987 to 2012 (total n= 148 , 562 , 493 ). The re is a stron g seasonal p attern and clear impact of 9/11. Other data wran gling and manipul ati on capaci ties can be int roduce d and devel oped using this e xample, includ ing d ata join s/merges (since there are tables prov iding additional (m eta)data about planes and airports). Linkage to other data scraped from the Internet (e.g. d etailed weather informatio n for a particu lar airport or de tails about individual planes) may allow other questions to be answered. Other approaches to analysis of big data in R (e.g. dplyr package) can also be introduced . Use of a databas e to access this rich datas et helps to excite stude nts about the power of statis tics as well as in troduce tools that can help e nergize the n ext generatio n of data scie ntists. CONCLUSION Nolan and Temple Lang argue that s tudents need the facility to express statis tical computations . In addition, t h ere have b een other calls for an increased u se of computing in the statistics curriculum at the undergraduate level (American Statistical Association, 2000). In a n era of increasingly big data, we agree that this is an imperative to develop in students, beginning with the in troductory cou rse. So me in the data scienc e wo rld arg ue that statistics is only relevant for "small data" an d "traditional tools.” We believe that the integration of these precursors to data science into ou r curricula — early and often — wil l he lp statisticians be part of the dialo gue regarding Big D ata and Big Questio ns (Davidian, 2013). We con cur that ther e are bar rie rs and costs to the intr odu cti on of repr odu cib le analy sis tools and database s to our courses. Cobb (2007 ) argued that stat istics cou rses are m ired in te aching technique s dev eloped by pre - computer - era statisticians to circumvent their lack of computational power. Further guidance and research results are needed to guide our work in this area. As Schutt and O'Neil (2013) caut ion, statistics could be viewed as obsolete if this challenge is not embr aced. Date Number of flights per week 90000 100000 110000 120000 130000 140000 150000 1990 1995 2000 2005 2010 Finzer (2013) noted that such changes are also needed before university level, and that the U.S. K - 12 education system "does not provide meaningful learning experiences designed to develop understandi ng of data science concepts or a fl uency with data scienc e skills ". He conclud es that statistics educator s — who general ly un derst and dat a, hav e subs tanti al ex perti se in computa tion, and have developed a variety o f data habits of mind — are w ell - positioned to advocate for m ajor changes in the training of future data scientists. We believe that the time to m ove forward in this manner is now , and believe th at these two precursors p rovide a fou ndation for s uch efforts. ACKNOWLEDGMENTS Thi s work was partially supported by Project MOSAIC , US NSF (DUE - 0920350). We ar e indebted to Yihui Xie , J.J. Alla ire , Jeffrey Horn er, Vicen t Mart i , and Natacha Porte for their work on the knitr and markdown packages in R as well as the R Special I nterest Group on Databases for the DBI interface. REFERENCES Allai re, J., Horner , J., Marti, V., & Porte, N. (2013), markdown: M arkdown rendering for R, R package version 0.6.3, http: //CRAN.R - project.org/pa ckage=markdown . Americ an Statist ical Associ atio n (200 0). Curric ulum guideli nes for undergrad uate programs in statistical science, htt p://www.amstat.org/educa tion/curriculumguidel ines .cfm . Americ an Stat isti cal Associa tion (2013). Curri culum guidel ines for mast ers programs in stat isti cs, http://st attrak.amstat. org/2013/07/01/prepari ng - maste rs . Baumer, B., Cetinka ya - Rundel , M., Bray, A., Loi, L. & Hor ton, N.J. ( 2014) R Markdown: Integrating a reproducible analysis tool into introductory statistics, condition ally accepted, Technology I nnovations in Stati stics Education. CATALST Group (200 9), Judg ing airl ines Model Eliciti ng Activit y (SERC), http://ser c.carleton.edu/ sp/library/mea/exa mples/example5.html . Cobb, G . W. (2007). The i ntroductory s ta tistics c ourse: a Ptolemaic c urriculum? , TI SE 1(1), http://www.escholar ship.org/uc/it em/6hb3k0nz . Davidi an, M. (2013). Aren't we data scienc e? Amstat News , July 1, http://magazine. amstat.org/blog/ 2013/07/01/datascience/ . Finzer, W (2013). The data science education dilemma. Technology Innovations in Statist ics Education , http://eschol arship.org/uc/i tem/7gv0q9dc . Gentl eman, R. & Temple Lang, D. (2004), “Statistica l analyses and reproduci ble resear ch,” Biocondu ctor Projec t Working Papers, Workin g Paper 2, http://bi ostat s.bepr ess.co m/ bioconductor/paper2. Gould, R. (2010) . Stati sti cs and the modern stu dent. I SR , 78(2):297 - 315. Natur e Editori al (2013), “Announcement: Reducing our ir reproduci bility ,” Nature , 496, http://nat ure.com/news/announcement - reducing - our - irrep roducibility - 1.12852 . Nolan, D. & Temple Lang, D. (2007) . Dynamic , interact ive document s for teachi ng statist ical practice. International Sta tistical Review , 75(3 ), 295 - 321. Nolan, D. & Temple Lang, D. (2010), Computin g in the stati stics curricula, The American Statistici an , 64, 97 – 107. R Core Team (2013) , R: A language and envir onment for stat istic al compu ting, R Foundati on for Statist ical Comput ing, Vienna, Austria , ISBN 3 - 900051 - 07 - 0, http://www.R - project. org/ . Ripley , B.D. ( 2001). Using datab ases wi th R. R News , 1(1), 18 - 20. RStudio (2013) , Using R Markdown with RStudio, http://www.rstudi o.com/ide/docs/author ing/using_markdown . Schutt, R. & O'Ne il C (201 4 ). Doing Data Science: Stra ight Talk from the Frontli ne . Sebasto pol, CA: O'Re illy Media. Tahaghoghi , S.M.M & Williams H. E. ( 2006). Learni ng MySQL . Sebasto pol, CA: O 'Reilly M edia. Wick ham, H (20 09) . ASA 200 9 Da ta Exp o, JCGS . 20( 2):281 - 283 . Xie, Y. ( 2014), Dynami c Doc uments with R and knit r , London: Chapman & Hall/ CRC.
Original Paper
Loading high-quality paper...
Comments & Academic Discussion
Loading comments...
Leave a Comment