A Boosting Approach to Learning Graph Representations
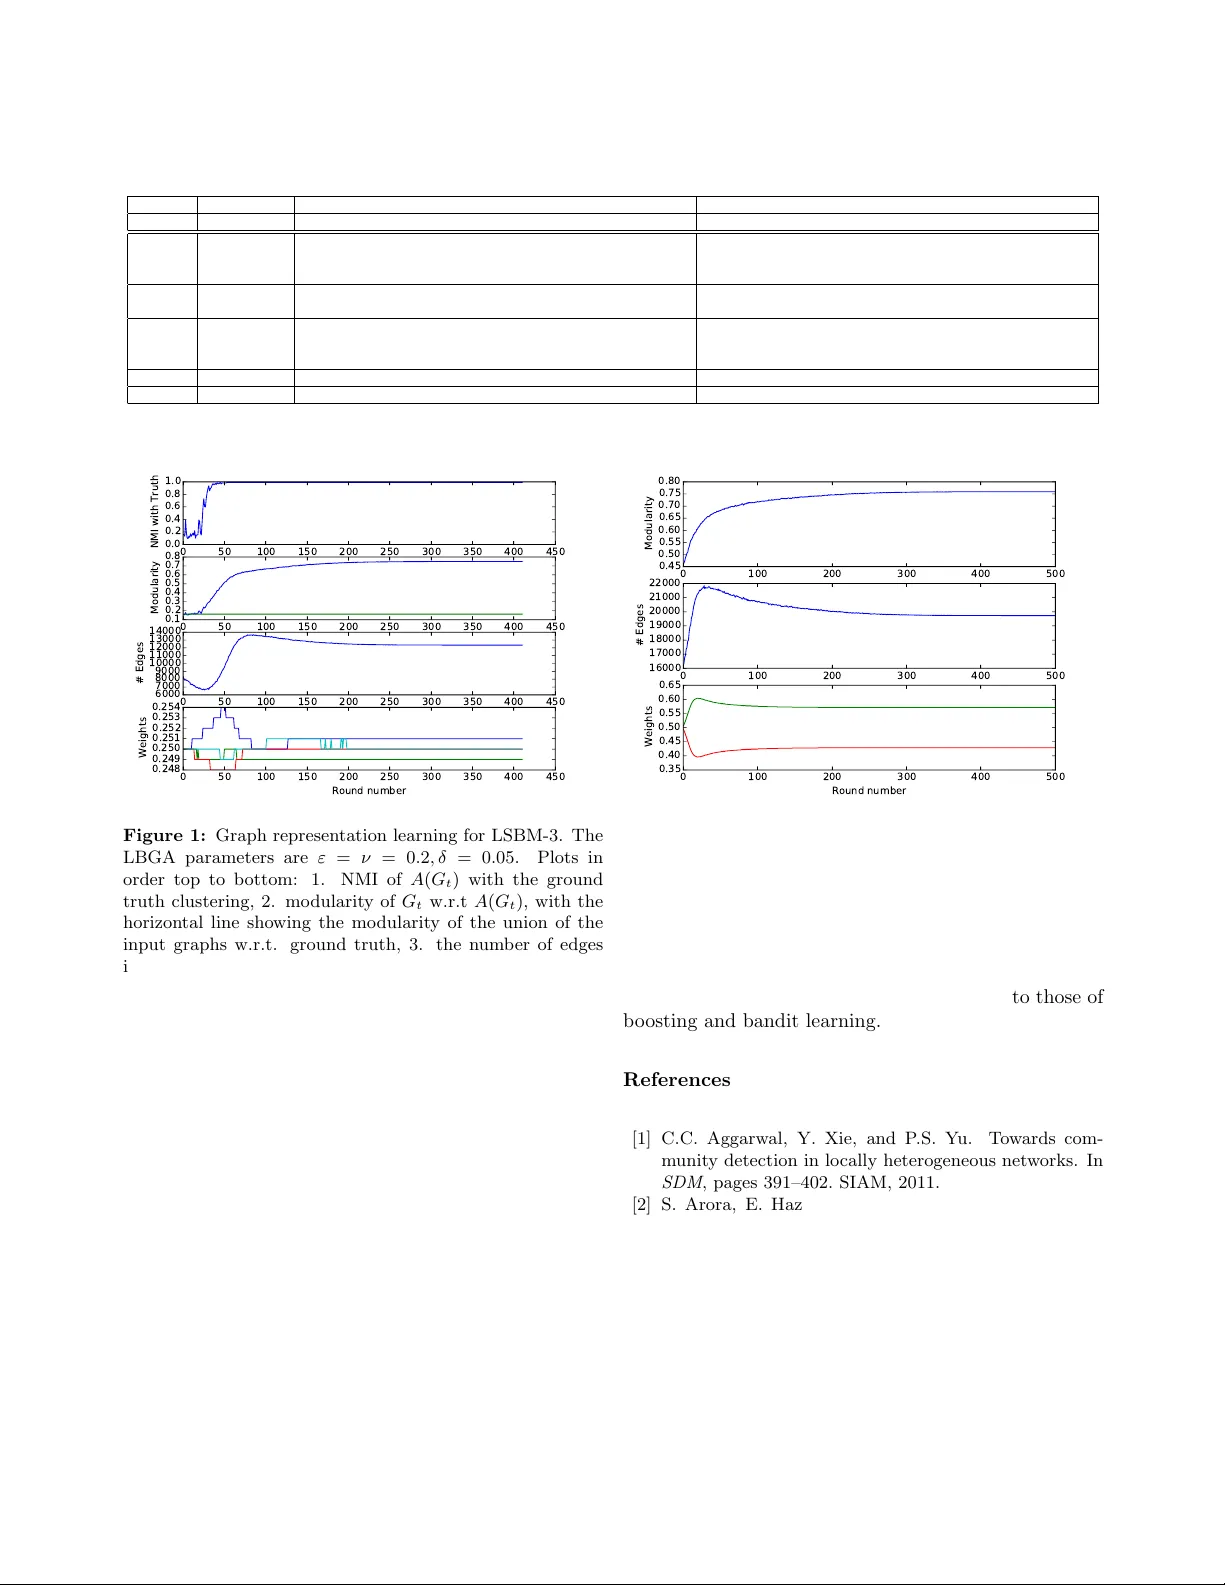
Learning the right graph representation from noisy, multisource data has garnered significant interest in recent years. A central tenet of this problem is relational learning. Here the objective is to incorporate the partial information each data sou…
Authors: Rajmonda Caceres, Kevin Carter, Jeremy Kun
A Bo osting Approac h to Learning Graph Represen tations ∗ Ra jmonda S. Caceres † 1 , Kevin M. Carter ‡ 1 , and Jerem y Kun § 1,2 1 MIT Lincoln Lab oratory 2 Univ ersity of Illinois at Chicago Abstract Learning the right graph representation from noisy , m ulti- source data has garnered significan t interest in recent y ears. A cen tral tenet of this problem is relational learning. Here the ob jectiv e is to incorp orate the partial information each data source giv es us in a wa y that captures the true under- lying relationships. T o address this c hallenge, w e present a general, b oosting-inspired framework for combining weak evidence of entit y asso ciations into a robust similarity met- ric. W e explore the extent to which different quality mea- suremen ts yield graph representations that are suitable for comm unity detection. W e then present empirical results on b oth syn thetic and real datasets demonstrating the utilit y of this framework. Our framework leads to suitable global graph representations from quality measurements lo cal to eac h edge. Finally , w e discuss future extensions and theoret- ical considerations of learning useful graph representations from weak feedback in general application settings. 1 In tro duction In the study of netw orks, the data used to define no des and connections often come from m ultiple sources. These sources generally hav e nontrivial levels of noise and am biguous utilit y , and the process of com bining them into a single graph representation is critically im- p ortan t. F or example, supp ose we are studying a so- cial netw ork and wish to detect communities. The data that indicate membership in the same communit y are plen tiful: communication data, co-authorship, rep orted friendship, and man y others. Eac h of these asso cia- tions carries different levels of information about the underlying so cial structure, and eac h may accurately represen t only some of the individuals. Some groups of ∗ This w ork is sponsored b y the Assistant Secretary of Defense for Research & Engineering under Air F orce Contract F A8721-05- C-0002. Opinions, interpretations, conclusions and recommenda- tions are those of the authors and are not necessarily endorsed by the United States Gov ernment. † ra jmonda.caceres@ll.mit.edu ‡ kevin.carter@ll.mit.edu § jkun2@uic.edu friends communicate primarily through F aceb ook and others via Instagram, etc. The b est wa y to amalga- mate this information is far from clear, and recen t re- searc h has demonstrated the impact of graph represen- tation on the p erformance of mac hine learning algo- rithms [14, 13, 20, 8]. F urther complicating matters, the qualit y of the aggregated graph dep ends heavily on the application domain. A graph represen tation that retains only edges within communities is conduciv e for communit y detection, but some cross-communit y edges are critical to predict the spread of a virus. The b est graph represen tations for these tw o tasks may come from the same data sources but are qualitativ ely different. Ev en though the impact of the graph representa- tion on subsequent analysis has b een widely studied, tec hniques for learning the righ t graph representations are lac king. Current practices often aggregate different graph sources ad-ho c, making it difficult to compare al- gorithms across application domains or even within the same domain using different data sources. The immedi- acy for rigorous approaches on represen tation learning of graphs is even more apparen t in the big data regime, where c hallenges connected to v ariet y and veracit y ex- acerbate the challenges of volume and velocity . In this pap er, we presen t a graph aggregation frame- w ork designed to make the process of learning the under- lying graph representation rigorous with resp ect to ap- plication specific requirements. Our framew ork is called L o c al ly Bo oste d Gr aph A ggr e gation (LBGA) . LBGA ex- tracts the application-specific aspects of the learning ob- jectiv e as an even t A represen ting an op eration on the graph (e.g. a clustering algorithm, a random walk, etc.) and a lo cal qualit y measure q . The framework then in- corp orates this information into a reward system that promotes the presence of go od edges and the absence of bad edges, in a fashion inspired by b oosting literature. W e demonstrate LBGA with the application of com- m unity detection. In this context the goal of graph rep- resen tation learning is to aggregate the different data sources in to a single graph which makes the true com- m unity structure easy to detect. LBGA ev aluates the graph data locally , so that it can choose the data sources whic h most accurately represen t the local structure of comm unities observed in real netw orks [1, 17]. In the absence of ground truth kno wledge or one efficiently computable measure that can capture true communit y qualit y , LBGA relies on the pair of a graph clustering algorithm A and a lo cal clustering metric q as an ev al- uation proxy . W e sho w through empirical analysis that our algorithm can learn a high-quality global represen- tation guided by the lo cal quality measures considered. W e make the following con tributions: 1. W e present an aggregation framew ork the learns a useful graph represen tation with resp ect to an application requiring only a local heuristic measure of quality to op erate. 2. Our framework incorp orates both edge and non- edge information, making it robust and suitable for sparse, noisy real-world netw orks. 3. W e demonstrate the success of our algorithm with resp ect to communit y detection, testing it against b oth syn thetic and real data. 4. W e describ e ho w the result of our algorithm can b e used to compare the utility and quality of the data sources used. The rest of the pap er is organized as follows. In Section 2 we give a brief ov erview of related literature. In Section 3 we discuss in detail the LBGA framew ork. In Section 4 w e presen t the exp erimen tal analysis and results. 2 Related W ork 2.1 Represen tation Learning and Clustering Represen tation learning has garnered a lot of interest and research in recen t years. Its goal is to introduce more rigor and formalism to the often ad-ho c practices of transforming raw, noisy , m ulti-source data into in- puts for data mining and machine learning algorithms. Within this area, represen tation learning of graph-based data includes mo deling decisions about the no des of the graph, the edges, as well as the critical features that c haracterize them b oth. In this context, Rossi et al. [25] discuss transfor- mations to heterogeneous graphs (graphs with m ultiple no de t yp es and/or multiple edge types) in order to im- pro ve the quality of a learning algorithm such as com- m unity detection or link prediction. Within their tax- onom y , our work falls under the link interpretation and link re-weigh ting algorithms [30, 15]. Our setting is dif- feren t b ecause w e explicitly allow differen t edge types b et w een the same pair of vertices. Also, our approach is sto c hastic, which w e find necessary for learning a ro- bust representation and weeding out noise. Clustering in multi-edge graphs [22, 28, 27, 19, 5] is another area with c lose connections to our w ork. A common thread among these existing approac hes is clus- tering by leveraging shared information across differ- en t graph representations of the same data. These ap- proac hes do not address scenarios where the informa- tion provided by the different sources is complemen tary or the o verlap is scarce. In contrast, our approac h it- erativ ely selects those edge sources that lead to better clustering qualit y , indep enden tly of disagreemen t across the different features. [24, 9] presen t approac hes for iden tifying the righ t graph aggregation, giv en a com- plete ground truth clustering, or a p ortion of it (i.e.: the cluster assignment is known only for a subset of the v ertices in the graph). Our framework requires no such kno wledge, but we do use ground truth to v alidate our exp erimen ts on synthetic data (Section 4.3). Balcan and Blum present in [3, 4] a list of intuitiv e prop erties a similarit y function needs to hav e in order to b e able to cluster well. How ever, testing whether a similarit y function has the discussed properties is NP- hard, and often dep enden t on ha ving ground truth a v ail- able. Our mo del instead uses an efficiently computable heuristic as a rough guide. 2.2 Bo osting and Bandits Our framework is re- lated to b oth b oosting [26] and bandit learning tec h- niques (see [6] for an ov erview). In b o osting, we assume w e ha ve a collection of we ak le arners for classification, whose p erformance is only slightly b etter than random. In his seminal paper [26], Schapire show ed that such learners can b e combined to form an arbitrarily strong learner. W e think of differen t data sources as weak learners in that they offer knowledge on when an edge should b e present. Then the question b ecomes whether one can “bo ost” the kno wledge in the different graphs to mak e one graph represen tation that is arbitrarily go od. Unfortunately , our problem setting do es not allo w pure b oosting. First, b oosting assumes the learners are equally go od (in the sense that they are all sligh tly b etter than random); but graph representations can b e pure noise or can even pro vide b ad advice. And second, b oosting has access to ground truth. Even if we had graph representations that were all “go o d,” the quality c hanges based on the application and man y applications ha ve no standard measure of quality . Our second inspiration, bandit learning, compen- sates for these issues. In bandit learning an algorithm receiv es rewards as it explores a set of actions, and the goal is to comp ete against the b est action in hindsight (minimizing some notion of regret). The model has man y v ariants, but tw o ubiquitous features are exp ert advice and adv ersaries. Expert advice consists of func- tions suggesting to the algorithm what action to take in each round. The adversarial setting in volv es an ad- v ersary who knows ev erything but the random choices made by the algorithm in adv ance, and sets the exp erts or rewards so as to incur the largest regret. The similarity to graph represen tation learning is clear: we hav e a set of graphs giving p oten tially bad advice ab out their edges and we can set up an artificial rew ard system based on our application. In our setting w e only care if the graph representation is goo d at the end, while bandit learning often seeks to maximize cum ulative rewards during learning. There are bandit settings that only care about the final result (e.g., the pure exploration mo del of Bub ec k et al. [7]), but to the b est of our kno wledge no theoretical results in the bandit literature immediately apply to our framework. This is largely because we rely on heuristic proxies to measure the quality of a graph, so ev en if the bandit learning ob jective is optimized we cannot guaran tee the result is useful. 1 Nev ertheless w e can adapt the successful techniques and algorithms for b o osting and bandit learning, and hope they produce useful graphs in practice. As the rest of this pap er demonstrates, they do indeed. The primary technique we adapt from bandits and b oosting is the Multiplicativ e W eigh ts Up date Algo- rithm (MWUA) [2]. The algorithm works as follows. A list of weigh ts is main tained on each elemen t x j of a finite set X . At eac h step of some pro cess an element x i is chosen (in our case, by normalizing the weigh ts to a probability distribution and sampling), a reward q t,i is received, and the w eight for x i is multiplied or di- vided b y (1 + εq t,i ), where ε > 0 is a fixed parameter con trolling the rate of up date. After many rounds, the elemen ts with the highest w eight are deemed the best and used for whatever purp ose needed. 3 The Lo cally Bo osted Graph Aggregation F ramew ork Our learning framew ork can succinctly be describ ed as running MWUA for eac h p ossible edge, forming a candidate graph representation G t in eac h round by sampling from all edge distributions, and computing lo cal rewards on G t to up date the weigh ts for the next round. Ov er time G t stabilizes and we pro duce it as output. The remainder of this section fleshes out the details of this sk etch and our sp ecific algorithm 1 F or example, the empty graph maximizes some proxies but is entirely useless. implemen ting it. 3.1 F ramew ork Details Let H 1 , . . . , H m b e a set of un weigh ted, undirected graphs defined on the same v ertex set V . W e think of each H i as “exp ert advice” suggesting for any pair of vertices u, v ∈ V whether to include edge e = ( u, v ) or not. Our primary goal is to com bine the information presen t in the H i to pro duce a global graph represen tation G ∗ suitable for a giv en application. The framework we present is describ ed in the con- text of communit y detection, but we will note what as- p ects can b e generalized. Eac h round has four parts: pro ducing the aggregate candidate graph G t , comput- ing a clustering A for use in measuring the quality of G t , computing the lo cal quality of each edge, and using the quality v alues to up date the w eights for the edges. After some n umber of rounds T , the pro cess ends and w e pro duce G ∗ = G T . Aggregated Candidate Graph G t : In each round pro duce a graph G t as follows. Main tain a non- negativ e weigh t w u,v ,i for each graph H i and each edge ( u, v ) in H 1 ∪ · · · ∪ H m . Normalize the set of all weigh ts for an edge w u,v to a probability distribution o v er the H i ; th us one can sample an H i prop ortionally to its w eight. F or each edge, sample in this wa y and include the edge in G t if it is present in the drawn H i . Ev ent A ( G t ): After the graph G t is pro duced, run a clustering algorithm A on it to pro duce a clustering A ( G t ). In this pap er we fix A to b e the W alktrap algo- rithm [23], though we hav e observ ed the effectiv eness of other clustering algorithms as well. In general A can b e an y even t, and in this case we tie it to the application b y making it a simple clustering algorithm. Lo cal qualit y measure : Define a lo c al quality me asur e q ( G, e, c ) to b e a [0 , 1]-v alued function of a graph G , an edge e of G , and a clustering c of the v ertices of G. The qualit y of ( u, v ) in G t is the “rew ard” for that edge, and it is used to up date the weigh ts of each input graph H i . More precisely , the reward for ( u, v ) in round t is q ( G t , ( u, v ) , A ( G t )). Up date Rule : Update the weigh ts using MWUA as follows. Define tw o learning rate parameters ε > 0 , ν > 0, with the former b eing used to up date edges from G t that are present in H i and the latter for edges not in H i . In particular, supp ose q u,v is the quality of the edge ( u, v ) in G t . Then, the up date rule is defined as follows: w u,v ,i = ( w u,v ,i (1 + εq u,v ) , if ( u, v ) ∈ H i w u,v ,i (1 − ν q u,v ) , if ( u, v ) 6∈ H i . 3.2 Qualit y Measures for Communit y Detec- tion W e presently describ e the tw o lo cal qualit y mea- sures we use for communit y detection. The first, which w e call Edge Consistency ( E C ) captures the in tuitive clustering qualit y notion that edges with endp oin ts in the same cluster are sup erior to edges across clusters: E C u,v = ( 1 , if c ( u ) = c ( v ) 0 , if c ( u ) 6 = c ( v ) . E C offers a quality metric that is inextricably tied to the p erformance of the chosen clustering algorithm. The idea behind edge consistency can also b e com bined with an y quality function q to pro duce a “consisten t” v ersion of q . Simply ev aluate q when the edge is within a cluster, and − q when the edge is across clusters. Note that q need not dep end on a clustering of the graph or the clustering algorithm, and it can represen t algorithmic- agnostic measures of clustering quality . As an example of such a measure q , we consider the metric of Neighb orho o d Overlap ( N O ), whic h uses the idea that vertices that share many neighbors are likely to b e in the same communit y . NO declares that the qualit y of ( u, v ) is equal to the (normalized) cardinality of the intersection of the neighborho ods of u and v : N O u,v = | N ( u ) ∩ N ( v ) | | N ( u ) ∩ N ( v ) | + log ( | V | ) , where N ( x ) represents the neigh b orhoo d of vertex x . W e hav e also run exp erimen ts using more conv entional normalizing mec hanisms, such as the Dice and Jaccard indices [11, 16]), but our neighborho o d ov erlap metric outp erforms them by at least 10% in our exp erimen ts. W e argue this is due to the use of a global normalization factor, as opp osed to a lo cal one, which is what Dice and Jaccard indices use. This, for example, gives stronger feedback to edges adjacent to high degree no des. F or brevity and simplicit y , we omit our results for Jaccard and Dice indices and fo cus on Neighborho o d Ov erlap. In our experimental analysis (Section 4.4) w e use the consistent version of N O , whic h we denote c onsistentNO . While we demonstrate the utility of the LBGA framew ork b y using E C and consistentN O , the design of the framework is modular, in that the mechanism for rewarding the “right” edges is indep endent from the definition of reward. This allows us to plug in other quality metrics to guide the graph represen tation learning pro cess for other applications, a key goal in LBGA’s design. 3.3 LBGA Implemen tation Processing every edge in every round of the LBGA framework is inefficien t. Our implementation of LGBA, given b y Algorithm 1, impro ves efficiency b y fixing edges whose weigh ts hav e gro wn so extreme so as to b e pick ed with ov erwhelming or negligible probability (with probability > 1 − δ or < δ for a new parameter δ ). In practice this pro duces a dramatic sp eedup on the total runtime of the algorithm. 2 The w orst-case time complexity is the same, but balancing parallelization and the learning parameters suffices for practical applications. In addition, our decision to p enalize non-edges ( ν > 0) also improv es runtime from the alternativ e ( ν = 0). In our exp eriments non-edge feedbac k causes G t to con vergence in roughly half as many rounds as when only presence of edge is considered as indication of relational structure. W e also note that Algorithm 1 stays inside the “b oundaries” determined by the input graphs H i . It nev er considers edges that are not suggested by some H i , nor do es it reject an edge suggest by all H i . Thus, when we discuss sparsit y of our algorithm’s output in our exp erimen ts, we mean with resp ect to the num b er of edges in the union of the input graphs. 4 Exp erimen tal Analysis W e presently describe the datasets used for analysis and provide quantitativ e results for the p erformance of Algorithm 1. 4.1 Syn thetic Datasets Our primary synthetic data mo del is the stochastic block mo del [29], commonly used to model explicit communit y structure. W e con- struct a probabilit y distribution G ( n , B ) o ver graphs as follo ws. Given a num b er n of vertices and a list of clus- ter (blo ck) sizes n = { n 1 , . . . , n k } such that n = P i n i , w e partition the n v ertices in to k blocks { b 1 , . . . , b k } , | b i | = n i . W e declare that the probability of an edge o ccurring b et ween a vertex in blo c k b i and blo ck b j is giv en b y the ( i, j ) entry of a k -by- k matrix B . In order to sim ulate differen t scenarios, w e consider the following three cases. Glob al Sto chastic Blo ck Mo del (GSBM): In this mo del w e ha ve m input graphs H i , . . . , H m , each drawn from the sto c hastic blo ck mo del G ( n , B i ) 3 , with n 1 = · · · = n m and B i defined as: 2 F rom days to minutes in our exp erimen ts. 3 G ( n , B i ) represents a simpler case of the sto chastic blo c k model, where the within-cluster probabilities are uniform across blocks and blo cks hav e the same size. Data : Unw eighted graphs H 1 , . . . , H m on the same vertex set V , a clustering algorithm A , a lo cal quality metric q , three parameters ε, ν, δ > 0 Result : A graph G Initialize a vector w u,v = 1 for all u 6 = v ∈ V Let U b e the edge set of H 1 ∪ · · · ∪ H m Let G learned = ( V , ∅ ) while | U | > 0 do Let G b e a copy of G learned for ( u, v ) ∈ U do Let p u,v = P i w u,v,i 1 { ( u,v ) ∈ H i } P i w u,v,i Flip a coin with bias p u,v If heads, include ( u, v ) in G . end Cluster G using A for ( u, v ) ∈ U do Set p = q ( G, A ( G ) , ( u, v )) for i = 1 , . . . , m do if ( u, v ) ∈ H i then Set w u,v,i = w u,v,i (1 + εp ) else Set w u,v,i = w u,v,i (1 − ν p ) end end Let p u,v = P i w u,v,i 1 { ( u,v ) ∈ H i } P i w u,v,i if p u,v > 1 − δ then Add ( u, v ) to G learned , remove it from U end if p u,v < δ then Remov e ( u, v ) from U end end end Output G Algorithm 1: Optimized implementation of LBGA. Note that 1 E denotes the characteristic function of the even t E . B i = p i r i r i . . . r i r i p i r i . . . r i . . . . . . . . . . . . . . . r i r i r i . . . p i , where p i represen ts the within-cluster edge probabilit y and r i represen ts the across-cluster edge probabilit y in graph H i . The ratio S N R = p i /r i is commonly referred to as the signal to noise ratio and captures the strength of communit y structure within H i . W e use the GSBM case to mo del a scenario where each graph source has a global (or uniform) contribution tow ard the quality of the targeted graph representation G ∗ . L o c al Sto chastic Blo ck Mo del (LSBM): This sce- nario captures the notion that one graph source accu- rately describ es one communit y , while another source fares b etter for a different communit y . F or example, if we hav e t wo underlying communities, and tw o graph sources H 1 , H 2 , then w e use the follo wing t wo block ma- trices to represent them: B 1 = p r r r , B 2 = r r r p . This naturally extends to a general form ulation of the LSBM mo del for m communities. Er d˝ os-R ´ enyi (ER) mo del: Finally , we consider the case of the Erd˝ os-R´ enyi random graph [12], where any t wo vertices hav e equal probability of b eing connected. This mo del pro vides an example of a graph with no comm unity structure. Note that the ER mo del is a sp ecial case of both GSBM and LSBM with p = r . In our exp erimen tal analysis we consider cases where an ER mo del is injected into instances of GSBM and LSBM in order to capture a range of structure and noise com binations. 4.2 Real Datasets Our primary real-w orld dataset is DBLP [18], a comprehensiv e online database do cu- men ting researc h in computer science. W e extracted the subset of the DBLP database corresp onding to re- searc hers who hav e published at tw o conferences: the Symp osium on the Theory of Computing (STOC), and the Symp osium on F oundations of Computer Science (F OCS). The breadth of topics presented at these con- ferences implies a natural comm unity structure orga- nized by sub-field. Each no de in the DBLP graph rep- resen ts an author, and w e use tw o graphs on this ver- tex set: the c o-authorship graph and the title similar- ity graph. F or the latter, we consider tw o titles to b e similar if they contain at least three words in common (excluding stop words). W e considered a total of 5234 pap ers. T able 1 contains a summary of all the datasets used for the exp erimen tal analysis and their parameters. 4.3 V alidation Pro cedure In our work, the opti- malit y of the graph representation is closely coupled with the quality of comm unity structure captured by the representation. This gives us sev eral wa ys of ev al- uating the qualit y of the results pro duced by our algo- rithm. W e consider notions of quality reflected at differ- en t levels: the quality of cluster assignmen t, the quality of graph represen tation, and the quality of graph source w eighting. Quality of Cluster Assignment: we use the Normal- ized Mutual Information (NMI) measure [10] to capture ho w w ell the ground truth clustering ov erlaps with the clustering on the graph representation output from our algorithm. T able 1: Description of datasets analyzed. T otal num b er of vertices in each source graph is n=500. m is the num b er of graph sources. n i represen ts num b er of vertices in cluster i . p i and r i represen t the within- and across-cluster edge probabilit y for each the m graph sources. Dataset Parameters GSBM-1 m = 4, n i = 125, p i = 0 . 2, r i = 0 . 05, i = 1 , . . . , m GSBM-2 m = 4, n i = 125, p i = 0 . 3, r i = 0 . 05, i = 1 , . . . , m GSBM-3 m = 5, n i = 125, p i = 0 . 3, r i = 0 . 05, i = 1 , . . . , 4, p 5 = r 5 = 0 . 01 GSBM-4 m = 4, n i = 125, p 1 = 0 . 1625 , p 2 = 0 . 125 , p 3 = 0 . 125 , p 4 = 0 . 0875, r i = 0 . 05, i = 1 , . . . , m GSBM-5 m = 4, n i = 125, p 1 = 0 . 15 , p 2 = 0 . 1 , p 3 = p 4 = 0 . 05, r i = 0 . 05, i = 1 , . . . , m LSBM-1 m = 4, n i = 125, p i = 0 . 2, r i = 0 . 05, i = 1 , . . . , m LSBM-2 m = 4, n i = 125, p i = 0 . 3, r i = 0 . 05, i = 1 , . . . , m LSBM-3 m = 5, n i = 125, p i = 0 . 3, r i = 0 . 05, i = 1 , . . . , m , p 5 = r 5 = 0 . 01 ER only n = 500 , m = 4, p i = r i = 0 . 01 DBLP n = 3153 , m = 2 Quality of Gr aph R epr esentation: an ideal graph represen tation that con tains communit y structure w ould consist of disjoint cliques or near-cliques corre- sp onding to the comm unities. W e use the measure of mo dularit y [21] to capture this notion of represen tation qualit y . Mo dularit y is a p opular measure that compares a given graph and clustering to a null mo del. As we il- lustrate in Section 4.4, an optimal graph representation can do b etter than just pro duce a p erfect clustering. It can also remo ve cross-communit y edges and pro duce a sparser represen tation, whic h is what our algorithm do es. W e note tw o extreme graph representation cases, the empty graph which is p erfectly mo dular in a de- generate sense, and the union graph whic h is a trivial aggregation. T o signal these cases in our results, w e dis- pla y the sp arsity of the pro duced graph G ∗ , defined as the fraction of edges in G ∗ out of the total set of edges in all input graphs. Quality of Gr aph Sour c e Weighting: the quality of the aggregation pro cess is captured by the right w eight- ing of individual edge sources. Edge sources (input graphs) that are more influen tial in uncov ering the un- derlying communit y structure ha ve higher w eights on a verage. Similarly , edge types that con tribute equally should hav e equal weigh ts, and edge t yp es with no un- derlying structure should hav e lo w weigh ts. 4.4 Exp erimen tal Results F or illustration, we sho w in Figure 1 the p erformance of Algorithm 1 when consistentN O is used as a lo cal quality metric and LSBM-3 (see T able 1 for details) is used to generate the input graphs. Note that the algorithm conv erges quic kly to a graph which results in a p erfect cluster- ing as measured by NMI. W e also plot the mo dularit y of the resulting graph pro duced in each round, seeing that it far exceeds the “baseline” mo dularit y of the union of the input graphs. This tells us the learn- ing algorithm is able to discard the noisy edges in the mo del. Finally , w e plot the n umber of edges in the graph pro duced in each round, and the av erage edge weigh t for each input graph. This v erifies that our algorithm complies with our edge-type weigh ting and sparsity re- quiremen ts. Indeed, the algorithm pro duces a relativ ely sparse graph, using ab out 40% of the total edges av ail- able and weigh ts edges from the Erd˝ os-R´ en yi source ap- propriately . Our algorithm hence achiev es a sup erior graph than the union, while preserving the underlying comm unity structure so as to b e amenable to clustering. In Figure 2, w e show results for the DBLP dataset. Our algorithm selects title similarity as having more in- fluence in recov ering communities for the STOC/FOCS conferences. Researchers attending these conferences represen t a s mall communit y as a whole with many of them sharing co-authorship on pap ers with diverse top- ics. In this sense, it is not surprising that title simi- larit y serves as a b etter pro xy for capturing the more pronounced division along topics. A summary of our algorithm’s results for the E C and consistentN O qualit y measures are shown in T a- ble 2. Ov erall, w e find that Algorithm 1 con verges to graphs of high mo dularity and that induce correct clus- terings in almost all the cases, the challenging case b e- ing when SNR is low. Moreov er the algorithm weigh ts the different input graphs appropriately to their use- fulness. W e find that the edge consistency measure outp erforms neigh b orhoo d o verlap in terms of o verlap with ground truth clustering (NMI v alue), but that in the cases where they both pro duce p erfect clusterings, consistentN O pro duces sparser, more mo dular graphs. This is esp ecially true for the DBLP data set. 5 Conclusions W e present the Lo cally Boosted Graph Aggregation framew ork, a general framework for learning graph represen tations with resp ect to an application. In this pap er, we demonstrate the strength of the framework with the application of comm unity detection, but the T able 2: LBGA p erformance results Union Graph EC ConsistentNO Dataset Modularity Modularity NMI Sparsity Edge Type W eights Modularity NMI Sparsity Edge Type W eights GSBM-1 0.264 0.549 1 0.644 (0.250,0.251,0.250,0.249) 0.750 1 0.515 (0.250,0.251,0.249,0.249) GSBM-2 0.323 0.580 1 0.691 (0.252,0.250,0.248,0.251) 0.750 1 0.573 (0.252,0.250,0.247,0.251) GSBM-3 0.312 0.607 1 0.657 (0.225,0.224,0.226,0.227,0.098) 0.750 1 0.562 (0.221,0.221,0.222,0.223,0.113) GSBM-4 0.143 0.421 0.966 0.585 (0.202,0.232,0.265,0.302) 0.750 0.983 0.393 (0.202,0.231,0.266,0.302) GSBM-5 0.145 0.395 0.919 0.653 (0.213,0.282,0.361,0.144) 0.666 0.958 0.477 (0.199,0.271,0.348,0.182) LSBM-1 0.111 0.298 0.765 0.651 (0.253,0.250,0.250,0.248) 0.378 0.032 0.060 (0.249,0.251,0.250,0.250) LSBM-2 0.167 0.464 0.975 0.582 (0.249,0.251,0.248,0.252) 0.750 1 0.417 (0.250,0.250,0.248,0.252) LSBM-3 0.162 0.473 0.966 0.568 (0.218,0.217,0.222,0.219,0.124) 0.750 0.968 0.395 (0.212,0.212,0.213,0.209,0.154) ER only -0.002 0.193 0.012 0.999 (0.264,0.234,0.260,0.243) 0.836 0.025 0.230 (0.251,0.253,0.248,0.247) DBLP NA 0.514 NA 0.887 (0.319,0.681) 0.764 NA 0.635 (0.432,0.568) 0 50 100 150 200 250 300 350 400 450 0.0 0.2 0.4 0.6 0.8 1.0 NMI with Truth 0 50 100 150 200 250 300 350 400 450 0.1 0.2 0.3 0.4 0.5 0.6 0.7 0.8 Modularity 0 50 100 150 200 250 300 350 400 450 6000 7000 8000 9000 10000 11000 12000 13000 14000 # Edges 0 50 100 150 200 250 300 350 400 450 Round number 0.248 0.249 0.250 0.251 0.252 0.253 0.254 Weights Figure 1: Graph representation learning for LSBM-3. The LBGA parameters are ε = ν = 0 . 2 , δ = 0 . 05. Plots in order top to b ottom: 1. NMI of A ( G t ) with the ground truth clustering, 2. mo dularit y of G t w.r.t A ( G t ), with the horizon tal line showing the modularity of the union of the input graphs w.r.t. ground truth, 3. the num b er of edges in G t , 4. the av erage probability weigh t (quality) of edges of H i . The Erd˝ os-R´ enyi graph conv erges to lo w weigh t by round 300. framew ork can be extended to other inference goals in graphs such as link prediction or diffusion estimation. Our framework offers a flexible, lo cal w eighting and aggregation of different edge sources in order to b etter represen t the v ariabilit y of relational structure observed in real netw orks. Inspired by concepts in b oosting and bandit learning approac hes, LBGA is designed to handle aggregations of noisy and disparate data sources, therefore marking a departure from metho ds that assume o verlap and usefulness among all data sources considered. W e demonstrated the utilit y of our framew ork for a range of aggregation scenarios with differen t levels of signal to noise. F or future work, we plan to analyze the utility of our framework with resp ect to other graph learning ap- 0 100 200 300 400 500 0.45 0.50 0.55 0.60 0.65 0.70 0.75 0.80 Modularity 0 100 200 300 400 500 16000 17000 18000 19000 20000 21000 22000 # Edges 0 100 200 300 400 500 Round number 0.35 0.40 0.45 0.50 0.55 0.60 0.65 Weights Figure 2: Aggregation of co-authorship (red curve) and title similarity graphs (green curv e) for DBLP dataset. plications, as well as presen t more thorough compar- isons of our framew ork with existing multigraph clus- tering algorithms. Finally , we will explore the p otential for theoretical p erformance guarantees, akin to those of b oosting and bandit learning. References [1] C.C. Aggarwal, Y. Xie, and P .S. Y u. T ow ards com- m unity detection in lo cally heterogeneous net works. In SDM , pages 391–402. SIAM, 2011. [2] S. Arora, E. Hazan, and S. Kale. The multiplicativ e w eights up date method: a meta-algorithm and applica- tions. The ory of Computing , 8(1):121–164, 2012. [3] M. Balcan and A. Blum. On a the ory of kernels as similarity functions . Mansucript, 2006. [4] M. Balcan, A. Blum, and N. Srebro. A theory of learning with similarit y functions. Machine Le arning , 72(1-2):89–112, 2008. [5] M. Berlingerio, M. Coscia, and F. Giannotti. Finding redundan t and complementary comm unities in multidi- mensional netw orks. In CIKM , pages 2181–2184, 2011. [6] S. Bubeck and N. Cesa-Bianc hi. Regret analysis of sto c hastic and nonsto c hastic multi-armed bandit prob- lems. F oundations and T rends in Machine L e arning , 5(1):1–122, 2012. [7] S. Bub ec k, R. Munos, and G. Stoltz. Pure exploration in m ulti-armed bandits problems. In AL T , pages 23–37, 2009. [8] R. S. Caceres, T. Y. Berger-W olf, and R. Grossman. T emp oral scale of pro cesses in dynamic netw orks. In ICDM Workshops , pages 925–932, 2011. [9] D. Cai, Z. Shao, X. He, X. Y an, and Jia wei Han. Comm unity mining from multi-relational net works. In PKDD , pages 445–452, 2005. [10] L. Danon, J. Duch, A. Diaz-Guilera, and A. Arenas. Comparing comm unity structure identification. J. Stat. Me ch. , 2005:P09008, 2005. [11] L. R. Dice. Measures of the amoun t of ecologic asso ciation b et ween species. Ec olo gy , 26(3):297–302, July 1945. [12] P . Erd¨ os and A. R´ enyi. On random graphs, I. Public a- tiones Mathematic ae (Debre c en) , 6:290–297, 1959. [13] B. Gallagher, H. T ong, T. Eliassi-Rad, and C. F alout- sos. Using ghost edges for classification in sparsely la- b eled netw orks. In Pro c. (14th) ACM SIGKDD Inter. Conf. on Know le dge Disc overy and Data Mining , pages 256–264. ACM, 2008. [14] L. Geto or and C. P Diehl. Link mining: a surv ey . A CM SIGKDD Explor ations Newsletter , 7(2):3–12, 2005. [15] E. Gilbert and K. Karahalios. Predicting tie strength with so cial media. In Pr o c. of SIGCHI Conf. on Human F actors in Computing Systems , CHI ’09, pages 211–220, New Y ork, NY, USA, 2009. ACM. [16] P . Jaccard. The distribution of the flora in the alpine zone. New Phytolo gist , 11(2):37–50, F ebruary 1912. [17] J. Lesko vec, K. J. Lang, A. Dasgupta, and M. W. Mahoney . Statistical prop erties of comm unity structure in large so cial and information netw orks. In Pr o c. (17th) Inter. Conf. on World Wide Web , WWW ’08, pages 695–704, New Y ork, NY, USA, 2008. ACM. [18] M. Ley . The dblp computer science bibliography: Ev olution, research issues, p erspectives. In SPIRE , pages 1–10, 2002. [19] P . J. Mucha, T. Richardson, K. Macon, M. A. Porter, and J. P . Onnela. Communit y structure in time- dep enden t, m ultiscale, and multiplex netw orks. Sci- enc e , 328(5980):876–878, 2010. [20] J. Neville and D. Jensen. Lev eraging relational auto- correlation with latent group mo dels. In Pr o c. (4th) Inter. Workshop on Multi-r elational Mining , pages 49– 55. ACM, 2005. [21] M. E. J. Newman. Mo dularit y and comm unity structure in netw orks. Pr o c e e dings of the National A cademy of Scienc es of the Unite d States of Americ a , 103(23):8577–8696, 2006. [22] E. E. Papalexakis, L. Akoglu, and D. Ience. Do more views of a graph help? communit y detection and clustering in m ulti-graphs. In FUSION , pages 899–905, 2013. [23] P . P ons and M. Latapy . Computing communities in large netw orks using random walks. Journal of Gr aph Algorithms and Applic ations , 10(2):191–218, 2006. [24] M. Rocklin and A. Pinar. On clustering on graphs with m ultiple edge t yp es. Internet Mathematics , 9(1):82– 112, 2013. [25] R. A. Rossi, L. McDow ell, D. W. Aha, and J. Neville. T ransforming graph data for statistical relational learn- ing. J. Artif. Intel l. R es. (JAIR) , 45:363–441, 2012. [26] R. E. Sc hapire. The strength of weak learnabilit y . Machine L e arning , 5:197–227, 1990. [27] L. T ang, X. W ang, and H. Liu. Communit y detection via heterogeneous interaction analysis. Data Min. Know l. Disc ov. , 25(1):1–33, 2012. [28] W. T ang, Z. Lu, and I. S. Dhillon. Clustering with m ultiple graphs. In Pr o c. (2009) IEEE Int. Conf. on Data Mining , ICDM ’09, pages 1016–1021, W ashington, DC, USA, 2009. IEEE Computer So ciet y . [29] Y. W ang and G. W ong. Sto c hastic Block Models for Directed Graphs. Journal of the Americ an Statistic al Asso ciation , 82(397):8–19, 1987. [30] R. Xiang, J. Neville, and M. Rogati. Mo deling relation- ship strength in online so cial netw orks. In Pr o c. (19th) Int. Conf. on World Wide Web , WWW ’10, pages 981– 990, New Y ork, NY, USA, 2010. ACM.
Original Paper
Loading high-quality paper...
Comments & Academic Discussion
Loading comments...
Leave a Comment