Empirical modeling of the impact factor distribution
The distribution of impact factors has been modeled in the recent informetric literature using two-exponent law proposed by Mansilla et al. (2007). This paper shows that two distributions widely-used in economics, namely the Dagum and Singh-Maddala m…
Authors: Michal Brzezinski
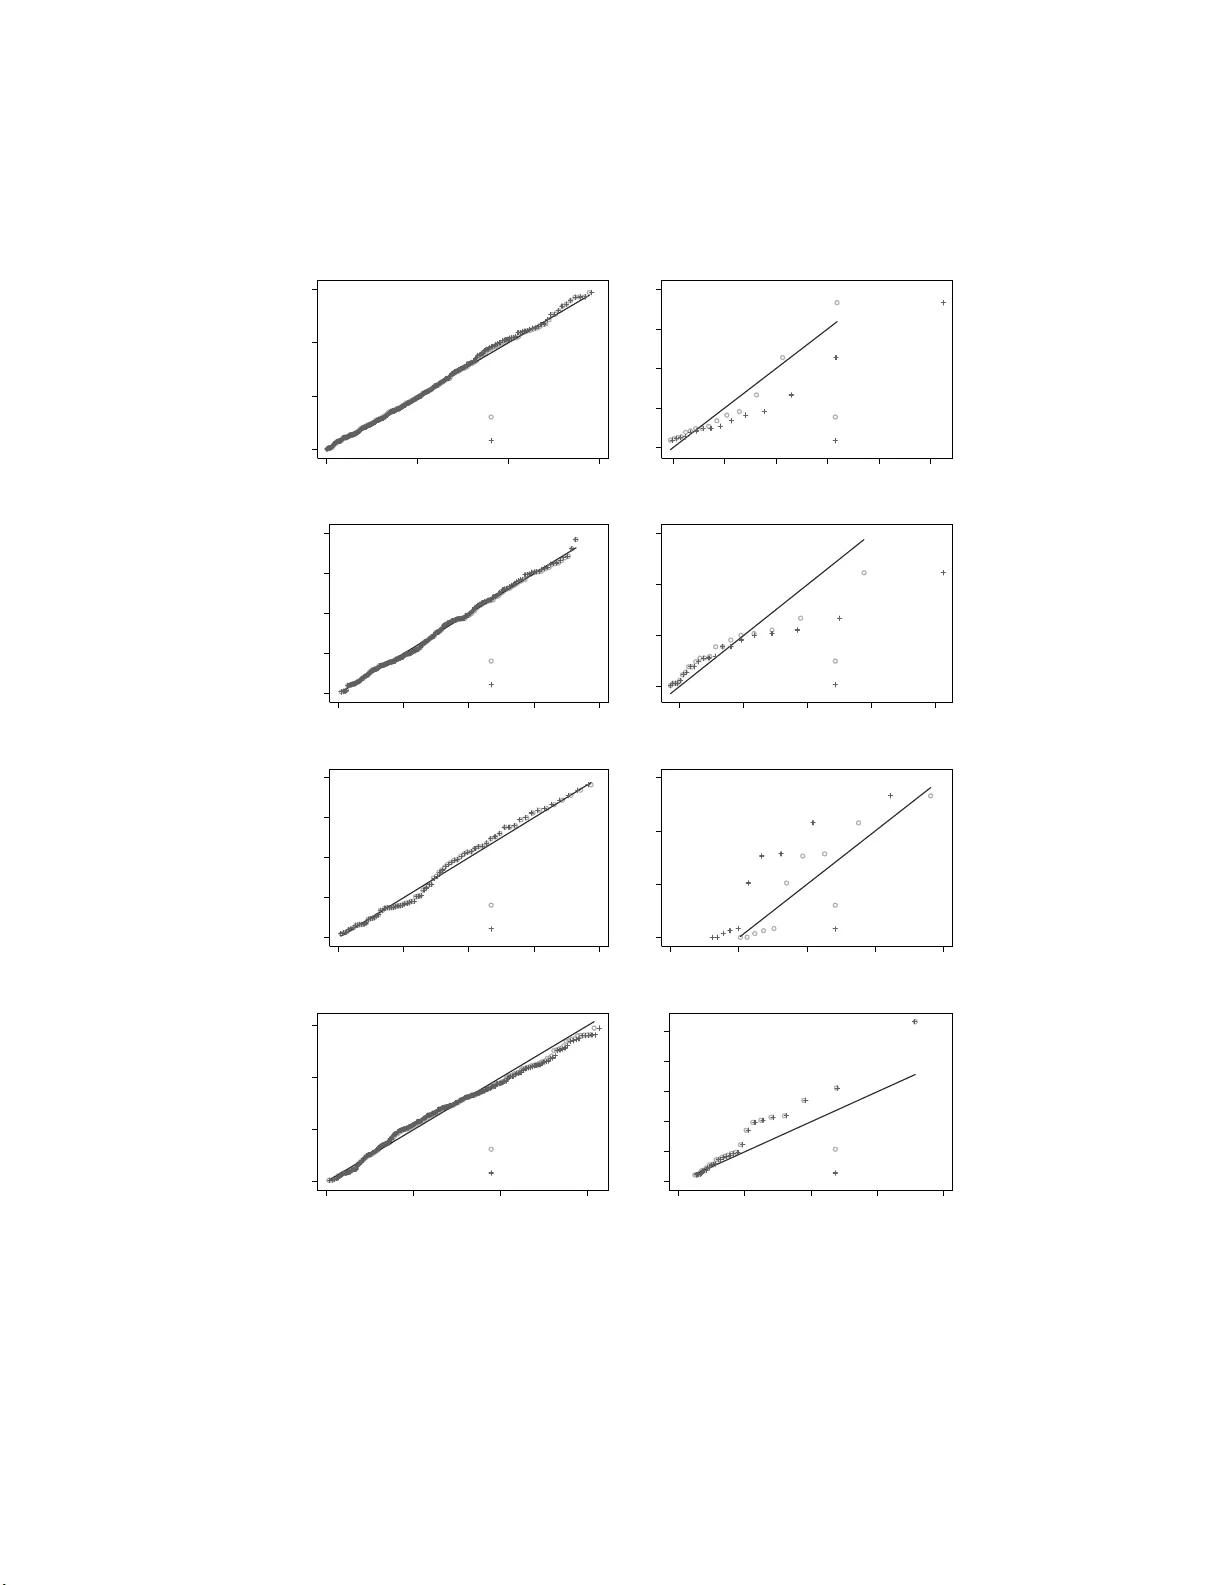
Empirical mo deling of the impact f actor di stribution Mic hal Brzezinski F aculty of Ec onomic Scienc es, Un iversity of Warsaw, Poland Abstract The distribution of impact factors has b een mo deled in the recen t info r- metric literature using tw o- exp onent law prop osed by Mansilla et al. (2007). This pap er sho ws that tw o distributions widely-used in economics, namely the D agum and Singh-Maddala mo dels, p ossess sev eral adv a ntages ov er the t w o-exp onent mo del. Compared to the latter, the former giv e a s go o d as or sligh tly b etter fit to data on impact factors in eigh t imp or t a n t scien tific fields. In contrast to the tw o-exp onent mo del, b oth pro p osed distributions ha v e closed-from probabilit y densit y functions and cum ulative distribution functions, which fa cilitates fitting these distributions to data and deriving their statistical prop erties. Keywor ds: impact factor, tw o- exp onent law, D agum mo del, Singh-Maddala mo del, maxim um lik eliho o d estimation, mo del selection 1. In tro duction The distribution of jo urnal impact factors has b een r ecently studied in the informetric literature from b oth theoretical and empirical p ersp ective s. Mansilla et al. (2007) prop osed the tw o -exp onen t la w to mo del rank-frequency distributions of impact factors. This mo del w as used b y Campanario (2 0 10) to study empirically changes in the distribution of impact factor s ov er time. A t heoretical deriv ation of the rank-frequency distribution of impact factors w as deriv ed b y Egghe (2009); see also Egghe (2 011) a nd Egghe & W altman Email addr ess: mb rzezin ski@wn e.uw.edu.pl (Michal Brzezinski) Pr eprint su bmitte d to Septemb er 15, 2018 (2011). 1 Mishra (2010) has fitted sev eral w ell-established statistical distribu- tions to data on impact f a ctors for journals from sev eral scien tific disciplines. The t wo-exponent la w in tro duced b y Mansilla et al. (2007) has been recen tly studied b y Sar abia et al. (201 2). The authors hav e obtained the probabilis- tic quan tile function corresp onding to t he t w o- expo nen t la w a s w ell as de- riv ed sev eral statistical measures and to ols asso ciated with this law like the momen ts, Lorenz and Leimkuhler curv es and the Gini index of inequalit y . Moreo v er, they fitted the t wo-exponen t la w to data on impact factors for eigh t science categories and found that the fit o f the mo del w as satisfactory . The presen t pap er con tributes to the lit erat ure on empirical mo deling of the journal impact factor distribution by verifying in a statistically rigorous w a y if the tw o - exp onen t la w is consisten t with data on impact factors. In particular, the pap er fits the tw o- expo nen t law do da ta using the maxim um lik eliho o d approa ch, whic h is more efficien t than the least squares approac h used in previous studies (Mansilla et al., 2007; Sarabia et al., 2012). The fit of the mo del to data is ev aluated using an appropria te go o dness-of-fit test. Finally , the t w o- expo nen t la w is compared to alternative mo dels using a lik eliho o d ratio test. As alternatives w e hav e chos en the Singh- Maddala and Dagum statistical mo dels (se e, e.g., Kleiber & Kot z, 2003), whic h are w idely- used in economics to mo del the distribution of income and other v ariables. 2 The analysis is p erformed fo r impact factors from eight scienc e categories studied previously by Sarabia et al. ( 2012). The reminder of the pa p er is structured as follows. Section 2 introduces definition and ba sic prop erties of the t w o-exp onent law and the compared alternativ e mo dels. Statistical tests used to assess go o dness of fit to data and tests used for mo del selection are presen ted as w ell. Section 3 describ es our data o n impact factors, while Section 4 presen ts a nd discusses empirical findings. Fina lly , Section 5 concludes. 1 W altman & V an E ck (2009) have criticiz e d the a pproach of Eg ghe (2009) from an empirical p oint of v iew. 2 These distributions, amo ng others, w er e previously used by Mishra (2010) to study the distribution of impact factor s. How ever, they were not co mpared with the t wo-exp onent mo del. 2 2. Metho ds 2.1. The two-e x p onent law versus Dagum and Singh- Mad d ala mo del s In order to mo del the distribution of impact facto r s, Mansilla et a l. (2007) in tro duced the tw o-exp onent la w in terms of rank-frequency distribution tak- ing the form: f ( r ) = K ( N + 1 − r ) b r a , (1) where a > 0, b > 0 are shap e parameters, K > 0 is a scale pa r a meter, N is the total n umber of sources (journals in the case of mo deling impact factors), r = 1 , 2 , ..., N is the ranking num b er and f ( r ) it the impact factor. If b = 0, then (1) reduces to Zipf ’s law (Egg he, 2005); if a = b it b ecomes the L av alette la w (La v a lette, 1996), and when a = 0 it becomes a pow er law. Sar abia et al. (2012) deriv e the quan t ile f unction that corresponds to the t w o- exp onent la w (1), whic h tak es t he form: F − 1 ( u ) = K u b (1 − u ) a , for 0 < u < 1 . (2) The distribution defined by (2) w as introduced in statistical literature b y Hankin & Lee (2006), who called it the Davie s distribution. Unfortunately , neither probability densit y function (p df ) nor cum ulative distribution func- tion (cdf ) fo r (2) is av ailable in closed form except for some sp ecial cases like the Zipf ’s law, t he p ow er la w or the La v a lette la w. Ho w ev er, they can b e calculated n umerically b y in ve rting the quan tile function (2). The Singh-Maddala a nd Dagum mo dels w ere introduced in economics in the con text o f mo deling income distribution b y , respectiv ely , Singh & Maddala (1976) and D agum (197 7). In statistics, these distributions a pp eared first in the system of distributions of Burr (1942) and ar e kno wn as Burr XI I distri- bution (Singh-Maddala) and Burr I I I distribution (D agum). F or the Singh- Maddala and Da gum distributions, the p dfs, cdfs and quantile functions are a v aila ble in closed forms. Sp ecifically , for a sample of p ositiv e impact factors in a giv en scien tific filed, x 1 , ..., x N , the cdf f o r t he Singh-Maddala distribu- tion is giv en b y: F ( x ) = 1 − h 1 + x b a i − q , (3) where a > 0, q > 0 are shap e parameters and b > 0 is a scale parameter. 3 The cdf for the Dagum distribution is F ( x ) = 1 + x b − a − p , (4) where a > 0, p > 0 are shap e parameters and b > 0 is a scale parameter. The Singh-Maddala and Dagum distributions are closely related in the fo llowing w a y: X ∼ D agum( a, b, p ) ⇐ ⇒ 1 X SM( a, 1 b , p )), where ∼ means “is distributed as”. The upper tail of the Singh- Maddala distribution is g o v erned b y t w o parameters ( a and q ), while the lo w er tail by a only (Kleib er , 1996). The opp osite holds for t he Dag um mo del (t wo parameters go ve rn the b ehaviour of the low er tail and only one shap es the upp er tail) a nd for this reason this mo del is more flexible in the low er tail. Therefore, the t w o mo dels can b e con- sidered complemen tary as they hav e adv an tages in mo deling differen t parts of the data. Theoretical prop erties of the Singh-Maddala and Da gum distri- butions are v ery w ell known ; see Kleib er (1996, 2008) and K leib er & K otz (2003) for a detailed discussion. 3 In particular, while Sarabia et a l. (2012) offer express ions for the Lorenz curv e a nd the Gini index of inequalit y for the t w o-exp onent distribution, in case of the Singh-Maddala and Dagum mo dels expressions for a wide v ariety of inequalit y measures exist (Kleib er & K o tz, 2003; Jenkins, 20 09). Moreo ve r, the conditions that allo w for testing Lorenz dominance (i.e. inference on inequalit y ro bust to the choice of an inequalit y measure) are av aila ble (Wilfling & Kr¨ amer, 1993; Kleib er , 1 996). When a = b the t w o- exp onent law b ecomes the Lav alette law (La v alette, 1996). As noticed by Sara bia et al. (20 1 2), the La v a lette la w is know n in the economic literature as the Fisk (or log-logistic) distribution. The F isk distribution is a sp ecial case of b o th the Singh-Maddala mo del (with q set t o 1) and the Dagum mo del (with p set to 1) . K leib er & Kotz (2003) discuss the prop erties of the Fisk distribution in more detail. The Singh-Maddala and Dagum distributions w ere sho wn to fit income distributions we ll. McDona ld (1984) studied t he fit of se ve ral three- and f o ur- parameter statistical mo dels to group ed income distribution da ta and found that the Singh-Maddala mo del p erformed b est among the three-parameter distributions and eve n b etter than one four-parameter distribution. Dastrup et al. 3 The Singh-Madda la and Dagum distributions ar e nested within a four- parameter Gen- eralized Beta of the Second Kind (GB2) model in tro duced b y McDonald (198 4). W e ha ve exp erimented with fitting this mo del to data on impact factors, but the g ains from the additional complexity w ere small. 4 (2007) found that f or the disposable income v ariable the Singh-Maddala mo del w as the b est-fitting distribution as often as the D agum distribu- tion in the gro up of three-parameter distributions. On the other hand, Bandourian et al. (2003) compared sev eral distributional mo dels for 8 2 data sets on gr o ss income da ta and f ound t ha t the Dagum mo del is t he b est three- parameter mo del in 84% of cases. 2.2. Estimation metho ds, go o dness -of-fit and mo d el s ele ction tests W e estimate a ll mo dels using maxim um likelih o o d (ML) estimation. The log-lik eliho o d functions for the Singh-Maddala and D agum mo dels are av ail- able in Kleib er & Kotz ( 2 003). The log- lik eliho o d for the tw o-exp onent mo del can b e calculated by nume rical in ve rsion of the quan tile function (2) (Hankin & Lee, 2006). Parameter estimates ar e obtained by numeric al max- imization of the log-like liho o d functions. The v a r ia nce mat rix is calculated as the negative in v erse o f the Hessian ev aluated at the parameter estimates. Sarabia et al. (2012) estimate the par ameters of the tw o- exp onen t la w using or dina r y least squares (O LS) approach, whic h w as earlier prop osed by Hankin & Lee (2006). Ho we ve r, Hankin & Lee (2006) sho w in a sim ulation study that the OLS a ppro ac h should b e used only when the exp onen ts a and b in (2) are equal. Since there is no theoretical reason to assume that, this pap er uses rather the ML approach to estimate the parameters and their v ariances of the t w o- exp onent law. 4 In o rder to assess whether our samples of impact facto r s are consisten t with a giv en statistical mo del, we follo w Clauset et al. (2009) in using a go o dness-of- fit test based on parametric b o otstrap approac h. In particular, w e use t he w ell-kno wn Ko lmo g oro v-Smirnov test defined b y: K S = max x F ( x ) − F ( x ; ˆ θ ) , (5) where F ( x ) is the cdf of the data , F ( x ; ˆ θ ) is the cdf of a t ested mo del and ˆ θ is the v ector of the mo del’s parameter estimates obtained, for example, using 4 Notice also tha t Sar abia et al. (2 012) estimate standar d erro rs for par a meter estimates of the tw o-exp onent mo del by dir e ctly taking the standard err ors fr o m the OLS reg ression of logg ed sample order statistics (or observed quant iles) o n their ex pected v alues. How ever, this a pproach do es not take into account the cov ariance betw een or der sta tistics a nd pro duces erroneous results. Ha nkin & Lee (2006) pro vide a correct method of calculating standard errors for para meters of (2) estimated using the OLS. 5 ML estimation. The distribution o f t he K S statistic is kno wn for data sets dra wn f rom a giv en mo del. Ho w ev er, whe n the underlying mo del is not kno wn or when its parameters are estimated from the data, whic h is the case studied in this pap er, the distribution of the K S must b e obtained b y sim ulation. The appropria te sim ulation is implemen t ed in the following w a y . F irst, w e fit a giv en mo del, F ( x ; θ ), to our data set obta ining a v ector of estimated parameters ˆ θ . Next, w e calculate a K S statistic for t he fitted mo del and denote it b y K S or g . Third, w e draw a large n umber, B , of synthe tic samples of t he o riginal size from a fitted mo del F ( x ; ˆ θ ). F or each sim ulated sample, w e fit the mo del F ( x ; θ ) and calculate its K S statistic denoted by K S b . Finally , the p - v alue for the t est is obtained as the prop ortion of K S b greater than K S or g . The hypothesis that our data set follows F ( x ; θ ) is rejected if the p -v alue is smaller than the c hosen threshold (set to 0.1 in this pap er). W e also compare formally whether the tw o- exp onen t law g iv es a b etter fit to the impact factor data than t he the Singh-Maddala and D agum dis- tributions. T o this aim, w e use t he likelih o o d r a tio test, whic h tests if the compared mo dels are equally close to the true mo del a g ainst the alternativ e that one is closer. The test computes t he loga rithm of the ratio of the lik eli- ho o ds of the data under t w o comp eting distributions, LR , whic h is negativ e or p ositiv e dep ending on whic h mo del fits data b etter. V uong (1989) sho w ed that in the case of non-nested mo dels t he normalized log- likelihoo d r a tio N LR = n − 1 / 2 LR/σ , where σ is the estimated standard deviation of LR , has a limit standard normal distribution. This result can b e used to compute a p -v alue for the test discriminating b etw een the comp eting mo dels. 3. Data W e use data o n impact factors f rom the la test av a ilable (2012) edition of Thompson Reuters Journal Citation Rep orts (JCR). F o llowing Sarabia et al. (2012), w e use impact factors for scien t ific journals b elonging to the follo w- ing scien tific fields: Chemistry , Economics, Education, Information Science and Library Science (abbreviated further as Infor ma t io n SLS), Mathemat- ics, Neurosciences, Psyc hology and Ph ysics. 5 W e ha v e remo v ed journals with 5 In some ca ses, we have group ed several JCR sub ject ca tegories in to o ne science cat- egory . F or example, our ca tegory “ Ma thematics” co nsists o f the following JCR sub ject categorie s: “Mathematical & Computational Biolog y”, “ Mathematics”, “Mathematics, Applied” and “Mathematics, Interdisciplinary Applications”. 6 zero impact factors from our samples. Descriptiv e statistics for our data sets are presen t ed in T able 1 . T a ble 1: Descriptive s ta tistics for the impa ct factors in eight scientific fields ( N denotes the num b er o f journals within a given field). Field N Mean Median Std. Dev. Gini Chemistry 513 2 .703 1.684 3.669 0.513 Economics 333 1 .062 0.795 0.922 0.440 Education 254 0 .868 0.679 0.686 0.404 Information SLS 84 1.001 0.755 0.928 0.465 Mathematics 573 0 .950 0.717 0.769 0.379 Neurosciences 252 3 .574 2.872 3.486 0.419 Psychology 556 1 .766 1.361 1.852 0.435 Physics 381 2 .535 1.400 4.514 0.568 Comparing our data with data used b y Sarabia et al. (2 012), we observ e that the num b er of journals indexed in JCR has increased b et w een JCR 2010 Edition and JCR 2012 edition for eac h science category analyzed; the increases lie in the range b etw een 5% a nd 20%. Other descriptiv e statistics are close to those rep orted by Sa rabia et al. (20 12). 4. Empirical results and discussion T able 2 presen ts results of fitting the t w o- exp onent la w to the data. Beside parameter estimates and their standard errors, w e g iv e a lso the v alue of log- lik eliho o d and the p -v a lue fro m the go o dness-of-fit test describ ed in Section 2.2. T a ble 2: Maxim um likeliho o d fits of the tw o- exp o nent law to data on impact factors in selected fields of science. Standar d errors in parentheses. Field K b a Log-likeliho o d p -v alue Chemistry 1.8972 (0.1371 ) 0.63 31 (0 .0459) 0 .4 997 (0.0372) -982.6 3 0.650 Economics 1.1403 (0.0892 ) 0.78 27 (0 .0618) 0 .3197 (0.0361) -343.1 9 0.615 Education 0.8453 (0.0791 ) 0.61 55 (0 .0615) 0 .3 334 (0.0448) -198.0 2 0.013 Information SLS 1.0 459 (0.1832 ) 0.83 0 8 (0 .1246) 0.3 466 (0.0841) -82.99 0.006 Mathematics 0.6730 (0.0377 ) 0.33 34 (0 .0290) 0 .4 386 (0.0337) -427.2 9 0.105 Neurosciences 3.4131 (0.2438 ) 0.63 86 (0 .0558) 0 .3 213 (0.0330) -549.7 5 0.002 Psychology 1.5840 (0.0845 ) 0.60 96 (0 .0384) 0 .3 577 (0.0278) -819.8 6 0.314 Physics 1.2452 (0.0827 ) 0.47 22 (0 .0388) 0 .5 965 (0.0444) -657.6 2 0.008 Our es timates of the parameters are in general close t o the OLS es timates obtained b y Sarabia et al. (20 12). Ho w ev er, our estimates of standard errors 7 are roughly one order higher than those o f Sarabia et al. ( 2 012). As p ointed out b efore, this is due to the fact that Sarabia et al. (2012) do not accoun t in their approach for the dep endence b etw een order statistics. F or this reason, their standard erro r s are sev erely underestimated. The go o dness-of-fit test used suggests that t he tw o-exp onent mo del is a plausible h yp othesis for impact factors of journals in Chemistry , Economics, Mathematics and Psyc holog y . W e can use o ur estimates to test for the La v alette law, whic h holds that a = b . Using W a ld test (see Sara bia et al., 2 012), w e cannot reject the h yp othesis that a = b at the 5% lev el for Mathematics and Ph ysics (with p -v alues equal to 0.063 and 0.075, resp ective ly). Also, the significance lev el of the test is close to 5% fo r Chemistry ( p -v alue = 0.048). F or other science categories, t he h yp othesis tested is rejected ev en at t he 1 % lev el. O ur results with respect to the La v alette law are inconsisten t with those of Sarabia et al. (2012), who found that the law was rejected for eac h of the science category studied. This inconsistency is due to the previously men tioned fact tha t Sarabia et al. (2012) substantially underestimated the v ariance o f the pa- rameter estimates of the t wo-exponen t law. T ables 3-4 presen ts our results of fitting the Singh-Maddala and Dagum mo dels. In most of the cases, the par a meters are estimated with sufficien t precision. There a re some exceptions, esp ecially in case of fitting the Singh- Maddala distribution to impact fa ctors for Economics, Education, and In- formation SLS. How ev er, ev en in t hese cases all three parameters a r e jointly differen t from zero in a statistically significant w a y . T a ble 3: Ma ximum lik eliho o d fits of the Singh-Maddala mo del to data on impact factors in selected fields of science. Standa rd errors in parentheses. Field a b q Log-likeliho o d p -v alue Chemistry 1.6208 (0.1030 ) 2.20 40 (0 .3789) 1 .3 613 (0.2477) -982.6 0 0.759 Economics 1.3534 (0.1004 ) 3.61 12 (2 .1859) 5 .5194 (3.4980) -341.6 4 0.916 Education 1.6679 (0.1536 ) 1.49 47 (0 .5821) 2 .8 249 (1.2977) -197.0 7 0.061 Information SLS 1.2 895 (0.1962 ) 3.12 7 1 (3 .8256) 4.7 948 (5.7605) -82.44 0.043 Mathematics 2.8287 (0.2140 ) 0.64 71 (0 .0602) 0 .7 957 (0.1303) -428.1 5 0.037 Neurosciences 1.7098 (0.1354 ) 4.83 04 (1 .1260) 2 .1 769 (0.5982) -552.0 7 0.001 Psychology 1.7595 (0.0980 ) 2.04 66 (0 .3225) 1 .8 321 (0.3432) -821.0 1 0.085 Physics 2.1123 (0.1623 ) 1.09 78 (0 .1274) 0 .7 382 (0.1133) -657.0 2 0.038 The go o dness-of-fit test suggests that b oth mo dels a re plausible for im- pact factors of journals in Chemistry and Economics. The Dag um mo del 8 T a ble 4: Maximum likelihoo d fits of the Dagum mo del to data on impact factors in selected fields of science. Standard erro rs in parentheses. Field a b p Lo g-likelihoo d p -v alue Chemistry 1.9727 (0.1454 ) 2.07 78 (0 .2616) 0 .7 701 (0.1191) -982.8 7 0.528 Economics 2.7042 (0.3041 ) 1.35 17 (0 .1585) 0 .4420 (0.0835) -344.5 6 0.648 Education 2.7038 (0.3170 ) 0.95 20 (0 .1276) 0 .5 702 (0.1248) -198.6 4 0.016 Information SLS 2.4 773 (0.7232 ) 1.24 7 4 (0 .4136) 0.4 605 (0.2290) -83.73 0.005 Mathematics 2.3283 (0.1400 ) 0.59 24 (0 .0704) 1 .4 299 (0.2592) -426.8 7 0.146 Neurosciences 3.0261 (0.3013 ) 4.18 31 (0 .3626) 0 .4 615 (0.0741) -547.6 3 0.014 Psychology 2.6482 (0.1986 ) 1.85 06 (0 .1547) 0 .5 701 (0.0775) -819.8 5 0.293 Physics 1.7539 (0.1255 ) 1.14 89 (0 .1890) 1 .2 473 (0.2334) -658.0 9 0.020 seems also to b e consisten t with data f or Mathematics and Psyc hology . The Singh-Maddala mo del has a higher probabilit y of b eing consisten t with data for Education, Information SLS, and Ph ysics than b oth the tw o- expo nen t la w and the Dag um mo del. Neither mo del seems to b e consisten t with dat a for Neurosciences. W e can also test for the Lav a lette la w ( F isk distribution) using fitted Singh-Maddala and Dagum mo dels. F or the Singh-Maddala mo del this amoun ts to testing the h yp o thesis that q = 1, while for the Dagum model the relev an t h yp othesis is that p = 1. Using W ald tests, w e hav e found that at the 5 % leve l b ot h the Singh- Maddala and Dagum mo dels can b e reduced to the Fisk distribution in case o f Chemistry and Mathematics. Moreov er, the Singh-Maddala mo del can b e reduced to the Fisk distribution in case of Eco- nomics, Education, and Information SLS, while the Dagum mo del reduces to the Fisk mo del in case of Ph ysics. 6 These results suggest that in mo deling the distribution of impact fa cto r s, the Lav alette law should b e treated as a serious alternativ e to t he three-parameter distributions, esp ecially fo r formal and natural sciences. The r esults of mo del selection tests based on the approach of V uong (1989) are rep orted in T able 5. The compared mo dels are empirically in- distinguishable for impact factors of jo urna ls in Chemistry , Mathematics, Psyc holog y a nd Ph ysics. F or Economics, Education, and Info rmation SLS, the Singh-Maddala mo del is pr eferred to b oth the tw o- expo nen t mo del and the D a gum mo del. Finally , the D agum distribution is preferred for data in 6 How ever, these results for the Singh-Maddala model may b e due to the previously discussed insufficient precision of the estimates for the parameter q . 9 Neurosciences . T a ble 5: Mo del selection tests for impact factor distributions, selected science fields. “A ≻ B” denotes that distribution A gives a b etter fit than distribution B. Positive v alues of LR indica te that the likelihoo d for the tw o-ex p one nt mo del is higher than the likeliho o d for the alternative. Science catego ry Two-exp. vs . Dagum Two-exp. vs. SM Conclusion LR p -v a lue LR p -v a lue Chemistry 0.237 0.483 -0.027 0.939 Distr ibutions are indistinguisha ble Economics 1.365 0.07 1 -1.554 0.094 Tw o- exp. ≻ Dag um, SM ≻ Two-exp. Education 0.623 0.184 -0.949 0.058 Two-exp. ≻ Dag um, SM ≻ Two-exp. Information SLS 0.746 0.022 -0.54 5 0.089 Tw o-exp. ≻ Dagum, SM ≻ Two-exp. Mathematics -0.416 0.336 0.864 0.117 Distributions are indistinguishable Neurosciences -2.115 0.005 2.322 0.020 Dagum ≻ Two-exp., Tw o-exp. ≻ SM Psychology -0.017 0.981 1.148 0.214 Distributions are indistinguishable Physics 0.472 0.234 -0.599 0.137 Distr ibutions are indistinguisha ble The mo dels can b e also compared visually using quantile-quan tile (q-q) plots. Figure 1 plots empirical quan tiles ve rsus theoretical quan tiles fo r t he t w o-exp onent la w and the b etter of t he tw o a lt ernativ es (Singh-Maddala or Dagum) for these cases, when results from T able 5 suggest that the t wo- exp o nen t law is worse fit to the data. If the estimated mo del fitted the data p erfectly , the q-q plot w ould coincide with the 45-degree line. Figure 1 sho ws that the differences b et we en compared mo dels are in general small. Ho we v er, it is clearly visible that t he tw o- exp onen t la w giv es a slightly worse fit in these cases, esp ecially for the highest quan tiles. Ov erall, b oth our formal tests a nd visual insp ection f rom the q-q plots suggest that compared to t he tw o-exp onent law, the Singh-Maddala and Dagum mo dels offer as go o d as or sligh tly better fit to dat a on impact facto r s. 5. Conclusions The distribution o f impact fa ctors ha s b een mo deled in the recen t in- formetric literature using the t w o-exp onent law pro p osed b y Mansilla et al. (2007). This pap er sho ws t hat tw o distributions widely-used in economics, namely the Singh-Maddala a nd D agum mo dels, p ossess sev eral adv an tages o v er the tw o-exp onent mo del. They are either empirically indistinguishable from the t wo-exponen t law o r g iv e sligh tly b etter fit t o da ta on impact fa c- tors in eigh t imp ortant scien tific fields. Con trary to Sarabia et al. (201 2), the presen t pap er a lso found that the Lav a lette law (L a v alette, 1996), whic h 10 0 1 2 3 Empirical quantiles 0 1 2 3 Theoretical quantiles SM Two−exponent Economics 3 4 5 6 7 Empirical quantiles 3 4 5 6 7 8 Theoretical quantiles SM Two−exponent Economics 0 .5 1 1.5 2 Empirical quantiles 0 .5 1 1.5 2 Theoretical quantiles SM Two−exponent Education 2 3 4 5 Empirical quantiles 2 3 4 5 6 Theoretical quantiles SM Two−exponent Education 0 .5 1 1.5 2 Empirical quantiles 0 .5 1 1.5 2 Theoretical quantiles SM Two−exponent Information SLS 2 3 4 5 Empirical quantiles 1 2 3 4 5 Theoretical quantiles SM Two−exponent Information SLS 0 2 4 6 Empirical quantiles 0 2 4 6 Theoretical quantiles Dagum Two−exponent Neurosciences 5 10 15 20 25 30 Empirical quantiles 5 10 15 20 25 Theoretical quantiles Dagum Two−exponent Neurosciences Figure 1: Qua n tile-qua n tile plots fo r the t wo-exp onent law vs. the b etter of the Singh- Maddala and Dagum mo dels. L e ft panels sho w b ottom and middle quantiles, rig ht panels show upp er qua ntiles. 11 is a sp ecial case of b oth the t w o- exp onent law and the Singh-Maddala and Dagum mo dels, often cannot b e rejected as an appropriate distribution fo r impact factors, esp ecially for forma l a nd natural sciences. In con trast to the t w o- exp onent mo del, b o th mo dels prop osed in this pap er ha v e closed-from probabilit y densit y functions and cumulativ e distri- bution functions. This adv an tage allows one to estimate mo del parameters in a more straigh tforward wa y without the need for numerical estimation of the mo del’s basic functions. There exists also a w ell-deve lop ed litera- ture (see, e.g., Kleib er & Kotz, 2003; Kleib er, 2008), that explores v arious theoretical pro p erties of the Singh-Maddala and Dagum distributions, in- cluding ready-made expressions f o r sev eral inequalit y measures as w ell a s conditions required for Lorenz ordering or sto c hastic dominance of v arious degrees. These prop erties ma y b e exploited in mo deling the distribution of impact factors a nd other informetric v ariables. F or these reasons, this pa- p er suggests t ha t the Singh-Maddala and D a gum mo dels are more useful for empirical mo deling of the distribution of journal impact factors than the t w o-exp onent la w. References Bandourian, R., McDonald, J. B., & T urley , R. S. (2 003). A comparison of parametric mo dels of income distribution across countries and o v er time. Estad ´ ıstic a , 55 , 135 –152. Burr, I. W. (194 2). Cum ulativ e frequency functions. The Annals of Mathe- matic al Statistics , 13 , 2 15–232. Campanario, J. M. (2010). Distribution of c hanges in impact factors ov er time. Sc ientometrics , 84 , 35–42. Clauset, A., Shalizi, C. R., & Newman, M. E. (2009) . P o we r- law distributions in empirical data. S IAM r evi e w , 51 , 661–7 03. Dagum, C. (19 7 7). A new mo del of p ersonal income distribution: Sp ecifica- tion and estimation. Ec onomi e Appliqu´ ee , 30 , 41 3–437. Dastrup, S. R., Hartshorn, R ., & McDonald, J. B. (2 0 07). The impact of taxes and transfer paymen ts on the distribution of income: A parametric comparison. The Journal of Ec onomic I ne quality , 5 , 35 3–369. 12 Egghe, L. (2 005). Power laws in the information pr o duction p r o c ess: L otkaian informetrics . Oxfor d: Elsevier. Egghe, L. (20 0 9). Mathematical deriv ation of the impact factor distribution. Journal of Informetrics , 3 , 2 90–295. Egghe, L. ( 2011). The impact factor rank-order distribution revisited. Sci- entometrics , 87 , 683–68 5. Egghe, L., & W altman, L. (2011 ). Relat io ns b et w een the shap e of a size- frequency distribution and the shap e of a rank-frequency distribution. In- formation Pr o c es sing & Managem ent , 47 , 238–2 4 5. Hankin, R. K., & Lee, A. (2006). A new fa mily of non-negativ e distributions. A ustr a l i a n & New Ze aland Journal of Statistics , 48 , 67–7 8. Jenkins, S. P . (2009). Distributionally-sensitiv e inequalit y indices and the GB2 income distribution. R eview of Inc om e and We alth , 55 , 392– 3 98. Kleib er, C. (199 6). D agum vs. Singh-Maddala income distributions. Ec o- nomics L e tters , 5 3 , 265–268. Kleib er, C. (20 08). A Guide to the Dagum Distribution. In D. Chotik a- panic h (Ed.), Mo del ling Inc ome D istributions and L or enz Curves: Essays in Memory o f C amilo Dagum (pp. 97–268). Berlin, New Y o rk: Springer. Kleib er, C., & Kotz, S. (2003). Statistic al size distributions in e c onomic s and actuarial scienc es . Hob oke n, NJ: John Wiley . La v a lette, D . (199 6). F acteur dimpact: impartia lit ´ e o u impuissance. Rep ort, INSERM U350, 91405, Orsa y (F rance): Institut Curie Reche rche , Bˆ at. 112. Mansilla, R., K¨ opp en, E., Co c ho, G., & Miramon tes, P . (2007). On t he b eha vior of journal impact factor rank-order distribution. Journal of In- formetrics , 1 , 155 –160. McDonald, J. B. (19 8 4). Some generalized functions for the size distribution of income. Ec o n ometric a , 52 , 647–66 3. Mishra, S. K. (2010). A note on empirical sample distribution of journal impact factors in ma jor discipline groups. Av ailable at: h ttp://works .b epress.com/sk mishra/8. 13 Sarabia, J. M., Prieto, F., & T rueba, C. (20 1 2). Mo deling the probabilistic distribution o f the impact facto r . Journal o f I nformetrics , 6 , 66–79 . Singh, S., & Maddala, G. ( 1 976). A function fo r size distribution of incomes. Ec onom e tric a , 44 , 9 63–970. V uong, Q. H. (1989 ). Lik eliho o d ratio tests for mo del selection a nd non- nested h yp otheses. Ec onometric a , 57 , 307– 333. W altman, L ., & V a n Ec k, N. J. ( 2 009). Some commen ts o n Egghe’s deriv ation of the impact factor distribution. Journal of Informetrics , 3 , 363– 366. Wilfling, B., & K r ¨ amer, W. (199 3). The Lorenz-ordering of Singh-Maddala income distributions. Ec onomics L etters , 43 , 53–5 7 . 14
Original Paper
Loading high-quality paper...
Comments & Academic Discussion
Loading comments...
Leave a Comment