Testing the isotropy of high energy cosmic rays using spherical needlets
For many decades, ultrahigh energy charged particles of unknown origin that can be observed from the ground have been a puzzle for particle physicists and astrophysicists. As an attempt to discriminate among several possible production scenarios, ast…
Authors: Gilles Fa"y, Jacques Delabrouille, Gerard Kerkyacharian
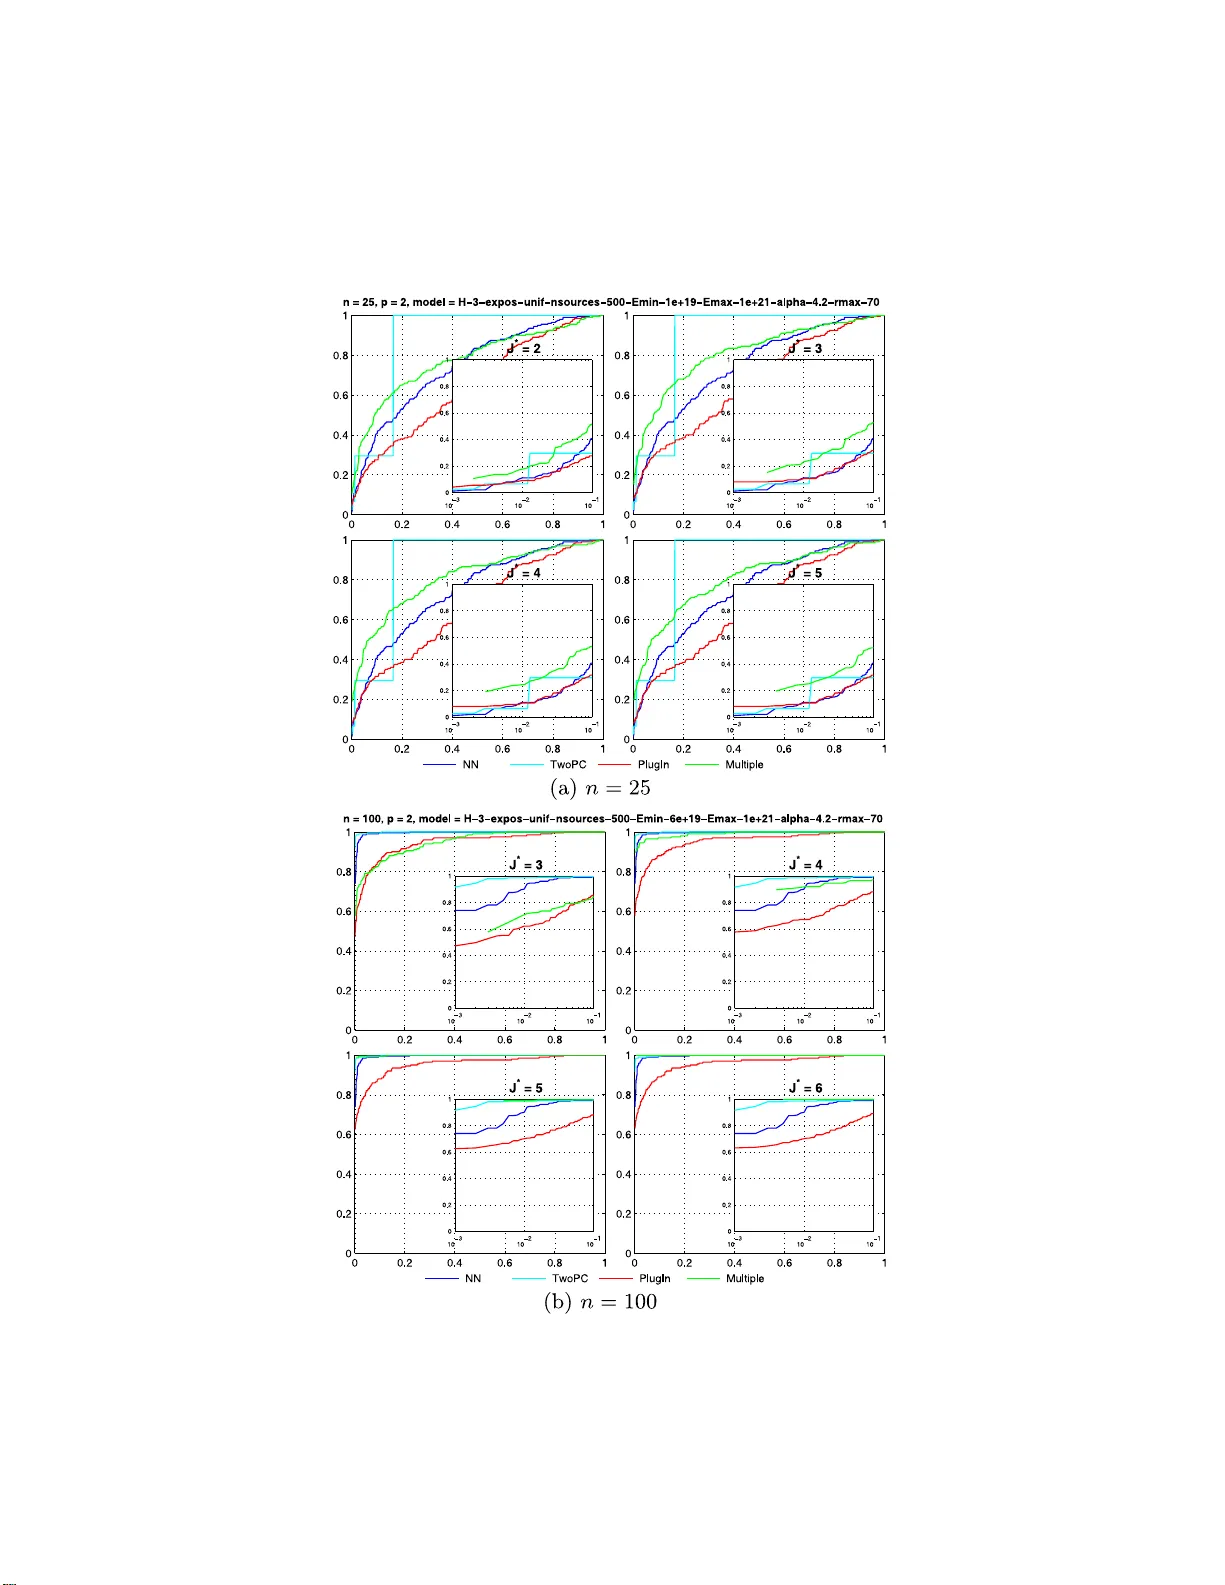
The Annals of Applie d Statistics 2013, V ol. 7, No. 2, 1040–107 3 DOI: 10.1214 /12-A OAS619 c Institute of Mathematical Statistics , 2 013 TESTING THE ISOTR OPY OF HIGH ENER GY COSMIC RA YS USING SPHERICAL NEEDL ETS By Gilles F a ¨ y, Jacques D elabrouille, G ´ erard Kerky acharian and Dominique Picard Ec ole Centr ale P aris, CNRS and Universit´ e Paris Di der ot, Universit´ e Paris Dider ot and Universit´ e Paris Di der ot F or many decades, ultrahigh energy charged particles of unk now n origin that can be observed from the ground hav e b een a puzzle for particle physicists and astrophysicists. As an attempt to d iscrimi- nate among sev eral p ossible p rod u ction scenarios, astro physicists try to test the statistical isotropy of th e directions of arriv al of these cos- mic ra ys. A t t he h ighest energies, they are supp osed to point tow ard their sources with go o d accuracy . H o w ever, the observ ations are so rare that testing the distribution of such samples of directional d ata on the sphere is nontrivial. In this paper, w e c ho ose a nonparametric framew ork that makes weak hyp otheses on the alternative distribu- tions and allo ws in turn to detect vari ous and possibly un exp ected forms of anisotrop y . W e exp lore t wo particular procedures. Both are derived from fitting the empirical distribution with wa velet expan- sions of densities. W e use th e wa velet frame introduced by [ SI A M J. Math. An al. 38 (2006b) 574–594 (electronic)], the so-called needlets. The expansions are truncated at scale indices no larger than some J ⋆ , and the L p distances b etw een t hose estimates and the null den- sit y are comput ed. One family of tests (called Mul tip le ) is based on the idea of testing the distance from t he n ull for eac h choice of J = 1 , . . . , J ⋆ , whereas the so-called PlugIn approach is based on the single full J ⋆ expansion, but with thresholded wa velet co efficien ts. W e describ e th e practical implementation of t hese tw o pro cedures and compare them to other metho ds in the literature. As alterna- tives to isotropy , w e consider b oth very simple toy models and more realistic nonisotropic mod els b ased on Physics -inspired sim ulations. The Monte Carlo study show s go o d p erformance of th e Mul tiple test, even at mo derate sample size, for a wide sample of alterna- tive hyp otheses and for different c hoices of the parameter J ⋆ . On the 69 most energetic events published by the Pierre Au ger Collab- oration, th e needlet-based procedu res suggest statistica l evidence for Received July 2011; revised D ecemb er 2012. Key wor ds and phr ases. Nonp arametric test, isotropy test, m u ltiple tests, ultrahigh en - ergy cosmic rays, wa velet proced ure. This is a n electro nic repr in t of the original article publis he d by the Institute o f Ma thematical Statis tics in The A nnals of Applie d Statistics , 2013, V ol. 7, No. 2, 1040– 1073 . This r eprint differs from the origina l in pagination and typog raphic detail. 1 2 F A ¨ Y, DELABROUILLE, KER KY ACHARIAN AND PICAR D anisotrop y . Using sev eral v alues for the p arameters of the meth ods, our pro cedures yield p -v alues b elow 1%, but with uncontrolled mul- tiplicit y issues. The flexibility of this method and the p ossibilit y to mod ify it to take into account a large v ariet y of ex tensions of t h e problem make it an interesting option for future inv estigation of the origin of ultrahigh energy cosmic rays. 1. In tro d uction. 1.1. Motivation. It is a common problem in astroph ysics to analyse data sets con taining measuremen ts of a num b er of ob jects (suc h as galaxies of a particular t yp e) or of ev en ts (suc h as cosmic ra ys or gamma ra y bu rsts) distributed on the celestial sphere. Each set of suc h ob jects or ev en ts can b e represent ed as a co llection of p ositions X i = ( θ i , φ i ) , i = 1 , . . . , n, in S th e u nit sphere of R 3 . In m any cases, su c h ob jects trace an und erlying p robabilit y distribution f on th e sphere, wh ic h itself dep ends on the physics whic h go v erns the pr o duction of the ob j ects and ev ents. Galaxies, for instance, form in ov er-densities of a preexisting s m o oth field of distrib ution of matter in the u niv erse, and the s tu dy of the s tatistics of their distrib ution has gro wn in to a field of astrophysics by itself [Mart ´ ınez and Saar ( 2002 )]. The case of u ltrah igh energy cosmic rays (UHECRs) is of particular in- terest, and is the main fo cus of the present wo rk. UHECRs are particles of unknown origin whic h arr iv e at the Earth fr om apparent ly r an d om direc- tions of the sky . These particles interact with atoms of the u p p er atmosphere, generating a h u ge cascade of billions of secondary particles. The observ ation of these s econdary particles with appropr iate d etectors on ground p ermits the measuremen t of the direction of arriv al and of the energy of the original cosmic ra y . The existence of cosmic rays h as b een known for ab out a cen tur y . Such particles exist w ith a v ery wide range of kinetic energies, from few eV to more than 10 20 eV. 1 Observe d cosmic rays are t ypically ordinary charged particles (electrons, pr otons and nuclei), propagating in empty space, and deflected b y galactic magnetic fields. The rate of observ ed cosmic rays in the vicinit y of the Earth , ho w ev er, decreases r apidly with energy . A t low energy , the observ ed cosmic ra ys are numerous and their comp osition is w ell kno wn . There also exist several kn o wn astrophysical p ro cesses resp on s ible for their acceleration, su c h as stellar w inds for the least energetic ones, to violen t ph enomena suc h as sup er n o v ae sho c k w av es at higher energy . At the highest energies ( E ≥ 10 20 eV), h o wev er, the observ ed flux is of the order of 1 eve n t p er squ are kilometre p er century , wh ic h limits the statistics of observ ed ev ents to few tens of ev en ts (in tw o decades of observ ations). In 1 1 eV = 1 electron V olt ≃ 1 . 6 × 10 − 19 Joule. TESTING THE ISOTROPY OF HIGH ENERGY COSMIC RA YS 3 addition, no un dersto o d astroph ys ical pro cess, inv olving kno w n ob jects, can accele rate p articles to suc h tremendous en er gies. Recen t observ ations of u ltrah igh energy cosmic r ays suggest that th ey are ordinary particles, suc h as protons and n u clei, accelerated in extremely violen t astrophysical ph enomena [see Kotera and Olin to ( 2011 ), for a r ecen t review on the astrophysics of UHECRs]. Ho wev er, man y alt ernate hyp othe- ses concerning their nature and origin ha ve b een p rop osed o ver the ye ars [see, e.g., Hillas ( 1984 ), T orres and Anc h ordo qui ( 2004 ), C ronin ( 2005 )]. UHE- CRs could originate f rom activ e gala ctic nuclei (A GN), or fr om neutron stars surroun ded by extremely high magnetic fields, or y et from m an y other p ro- cesses. It is also p ossible that the typ e and origin of u ltrahigh energy cosmic ra ys (at energies ab o ve 10 19 eV) dep end, at least to some exten t, up on the energy at wh ich they are observed. Indeed, the most energetic cosmic rays cannot propagate v ery far (i.e., not m uc h more than ∼ 100 Mp c) without losing most of their energy by in teractions with photons from the Cosmic Micro wa ve Bac kground [the so-called GZK effect; Greisen ( 1966 ), Zatsepin and Kuz’min ( 1966 )]. The confirmation of the energy cutoff at the high end of the cosmic ra y sp ectrum is one of the main achiev emen ts of the Pierre Auger Observ atory [ Abraham et al. ( 2008 , 2010b )]. Before the lo cation and physica l pro cess of acceleration hav e b een clearly iden tifi ed , taking in to acc oun t the fact that most of the evidence about the c hemical comp osition of cosmic r a ys at the highest energies rely on extrap olations of the p resen t knowledge of hadr onic interact ions at energie s t wo ord ers of magnitude ab o ve the range presently tested at the LHC, it is difficu lt to complete ly rule out alternate theoretical explanations as to what UHECRs exactly are and what is their origin. Alternate hypotheses suc h as pro du ction by deca y of long-liv ed relic particles from the Big Ba ng, ab out 13 billion y ears old [Bhattac harjee and S igl ( 2000 )], are just starting to b e disfa vored b y the observ ations of the Pierre Auger collab oration, w ith recen tly published r esults ab out primary photon limits that imp ose stringen t limits on th ese kind s of mo dels [Pierre Au ger Collaboration ( 2009 )]. In an attempt to b etter u nderstand the origin of such UHEC R s , physi- cists stu dy th e statistical distribution of their dir ections of arriv al, lo oking for tw o particular signatures. First, the (statistically signifi can t) arriv al of more than one UHEC R from the same dir ection on the sky w ould indicate that their pro duction is not lik ely to originate fr om s in gle time eve n ts (e.g., catastrophic mergers of t w o compact astrophysical ob jects), but rather from sources whic h emit UHECRs regularly . 2 Second, one may lo ok for correlation in the directions of arriv al of UHECRs w ith kno w n astrophysical ob jects, as 2 With the ca veat that the time of propagation may dep end on the energy and on the exact tra jectory follo wed by the UHECR to reach us, making it p ossible that tw o particles reac h ing the Earth at different times ha ve actually been emitted simultaneously . 4 F A ¨ Y, DELABROUILLE, KER KY ACHARIAN AND PICAR D nearb y activ e galactic nuclei, in an attempt to iden tify plausible pro du ction sites. Hence, in some hyp otheses, the und er lyin g probabilit y distribu tion for the directions of incidences of observed UHECRs would b e a fi nite sum of p oint -lik e sources—or n early p oin t-lik e, taking into account th e deflection of the cosmic ra ys b y magnetic fields . In other hypotheses, the distribu tion could b e uniform, or smo oth and correlated with th e lo cal distribu tion of matter in the unive rse. The distrib u tion could also b e a su p erp osition of the ab o ve. Distinguishin g b etw een these hyp otheses is of pr imordial imp ortance for understanding the origin and mechanism of pro duction of UHECRs. In the past 20 yea rs, a n umb er of exp erimen ts ha ve gathered observ a- tions of UHECRs, and sev eral pap ers hav e b een wr itten which lo ok for suc h features in the distrib ution of their directions of arriv al, with someti mes con- tradictory conclusions. The difficult y lies in the fact that UHECRs are rare and that they do not arriv e necessarily exactly fr om the direction w h ere their source is lo cated. Indeed, as typical cosmic ra y particles are charged (wh ic h p ermits their acce leration by electromagnetic pro cesses), they are deflected b y Galactic and in tergalactic magnetic fi elds. The deflection dep en ds on the length of the path through the magnetic field and on the energy and charge of the particle. In fact, only v ery energetic cosmic r a ys (ab o ve few 10 19 eV) with small c harge (e.g., p r otons or nuclei with small atomic num b ers) are exp ected to tra vel t ypical astroph ys ical d istances f rom their source to us with deflection angles smaller th an a few degrees. Details of the deflections are not kno wn, as neither the exact magnitude, orienta tion and regularit y on large scales of Galactic and extragalac tic m agnetic fields, nor the distance of the sources of UHECRs, nor the exact en er gy of the incoming cosmic ra y , nor its c harge (to within a factor of 26 b et ween protons and iron nuclei), are kn own. Errors on the direction of the source of an UHECR can then b e of ord er 1 ◦ at the lo w est (t ypical er r or on the measurement of the direction of arriv al with Auger), up to few degrees for protons, or tens of degrees for hea vy nuclei tra v elling a long path through a r egular galactic magnetic field. Giv en a set of observed UHECRs, ho w can one b est test for “rep eaters” (cosmic ra ys coming fr om the same source) or, more generally , anisotropy in the distribution? If one restricts the an alysis to the few ev en ts for whic h one is sur e that the deflectio n an gle is negligible, ev en ts are scarce and there are n ot enough statistics to conclude. As one selects ev ents with less energy , the direction of origin b ecomes less reliable, with the total num b er of even ts completely dominated by those ev en ts with p o orly constrained direction of origin. Finally , it is not clear how to b uild the isotropy test, without an y sound pr ior kn o wledge ab out the u ncertain ty in the measured direction of the sour ce. All of these are ve ry meaningful questions to analyze UHECR observ ations. Recen tly , an analysis of the direction of arr iv al of 27 UHECR s observed b y the Pierre Auger exp eriment concludes in the existence of an anisotropy TESTING THE ISOTROPY OF HIGH ENERGY COSMIC RA YS 5 and a correlation with ob jects in a catalog ue of nearby acti v e galactic nuclei (A GNs), lo cated at distances lo w er than ab out 70 Mp c 3 [Abraham et al. ( 2008 )]. This anisotrop y , ho w ever, is less obvious in a more recen t analysis, based on 69 observed even ts [Pierre Au ger Collab oration ( 2010 )]. Clearly , the statistics are limited, and the deve lopmen t of new metho ds for in v es- tigating this topic can provi de new in sigh ts on the origin of the UHECRs . Metho ds indep endent of external d ata sets suc h as the foremen tioned V CV catalo gue (whic h is not a stat istically w ell-c haracterized sample of AGNs but a compilation of published r esults) are of particular interest. 1.2. Outline of this work. This w ork fo cuses on the imp ortan t question of the isotrop y of the cosmic rays. Because of the small num b er of a v ailable data, this qu estion is not answ ered y et, although data from the Pierre Auger collaboration seems to hint at a correlation b et ween the d irections to the ultra-high energetic eve n ts (ab o ve 5 . 5 × 10 19 eV) and the directions to ac- tiv e galactic n uclei in the catal ogue compiled b y V ´ eron and C ett y-V ´ eron [see Pierre Auger Collab oration ( 2008 , 2010 )]. F rom a statistical p oin t of view, w e address the question of testing the go o dness of fit of the isotrop y assump- tion to this s mall sample of directional data. The framewo rk w e c ho ose is purely nonparametric, as we do not w ant to fa v our any particular alterna- tiv e hypothesis, and as we wish to b e able to discov er un exp ected forms of anisotrop y . The pap er is orga nized as follo ws. In S ection 2 w e p resen t a simplified mo del of cosmic ray pr opagatio n wh ic h will b e used in Mo n te Carlo simula- tions to test the method. In Section 3 we present the nonparametric frame- w ork. Then we describ e our n eedlet based anisotrop y tests in Section 4 . In Section 5 w e present a Mon te Carlo exp eriment that compares the p o wer of the differen t tests and also the robus tness of this p o wer with resp ect to the parameters of th e method s. W e apply our p r o cedures to real data from the Pierre Auger collaboration in Section 6 . W e then conclud e and giv e p ersp ec- tiv es for futur e extensions of the pr esen t wo rk. An onlin e su p plemen t [F a¨ y et al. ( 2013 )] is devot ed to a longer descrip tion of the type of wa vele ts we ha ve us ed (the needlets) and the p ractical and numerical imp lementat ion of our method s . More n umerical results are a v ailable there. 2. Sim u lating cosmic ra y emission. I n our inv estigation of to ols to anal- yse the distribution of UHEC R ev ents, we need a wa y to sim u late a d is- tribution of observ ed ev ents as a function of an underlying ph ysical mo del. A complete Mon te Carlo sim ulation of the ph ys ical pro cesses of cosmic ra y emission and propagation in th e magnetic fields is b ey ond the scop e of this 3 70 million parsecs ≃ 2 . 15 × 10 21 km. 6 F A ¨ Y, DELABROUILLE, KER KY ACHARIAN AND PICAR D pap er and to o d ep endent on a num b er of physica l assumptions f or wh ic h there is little a v ailable knowledge . W e decide to p erform qualitativ ely r el- ev ant simulatio ns using a simple, alt hough physica lly representati v e, to y mo del of cosmic ra y emission and propagation. 2.1. Cosmic r ay sour c es. In one hyp othesis ( H 0 ), w e w ill assume that cosmic ra ys are emitted fr om a uniform d istr ibution of man y sources, that is, their directions of arriv al are indep endent of the energy , and u niformly distributed on the celestial sph ere. In th e alternate hyp othesis ( H 1 ), w e w ill assume that n cosmic ra ys originate from a sm all n um b er n s of sources, distributed uniformly in a spher ical v olume V of univ erse, of radius r max = 70 Mp c. F or n s ≫ n , the distribu tion of directions of origin will b e close to uniform and ( H 1 ) ind istinguishable f r om ( H 0 ). F or n ≫ n s , and n s small, coincidences in the d irections of arriv al of the observed UHECRs will p ermit to ident ify easily the dir ections of the emitting sources. Our ob jectiv e is to address the issue w h en n s is comparable to the n u m b er of observ ed ev ents n . Sim ulations are p erformed as follo ws: • W e fix the n umb er n s of sources and distribute them uniformly in the v olume V . W e assume that all sour ces are ph y s ically iden tical, that is, they emit co smic r a ys with the same probabilit y and the same distribution in energy , the latte r coinciding with th e observ ed flux dN/dE . • W e fix th e num b er n of observed cosmic ra ys and draw at rand om their energies according to the distribution n ( E ) ∝ E − α , E ∈ [ E min , E max ], α > 0. • F or eac h observ ed cosmic r a y , we assign at random a corresp onding emit- ting source, according to a probabilit y density inv ersely prop ortional to the square of the distance D to the sour ce (sources nearer pro duce a larger flux on Earth). This p robabilit y d istribution can b e m o dulated b y the acceptance of the instrumen t for stud ying realistic test cases. F or in- stance, Pierre Auger Collab oration ( 2010 ) uses 69 highest energy ev en ts for the s earc h of correlations w ith astrophysica l sources, selected by a cut in zenith angle of arriv al ( θ zenith ≤ 60 ◦ ). Assuming homogeneous time co v erage in UT ov er the y ears of obser v ation, the exp osure is compu ted straigh tforwardly f rom simple ge ometrical consideratio ns [see Sommers ( 2001 ) and the details at the end of Section 2.2 ]. Th e map of Auger exp o- sure computed in th is wa y is displa yed in Figure 1 . The effect of th e GZK cutoff is tak en in to accoun t simply by limiting the v olume to a sphere of 70 Mp c radius. • F or eac h cosmic ra y , we m o dify the dir ection of arriv al due to extragalactic magnetic fields. The next subs ection describ es the mo del used to imple- men t these deflections. TESTING THE ISOTROPY OF HIGH ENERGY COSMIC RA YS 7 Fig. 1. Exp osur e f unction ε for the Pierr e Auge r Observatory in Galactic c o or dinates, r epr esente d thr ough a Mol lweide pr oje ction and c ompute d fr om ge ometric al c onsider ations [se e Sommers ( 2001 )]. The value of the exp osur e for some di r e ction is define d as the pr ob ability that an inc omi ng event fr om this di r e ction is actual ly dete cte d by the instrument. Se e Se ction 3.1 . 2.2. Defle ction by Galactic and extr agalactic magnetic fields. Gala ctic magnetic fi elds are an imp ortant comp onen t of the Galactic interstel lar medium (IS M). Th ey can b e pr ob ed in a v ariet y of wa ys. The impact of lo cal magnetic fi elds is obs er ved in the optica l w av elength range via starligh t p o- larizatio n. Indeed, elongated in terstellar dust grains in the foreground of the observ ed star, aligned p erp end icularly to magnetic field lines, absorb p ref- eren tially one d irection of starligh t p olarisation (along their ma j or axis). Measuremen ts of man y stars reve al a general picture of the magneti c field in the Milky W ay near the Sun [Heiles ( 1996 ), F osalba et al. ( 2002 )]. Aligned dust grains also emit p olarized infrared emission, whic h can b e used to in- fer magneti c fields in dust clouds [Beno ˆ ıt et al. ( 20 04 )]. Zeeman splitting of radio sp ectral lines allo ws for the direct measurement of relativ ely strong fields in n earb y , den s e gas clouds in the Milky W a y [Crutc h er et al. ( 2010 )]. On larger-scales, the magnetic fi eld of our Galaxy can b e pr ob ed in thr ee dimensions using F arada y rotation of pulsar signals [Han et al. ( 2006 )]. Fi- nally , syn c hrotron emission, emitted by relativistic electrons spiralling in the magnetic field, can b e u sed to constrain the directio n and amplitude of the magnetic field either fr om direct observ ation of the synchrotron p olarisation [P age et al. ( 2007 )] or by measuring the F arada y rotation of Galactic syn- c hr otron using multi -w av elength observ ations in the r adio range (b elo w few GHz) [Bec k ( 2011 )]. In the vicinit y of the Sun, the Galactic magnetic field has a typica l am- plitude of a few microGauss. Th is amplitude is t yp ically increasing with decreasing distance to wa rd the Galactic cente r, w h ere it can reac h v alues of a few tens of microGauss, and up to a few milliGauss in ve ry lo cal re- gions. In general, the regular comp onent o v er most of the outer Galaxy is of the order of a few microGauss, aligned along the Galac tic plane. The o v er- all field stru cture follo ws the optical spir al arms, with evidence for at least 8 F A ¨ Y, DELABROUILLE, KER KY ACHARIAN AND PICAR D one large- scale field r eversal in the d isk, in s ide the solar radius, and sev eral distortions near star-forming regions. F or the pu rp ose of estimating their impact on the d eflection of h igh en- ergy cosmic rays, Galactic magnetic fields are t ypically mod eled as the s u m of t wo comp onen ts with d ifferen t physical prop erties, a regular comp onent and a tur b ulen t compon ent. Th e r egular co mp onent rough ly follo ws the spiral arms of the Galaxy and induces deflections typicall y p erp end icular to the Galacti c plane, that is, d efl ections in latit ude of arriv al. Th e tu r- bulent comp onen t induces random deflections, wh ic h can b e mo deled as t wo- dimensional Gaussian d istributions cente red at the s ou r ce. Indeed, we assume that suc h d eflections are made of the sup erp osition of many inde- p endent small defl ections by indep endent regions with indep end en t magnetic field dir ections, so that th e Gaussian h y p othesis is justifi ed by the cen tral limit theorem. W e consider only cases in whic h the tota l deflection is small enough that th e pro j ection to the spher e is irr elev ant (as we ll as the trun- cation of angles to 2 π ). T ypical d eflections for atomic nuclei are as follo w s [Harari, Mollerac h and Roulet ( 2002 )]. F or the regular component (magnetic lensing effect), δ reg = 3 . 25 ◦ 10 20 eV E / Z B 2 µ G r 3 kp c , (1) where E is the energy of the UHEC R in eV, Z is the atomic num b er [e.g., 1 for h ydrogen nuclei (protons), 2 for Helium nuclei (alpha articles), etc.], B is the magneti c field in microGauss ( µ G), and r th e propagation length of the cosmic ra y in the magnetic fi eld. The deflection is assumed deterministic (although energy-dep endent) , an d the instan taneous directio n of the d eflec- tion is along ~ v × ~ B , w h ere ~ v is the ve lo cit y of the incoming particle and ~ B the r egular Galactic magnetic fi eld, assumed to b e along the y -axis of the Galacti c coord inate s ystem. F or the turbu len t co mp onent (rand om d efl ection), δ turb = 0 . 56 ◦ 10 20 eV E / Z B 4 µ G r r 3 kp c s L gal 50 p c . (2) The d eflection is Gaussian distributed with a standard deviation δ turb and uniform distribu tion of the direction of the deviation in [0 , 2 π [ . T he deflec- tions are written in terms of the t ypical exp ected v alues for the m agnetic field (2 µ G for the regular p art and 4 µ G for the tu rbulent part), for coher- ence length L gal of the turbulent p art of the Galactic magnetic field (about 50 p c). 3 kp c is the t ypical propagation length r inside the Galactic mag- netic fi eld for a cosmic ra y coming p erp endicularly to the Galaxy . A plane parallel app r o ximation of the disc-shap ed geometry of the Milky W a y su g- gests a d ep endence of r with th e Galactic latitude b of th e incoming cosmic TESTING THE ISOTROPY OF HIGH ENERGY COSMIC RA YS 9 ra y . W e assu me here a dep end en ce r ∝ 1 / sin b , with a maxim u m length of 10 kp c, typical of the size of the Gala ctic disk. Extragalact ic magnetic fields also deflect cosmic ra ys originat ing from distan t lo cations in the Univ erse. These deflections are exp ected to b e qual- itativ ely similar to those due to th e tu r bulent part of the Galactic magnetic field, except that typical field strengths are smaller (and less well k n o wn ) and correlation lengths are larger. F ollo win g T h e Pierre Auger col lab oration [Pierre Auger C ollab oration ( 2008 )], w e assu me a deflection with stand ard deviation giv en b y δ ext = 2 . 4 ◦ 10 20 eV E / Z B 1 nG s D 100 Mp c s L ext 50 p c . (3) UHECRs are observed to arriv e on Earth with a flu x dN /dE prop ortional to E − 4 . 2 for energies E > 4 × 10 19 eV [Abraham et al. ( 2008 )]. Although the shap e of the sp ectrum is n ot very w ell constrained in this region (more recen t Auger results su ggest a sp ectral index closer to − 4 . 3), the exact shap e of the sp ectrum does not ha v e a s trong imp act on the v alidit y of our analysis. Our sim ulations will assume such a d istribution, with v arious v alues for the min im u m energy E min and E max = 10 21 eV. W e fo cus on v ery energetic UHECRs ( E > 10 19 eV) and assume UHECRs are ligh t nuclei ( Z ≈ 1 ), for whic h deflectio ns by magnetic fi elds are exp ected to b e of the order of a few degrees. W e then implemen t cosmic ra y d eflections according to equation ( 3 ) (first the cosmic ra y tra vels in th e in tergalactic medium) and then using b oth equations ( 1 ) and ( 2 ). As the exact nature of the cosmic ra ys has little impact on the general principles of our m etho d, except that a c hange in atomic num b er induces a c hange in the scale of the deflections, w e hav e assumed here for simplicit y that all cosmic ra ys are protons (i.e., Z = 1 ). This, ho wev er, as a further r efinemen t, can b e easily c h anged for p ractical application on r eal data sets. In particular, the pr esence or lack of anisotrop y in the dir ections of arriv al of the highest energy cosmic ra ys may help shed ligh t on the nature of these particles, as iron n uclei, for instance, are more deflected b y magneti c fields than protons, by a facto r Z iron = 26. This is an imp ortant p oint to take into account in view of recent Au ger results that seem to indicate a low pr oton fraction at energy ab ov e 10 18 eV, so that the cosmic rays at those energies migh t b e essenti ally h ea vier nuclei [Abraham et al. ( 2010a )]. Figure 2 illustrates simulate d outcomes in t w o extreme cases: few sources and man y cosmic rays (right) and man y sources and few cosmic r ays (left). In p ractice, in struments ob s erv e the sky unev enly . The capabilit y of the instrument to ob s erv e in a particular direction of the sky d ep ends on the field of view of the instrum ent and on th e orien tation of the in s trument 10 F A ¨ Y, DELABROUILLE, KER KY ACHARIAN AND PICAR D Fig. 2. Two simulations of the physic al mo del describ e d in Se ction 2 , wi th α = 4 . 2 , E min = 4 × 10 19 , E max = 10 21 . On the left, the numb er of sour c es is n s = 1000 and the numb er of observations is n = 1 00 . On the right, n s = 100 and n = 1000 . It app e ars i n this latter c ase that clusters of events ar e of differ ent typic al angular size. with resp ect to th e sky (w h ic h itself dep ends on the sid ereal time). F r om the prop erties of the instrument and the geometry of the observ ations, one can inf er an equiv alen t observing time as a f unction of d irection on the sky , that is, a function on the sph ere that mo dulates the probabilit y of detection of the observed cosmic ra ys. As an illustration, w e hav e displa y ed on Fig- ure 1 a Mollw eide pro jection of the exp osure map asso ciated with the Pierre Auger O b serv atory , in Galactic co ordinates, computed follo w in g Section 2 in Sommers ( 2001 ). This exp osure m ap has b een generated assumin g a max- im u m accepted zenith angle for incoming cosmic ra ys of θ zenith = 60 ◦ and uniform d istribution of obs er v ation p erio ds in u niv ers al time (and hence, an exp osure th at d ep ends exclusive ly of the declination, not the righ t ascen- sion, in equatorial co ordinates). The effec t of the precession of equ in o xes has b een neglected for ge nerating this exp osure map (the p erturbations it would generate are very tiny as compared to wh at we can measure w ith ab ou t 100 ev ents, as curr ently a v ailable). 3. Nonparametric tests on the sphere. 3.1. Intr o duction. W e assume that the cosmic ra ys arriv e on Earth along a directional d ensit y h . W e need to test ( H 0 ) : h ≡ h 0 against ( H 1 ) : h 6≡ h 0 , ( T 1 ) where h 0 is the density under the null. F or the ab ov e-men tioned reasons, w e focus on test f or anisotrop y , th en w e c ho ose h 0 ≡ 1 4 π . Note, ho wev er, that the whole subsequen t setup can handle anisotropic c h oices for the null distribution. T o tak e in to accoun t the nonuniform angular acceptance in the observ ation mo del, w e mo del the exp osure of the instrument by a kno wn and arbitrary function ε : S → [0 , 1]. In th is setting, we assume that incoming ev ents from direction ξ ∈ S ha ve p r obabilit y ε ( ξ ) to b e obs er ved b y the TESTING THE ISOTROPY OF HIGH ENERGY COSMIC RA YS 11 instrument. In this case, the observed in ciden tal dir ections are distrib u ted along a d ensit y f whic h is prop ortional to εh : f ( ξ ) = ε ( ξ ) h ( ξ ) R S ε ( ξ ′ ) h ( ξ ′ ) d ξ ′ · (4) Under the null, the observe d directions of cosmic ra ys ha v e a densit y g ( ξ ) = ε ( ξ ) h 0 ( ξ ) R S ε ( ξ ′ ) h 0 ( ξ ′ ) d ξ ′ · Let ( X 1 , . . . , X n ) b e an n samp le of i.i.d. rand om p ositions on the tw o- dimensional sphere with pr obabilit y densit y fu n ction f . In order to test for isotrop y of the un d erlying ph ysical phenomenon in this observ ational con text, we need to implemen t the test ( H 0 ) : f ≡ g against ( H 1 ) : f 6≡ g . ( T 2 ) On the real line, testing f or f ≡ g can b e reformulate d as testing for the uniform d istribution of the sample G ( X 1 ) , . . . , G ( X n ) on [0 , 1], where G is the distribution f unction asso ciated with the probabilit y d ensit y g . F or higher dimensions (as on the sph ere), there is no natural transform ation of the data, no n otion of distribu tion function for d irectional data, that allo ws to recast ( T 2 ) as ( T 1 ). Th en we consider ( T 2 ) in its generalit y , with ( T 1 ) as a particular case. Our aim in this p ap er is to pr o vide test algorithms w hic h are at the same time easy to implement , efficien t in practical situations where the sample size is small (a few tens) and the data ma y b e co llected in a nonuniform or incomplete w a y , but also with prop erties that are lik ely to b e optimal from a theoretic al p oint of view. Let us b egin with a short review on nonparametric tests asso ciated to function estimat ion, since this will inspir e our study in man y wa ys. 3.2. Anisot r opy tests among gener al nonp ar ametric tests. The test prob- lem is w ell p osed when the alternativ e is giv en. More often in practice it is wiser to consider a la rge n onparametric class of alternativ es. T o allo w deriv a- tion of optimalit y prop erties, follo w in g stand ard p oint of view in a nonp ara- metric framew ork [see, e.g., Ingster and S uslina ( 2003 ), Ingster ( 19 93 ), Bu- tucea and T rib ouley ( 2006 )], we shall consid er smo oth alternativ es of the form ( H 1 ,n ) : f ∈ F n ( d, C ) , (5) where F n ( d, C ) = { g ′ ∈ R : d ( g ′ z , g ) > C r n } (6) 12 F A ¨ Y, DELABROUILLE, KER KY ACHARIAN AND PICAR D and R is a class of regularit y , that con tains, for example, all the t wice con- tin u ou s ly differentia ble densities or densities satisfying the H¨ older condition with H¨ older exp onen t s > 0 . W e ma y consider balls in Sob olev or Beso v spaces (see b elo w). Here, d is a (semi-) distance b et we en densities an d r n is referred to as a sep ar ation r ate . Rough ly sp eaking, d and r n , resp ectiv ely , define the shap e and the size of the neigh b ourh o o d of the density under the n u ll whic h is excluded fr om the alternativ e set of densities. The multiplica- tiv e constant C allo w s to defi ne the concept of critical s ep aration rate; s ee equations ( 9 ) and ( 1 0 ) b elo w. The c hoice of suc h alternative s is essentia l for th e test p r o cedure b ecause the test stati stics are bu ilt, more or less, on estima tors of d ( f , g ) . F or s ome particular distances, nonparametric estimators ˆ f of the d ensit y of the ob- serv ed sample ma y b e plugged into the distance, namely , ˆ d ( f , g ) = d ( ˆ f , g ) . F or instance, ˆ f could b e a histogram-lik e (pixel-wise constan t) densit y esti- mate of f based on coun ting ev ents falling in an y pixel of a giv en tessellatio n { V k } k =1 ,...,K of the sph ere, namely , ˆ f = 1 n K X k =1 # { X i ∈ V k , i = 1 , . . . , n } 1 V k µ ( V k ) and th e decision could b e tak en on the v alue of d ( ˆ f , g ) = k ˆ f − g k 2 , s a y . Nev- ertheless, as describ ed in Ingster ( 2000 ), suc h “plug-in” pro cedur es are not alw a ys optimal in terms of r ates of separation (see Section 4.2 for a more precise statemen t). I n con trast, multiple tests h a ve n ice theoretical (mini- max optimalit y and adaptivit y) prop erties in v arious con texts: detection in a w hite n oise mo del [Sp oko iny ( 1996 )], χ 2 test of un iformit y on [0 , 1] [Ing- ster ( 2000 )], goo dn ess-of-fit test and mo del sele ction for random v ariables on the r eal line [F romon t and Lau r en t ( 2006 )], t wo-sa mple homogeneit y tests [Butucea and T rib ouley ( 2006 )], for instance. Note that one w ould also lik e to test for uniformity by taking int o accoun t the uncertaint y on th e mea- surements of the directional data. In a firs t appro ximation, this err or can b e mo deled as a con v olution noise: the observ ations are Z i = ε i X i , i = 1 , . . . , n, where ε 1 , . . . , ε n is an i.i.d. sequen ce of random rotations in SO(3). Lacour and Pham Ngoc ( 2012 ) addressed the problem of testing for the isotropy ( X 1 , . . . , X n ) in the particular case of a full-sky co ve r age with u niform ex- p osure and from n oisy observ ation (random rotations of the directions). As a consequence of the uniform co verage , their adaptive testing p ro cedure is ideally constructed on the m ultip ole m omen ts of the observ ations. If one has str ong p rior inf ormation, it is p ossible to construct tests that are not uniform except along a few set of d ir ections, b ut which can ha v e as TESTING THE ISOTROPY OF HIGH ENERGY COSMIC RA YS 13 m u c h p o wer as p ossible at the n − 1 / 2 scale in those few directions of in terest. This framew ork is introdu ced in Bic k el, Rito v and Stok er ( 2006 ) and applied in Bic k el, Kleijn and Rice ( 2008 ) for detecting p erio d icit y in a sequence of photon arriv al times. In our con text, those directions are describ ed by the Beso v regularit y of th e alternativ e d en sit y , wh ic h is efficientl y handled by the formalism of the w a vele t analysis. In the follo wing paragraphs we discuss the v arious ingredien ts of our stud y . 3.2.1. Distanc es. W e will consider standard distances of functions on the sphere, although ther e is in fact n o clear c hoice for a ’go o d’ d istance in this framework: L 1 distance is generally more appr opriate for p robabil- it y d ensities, but L p distances wh en p is increasing and esp ecially L ∞ are more and more sens itiv e to bumps . As it is b oth usual and practica l, w e will mainly consider the L 2 distance (with resp ect to the inv arian t measure on the sph ere). Bu t, w e will also consid er expr essing our results for other L p distances suc h as L 1 and L ∞ . It is imp ortan t to notice that it is the remark able abilit y to concen trate the needlets that enables u s to consider v arious distances. More tr ad itional bases would only allo w the L 2 distance and w ould then b e m uch less sensitiv e to local change s. 3.2.2. Sep ar ation r ate. Let T ( X 1 , . . . , X n ) ∈ { 0 , 1 } b e a nonrandomized decision, that is, a measurable function of the sample ( X 1 , . . . , X n ) with v alue in { 0 , 1 } . The dep endence in n is omitted in most of our n otation. As usual the ev en t [ T = 1] is equiv alen t to the rejection of the n ull h yp othesis. The probabilit y of error of the fi rst kind (false p ositiv e) of the d ecision is denoted α n ( T ) = P g ( T = 1) , (7) while probabilit y of error of the second kind (false negati v e) against the alternativ e ( 5 ) is β n ( T , C ) = sup f ∈F n ( d,C ) P f ( T = 0) . (8) Here P f , P g denote th e probabilit y measure un d er the dens it y f or g for the i.i.d. sample ( X 1 , . . . , X n ). F orm ally , the separation rate is d efi ned using the follo wing minimax op- timalit y criterion. A sequence r n is a minimax r ate of testing [see Ingster ( 2000 )] if the follo wing statemen ts are s atisfied: 1. F or any r ′ n suc h that r ′ n /r n → 0 as n → ∞ , lim inf n →∞ inf T { α n ( T ) + β n ( T , 1) } = 1 , (9) where the infimum is tak en on all decision r ules, that is, { 0 , 1 } -v alued mea- surable functions of the sample ( X 1 , . . . , X n ). 14 F A ¨ Y, DELABROUILLE, KER KY ACHARIAN AND PICAR D 2. F or any α , β > 0, there exist some constan t C > 0 and a test s tatistic T ∗ (said r ate optimal in the minimax sense ), suc h that lim sup n →∞ α n ( T ∗ ) ≤ α and lim sup n →∞ β n ( T ∗ , C ) ≤ β . (10) Condition ( 9 ) sa ys that if the separation rate v anish es faster th at r n , then no test can do b etter than the blind random decision, for wh ich the sum of the errors of the tw o kinds is exactly 1. Con d ition ( 10 ) sa ys that there exists a d ecision that is efficient for suc h a separation rate, so that this rate is indeed a critical rate. It is clear that a go o d test b ecome sensitiv e to a closer and clo ser al- ternativ e hypothesis ( H 1 ,n ) when the samp le size n gro ws. T h e notatio n of critical r ad iu s giv es a p recise and quan titativ e d escription of this b ehavio u r. The rate r n = 1 / √ n is the usu al rate in th e regular parametric setting. 3.2.3. Invarianc e pr op erties. As the uniform distrib u tion is in v arian t un- der rotations of the sp here, the theory of inv arian t tests [see Lehmann and Romano ( 2005 ), Chapter 6] leads to imp ose the s ame kind of inv ariance on an y statistical pro cedur e for testing isotrop y [see, e.g., Gin ´ e M. ( 1975 ) and the r eferences therein]. As b ases of in v arian t subspaces un der rotations, the spherical h armonics are th u s the most natural tools to detect some deviation from isotrop y as in problem ( T 1 ). Ho we v er, as explained earlier, a common prop erty of astroph ysical observ ation of (p oint or con tinuous) pro cesses on the sp here is the n onuniform co verage of the sky by the instru m en t. It is common also that some parts of the data are miss ing or so n oisy that it is pr eferable to completely ignore or mask them. T hat is why nonin v arian t approac hes must b e considered, and lo calized analysis fun ctions (su ch as w av elets) ma y b e used as alternativ es to sp herical harmonics. In the same spirit, w a vele ts ha ve b een prop osed in the context of the angular p o wer sp ec- trum estimation by Baldi et al. ( 2009b ) and used in the realistic case of a partially observe d stationary pr o cess with heterosce d astic noise in F a¨ y et al. ( 2008 ) and F a¨ y and Guillo ux ( 2011 ). 3.2.4. R e gu larity c onditions: Be sov sp ac es on the spher e. Although this is not directly the purp ose of this pap er, it is a natural question to ask whic h kind of regularit y spaces our p ro cedures are d esigned for. The p rob- lem of choosing appropriate spaces of regularit y on the sph er e is a serious question, and it is imp ortant to consider the spaces wh ic h generalize u sual appro ximation p rop erties. On the other hand , w e are in terested in s p aces of fu nctions w h ic h can b e c haracterized by their needlet co efficien ts { β j k } asso ciated to a n eedlet frame { ψ j k } (where j denotes the s cale and k the p osition; s ee th e online s u pplement [F a ¨ y et al. ( 2013 )] for the precise d efi - nitions). Hence, as is standard in the n onparametric literature, it is n atural TESTING THE ISOTROPY OF HIGH ENERGY COSMIC RA YS 15 to consid er Beso v b o d ies constructed on the needlet basis. In m an y situa- tions (not only the s phere) it can b e pr o ve d that these sp aces can also b e describ ed as app ro ximation spaces, so they h a ve a gen u ine meaning and can b e compared to Sob olev spaces. W e define here the Beso v b o dy B s pq as the space of fu nctions f = (4 π ) − 1 R S f d µ + P j ≥ 0 P k ∈K j β j,k ψ j,k suc h that X j ≥ 0 2 j sq X k ∈K j ( | β j,k |k ψ j,k k p ) p q /p < ∞ (with th e ob v ious mo difications for the ca ses p or q = ∞ ). Details on Beso v spaces and their c haracterization b y w a ve lets can b e foun d in T rieb el ( 1992 ) and Mey er ( 1992 ). F or details on the relations b et ween needlets and Beso v spaces w e r efer, for instance, to Narco wic h , P etru s hev and W ard ( 2006a , 2006b ), P etrush ev and Xu ( 200 8 ). 4. Needlet based test pro cedure and other anisotrop y tests. W e in tro- duce here t wo anisot rop y detection pro cedur es based on the needlet analysis of { X i } i =1 ,...,n . The fir st one is based on m ultiple testing and will b e referred to as Mul tiple . Th e second one uses an estimate of the densit y plu gged in a distance criterion and w ill b e referred to as PlugIn . F or the sak e of fur ther comparison (see Section 5 ), w e also describ e t w o existing metho ds that are used in th e gamma ra y bu rst and cosmic ra y literature. The first one is based on a nearest neighbou r analysis [see Quashno ck and Lam b ( 1993 ), Efron and P etrosian ( 1995 )]. The second on e relies on the t wo-point correlation [see, e.g., Nara y an and Piran ( 1993 ), Kac helriess and Semik oz ( 2006 )]. W e wan t detection pro cedures that are efficient fr om a L 2 p oint of view, but also for other L p norms. In addition, w e will require pr o cedures that are simple to implemen t as well as ad ap tive to un kno w n and inhomogeneous smo othness. In Euclidean f r amew orks, th ese typ es of requirements are well kno wn to b e efficien tly handled by (nonlin ear) w av elet thr esholding estima- tion in the conte x t of densit y estimation [see, e.g., Donoho et al. ( 1996 )] or b y multiple tests [Ingster ( 2000 ), Sp ok oiny ( 1996 )]. Our problem h ere requir es a sp ecial constru ction adapted to the sph ere, since usual tensorized wa v elets will neve r reflect the m anifold structure of the sphere and will necessarily create unw an ted artifacts. R ecently a tigh t frame (i.e., a r edundant family sh aring some p rop erties with orthonormal bases), called a ne e d let fr ame , wa s pro d u ced w hic h enjo ys enou gh prop erties to b e su ccessfu lly used for densit y estimatio n [Baldi et al. ( 2009a )], for exam- ple, concen tration in the “F ourier” domain as w ell as in the space domain. Here, obvio usly the “space” domain is the t wo-dimensional sp here itself, whereas the F ourier domain is no w obtained by replacing th e “F our ier” ba- sis by th e b asis of Sph erical Harmonics whic h leads, as mentioned in the 16 F A ¨ Y, DELABROUILLE, KER KY ACHARIAN AND PICAR D previous section, to inv arian t tests. This construction p ro duces a family of functions { ψ j k , j ≥ 0 , k ∈ K j } whic h v ery m uc h resemble wa v elets. The ind ex k defi nes (with an analogy to the standard w av elets) the lo c ations (p oin ts) on the sphere around which the needlet is concen trated, and j is r eferred to as the sc ale . These needlets ha ve b een sho wn to b e extremely useful for solv- ing sev er al t yp es of astrophysic al problems [Delabrouille et al. ( 2009 ), F a¨ y et al. ( 2008 ), Pietrob on, Balbi and Marin u cci ( 2006 ), Marinucci et al. ( 2008 ), Pietrob on et al. ( 2008 ), Rud j ord et al. ( 2009 )] or div ers e inv erse problems in statistics [Kerkya c harian et al. ( 2007 ), Kerkyac h arian, Pham Ngo c and Pi- card ( 2011 ), Kerky ac harian et al. ( 2010 )]. They are esp ecially w ell adapted to the situation recurrent in astroph ysics wh er e th e “fu ll sky” is not co v ered (meaning in our con text that there are regions of the sphere wh ere the p oints X i are not observe d if th ey happ en to fall there). A formal definition of n eedlets on the sp here is prop osed in the online supplement to th is article [F a¨ y et al. ( 2013 )] and can b e found in greater detail in Narco w ic h, P etrus hev an d W ard ( 2006b ). F or the description of the test pro cedures, w e only need to define the empirical needlet co efficients ˆ β j k def = 1 n n X i =1 ψ j k ( X i ) , (11) whic h are unbiased estimators of β j k ( f ) def = h f , ψ j k i = R S f ( ξ ) ψ j k ( ξ ) d ξ . As usual in the w a v elet literature, j ≥ 0 refers to the scale and k to the lo cation. The coa rsest scale is j = 0. The index k r efers to a collectio n of quadrature p oint s { ξ j,k } that are a v ailable at eac h scale j . ψ j,k is then a zero- mean function cen tered on ξ j,k and more and more concen trated as j → ∞ . In our simulatio ns, we h a ve c h osen dy ad ic needlets with a spline function of ord er 15 as generator, w hic h leads to simp le but su ffi cien tly concen trated analysis w av elets. All the w av elets are axisymmetric around s ome we ll c hosen p oint s ξ j,k . The spatial p rofiles of those n eedlets at th e fi v e coarsest sca les are represent ed in Figure 3 . More details are a v ailable in the online su pplement [F a ¨ y et al. ( 2013 )]. 4.1. Multiple tests. F or multiple tests, we will consider collecti ons of “lin- ear estimators” of the densit y , meaning that we will not u se any nonlin- ear pro cessing of w av elet coefficients suc h as thresh olding in the estimation phase. By analogy with the w ork of Butucea and T rib ouley ( 2006 ) on the related problem of the t wo- sample nonp arametric homoge neit y test, we de- fine ˆ f J = 1 4 π + J X j =0 X k ∈K j ˆ β j k ψ j k (12) TESTING THE ISOTROPY OF HIGH ENERGY COSMIC RA YS 17 Fig. 3. The shap e of the five first ne e d lets in the sp atial domain as the function of the c o-latitude θ . R e c al l that al l the ψ j,k functions ar e axisymmetric ar ound the p oints ξ j,k . with the β j k ’s giv en b y ( 11 ). F or any v alue of the sm o othing parameter J , w e defin e the n onrandomized associated testing pro cedure T J = 1 d ( ˆ f J ,g ) ≥ t J = ( 1 , if d ( ˆ f J , g ) ≥ t J , 0 , if d ( ˆ f J , g ) < t J . (13) This give s a f amily of tests in d exed by J , wh ere the dep endence with resp ect to the choice of the distance d and to the sequence of thresholds t J is made implicit in th e notation. Butucea and T rib ouley ( 2006 ) pro v ed that if the r egularit y cond itions are kno wn and sp ecified by Beso v conditions, the smo othing p arameter J can b e c hosen optimally . It is lik ely th at their arguments could b e repr o duced in our case . Ho wev er, our p oin t of view in this pap er will not b e to detail this theoretical issu e bu t rather to concentrate on th e practical asp ects of the tests. Moreo ve r, it wo uld b e probably difficult to relate physical information to mathemat ical regularit y cond itions. Nev ertheless, the optimal c hoice for the parameter J dep ends on the reg- ularit y s s p ecified in the class of alternativ es. Adaptiv e optimalit y can b e ac hiev ed thanks to a m ultiple test that decides for the alternativ e h yp othe- sis as so on as one of the T J ( d, c J ) = 1 individu ally do es so, that is, definin g T Mul tiple , by T Mul tiple = 0 if and only if ∀ J ≤ J ⋆ , T J = 0 . (14) Mimic king the theoretical r esults obtained in Butucea an d T rib ouley ( 2006 ) and Baldi et al. ( 2009a ), w e ha ve u s ed J ⋆ = ⌊ 1 2 log 2 ( n/ log n ) ⌋ (15) as a reference in our n u merical in vesti gations, as in the case of adaptiv e d en- sit y estimation (see b elo w). Note, ho w ever, that th e optimal J ⋆ could v ary 18 F A ¨ Y, DELABROUILLE, KER KY ACHARIAN AND PICAR D according to the loss function ( L p norm) we use to measur e the nonisotropy as s u ggested b y th e r esu lts of the related problem in the t wo samp le n onho- mogeneit y detection Butucea and T rib ouley ( 2006 ). The v alues t J that are used in ( 13 ) must b e c hosen to v erify P g ( T Mul tiple = 0) ≃ α, wh ere α is the prescrib ed lev el of the test. 4.2. Plug-in tests. It is also in teresting to compare, from an empirical p oint of view, th e ab ov e multiple test p ro cedures to algorithms wh ere we simply plu g in an adaptive estimate of the density in the distance. T hese densit y estimators ha ve go o d asymptotic prop erties from a minimax p oin t of v iew, hence, it mak es sense to inv estigate also their p r op erties wh en us ed for testing. T o the b est of our k n o wledge, no theoretical optimalit y is pro ved and there even are argum ents suggesting that these pr o cedures might not b e optimal. F or instance, on the real line, the min imax rate of con v ergence for estimation (in the so-calle d dense case) is n − s/ (2 s +1) , meaning that if f b elongs to a ball in a H¨ older s p ace w ith exp onen t s , then no estimator can appr oac h the least fa v orable densit y at a b etter error rate (measured in a L p norm). W e refer to Donoho et al. [( 1996 ), Theorem 3] for a pr ecise statemen t, among others. O n the other hand, the minimax critical r ad iu s for non uniformity detectio n is n − 2 s/ (4 s +1) [see In gster ( 2000 )]. It means th at, in the minimax framewo r k, one can d istinguish asymp toticall y t w o hyp otheses that are s eparated b y a distance negligible with resp ect to th e accuracy of any nonparametric estimation of the dens ities in an infinite dimensional space. The most p op u lar minimax adaptiv e technique consists in adding to a v ery basic linear estimation a thresh oldin g rule as p ost-pro cessing. In the ab o ve men tioned pap er [Baldi et al. ( 2009a )] this nonlinear p ost-pro cessing actually is a har d thresholding rule, namely , ˆ f J ⋆ = 1 4 π + J ⋆ X j =0 X k ∈K j ˆ β j k 1 | ˆ β j k | >κ √ log n/n ψ j k for some p ositive constan ts κ and J ⋆ = ⌊ 1 2 log 2 ( n/ log n ) ⌋ . The co efficien ts ˆ β j k are defined in ( 11 ). It is kno w n that many v ariations exist with close th eoretical prop erties but some differences in different practical situations. Among those, w e will esp ecially consider the data-driven thresholding introdu ced by Juditsky and Lam b ert-Lacroix ( 2004 ) to deal w ith density estimation on the real line (as opp osed to dens ity on [0 , 1]). It seems to giv e go o d d etectio n pro cedures f or small samples in our con text. In the follo w ing, w e will consider the nonlinear estimates ˆ f J ⋆ = 1 4 π + J ⋆ X j =1 X k ∈K j 1 | ˆ β j k | >λ √ log n ˆ σ j k 1 δ j k >ρ log n ˆ β j k ψ j k (16) TESTING THE ISOTROPY OF HIGH ENERGY COSMIC RA YS 19 for some p ositiv e constan ts ρ, λ , J ⋆ = ⌊ 1 2 log 2 ( n/ρ log n ) ⌋ , and where ˆ σ 2 j k def = 1 n n X i =1 ψ 2 j k ( X i ) − ( ˆ β j k ) 2 , (17) δ j k def = ( ψ 2 j k ( ξ j k )) − 1 n X i =1 ψ 2 j k ( X i ) . (18) Let us giv e a short in terp retation of the thresholding pro cedure. The quan tit y ˆ σ 2 j k is an estimate of the v ariance of ˆ β j k . The expr ession for δ j k is inspired by the one provided in Juditsky and Lam b ert-Lacroix ( 2004 ). In this reference, compactly supp orted wa v elets on the real line are used with a thresh old on the num b er of observ ations actually participating to the estimation of β j k . In th is case, it mak es sense to count the num b er of observ ations f alling in th e sup p ort of the wa v elet. In our case, as needlets are su pp orted on the wh ole sphere (although v ery concentrate d), w e pr op ose to replace this qu an tity b y a contin uous t yp e appro ximation δ j k ; see ( 18 ). Note that δ j k = n if X 1 = · · · = X n = ξ j k . Finally , we d efine the PlugIn pro cedure as the decision T PlugIn J = 1 d ( ˆ f J ∗ ,g ) ≥ t PlugIn J , (19) with ˆ f J ⋆ defined in ( 16 ) and t PlugIn J some fix ed threshold dep ending on the prescrib ed lev el α of the test. 4.3. Two-p oint c orr elation test and ne ar e st neighb our test. When dealing with one-dimen sional data, one can compare ev ery test pro cedu re to the w ell- kno wn b enc hmark K olmogoro v–Smirno v or Cram ´ er–v on Mises tests, whic h are b ased on th e empirical distribution fun ction of th e sample. In h igher dimensions (here on the sphere), there is no natural order relat ion that allo ws to consider suc h approac hes. F or sak e of comparison, w e h a ve run some simulations on tw o d ifferen t tests f ou n d in the astronomical literature. Ne ar est neighb our test. The foll o wing statistical pro cedu re has b een pro- p osed by Quashn o c k and Lam b ( 1993 ). W e denote it NN , as nearest neigh- b our. F or eac h p oin t X i , w e compu te the d istance Y i to its nearest n eigh- b our. Un der the hyp othesis that f is un iform o ve r the w hole sph er e, th e marginal distribution fun ction of ( Y i ) is φ : y 7→ 1 − [(1 + cos y ) / 2] n − 1 , and the Wilco xon statistic W = √ 12 n 1 2 − 1 n n X i =1 φ ( Y i ) ! is asymptotically standard Gaussian. F or a nonhomogeneous random draw (for instance, in the presence of clusters), this statistic is exp ected to tak e 20 F A ¨ Y, DELABROUILLE, KER KY ACHARIAN AND PICAR D significan tly high v alues, allo wing to detect this kin d of anisotrop y . This test is of in terest, as it is s imple to compute, it has no p arameters to b e tuned, and it admits an extension to non uniform exp osur e [see Ef ron and P etrosian ( 1995 )]. I n this case, the distribution of W is estimated n u m erically by Mon te Carlo method s. T he NN pro cedur e simply writes T NN = 1 W ≥ t NN , (20) where t NN 1 − α is the (1 − α )-quant ile of the distr ibution of W . This distribution can b e app ro ximated by a standard Gaussian d istribution if th e sample size is big and the exp osure is uniform. Otherwise, the quan tile is estimat ed by the Mon te Carlo m etho d. Two-p oint c orr elation test. Among others, Nara yan and Piran ( 1993 ), Kac helriess and Semikoz ( 2006 ) use the empirical t wo-point auto correlation function to detect clustering ( TwoPC test). F or a collecti on of n p oints { X i } and an y angular distance δ ∈ [0 , π ], let N n ( δ ) denote the rand om num b er of pairs { i, j } suc h that ∆( X i , X j ) ≤ δ , wh er e ∆ is the geo desic distance. Define the t wo -p oin t correlation fu nction w n ( δ ) = E ( N n ( δ )) and its empirical coun terp art ˆ w n ( δ ) = X it α ′ ,j , (23) where t α ′ ,j is the 1 − α ′ quan tile of the d istribution of k ˆ f j − g k p under the null h y p othesis. This distribution is ev aluated us in g Mont e Carlo replications. F u rther, the v alue α ′ is chosen so that T ′ J ⋆ = sup j =1 ,...,J ⋆ T j (24) has a first t yp e error probability equ al to α . This is arbitrary and the theory to b e written w ould lik ely su ggest to use a scale dep endent lev el. The p ow er of the test T is defined by ( 8 ). Some clues ab out this v alue are obtained b y ev aluating P f ( T = 1) f or p articular alt ernativ es f that are giv en in the n ext section. Here ag ain, those qu an tities are ev aluated by Mon te Carlo. Note , ho wev er, that th e p o wer for a p articular alternativ e only giv es an upp er b ound of the p o wer in th e m in imax sense giv en b y the seco nd equation of ( 8 ). In the tables of tests in th e main pap er (T ables 1 through 3 ) and on its online supplement [T ables 1 through 8 in F a¨ y et al. ( 2013 )], w e rep r esen t the p o w er of four tests. Th e p o w er of the needlet tests is expressed as a fun ction of the finest band J ⋆ and the p o wer of the norm we use to detect anisotrop y (see the onlin e supplemen t [F a¨ y et al. ( 2013 )] for more details on the actual implemen tation of the method). 22 F A ¨ Y, DELABROUILLE, KER KY ACHARIAN AND PICAR D T able 2 Power (in %) under ( H c 1 ) , under uniform exp osur e, with n s = 500 and E min = 6 × 10 19 eV n = 25 n = 100 J ⋆ 3 4 5 6 3 4 5 6 Mul ti ple p = 1 27 39 45 43 76 94 99 98 p = 2 ⋆ 28 42 50 58 79 96 100 100 p = ∞ 24 35 45 50 69 84 96 97 PlugIn p = 1 18 18 18 18 72 72 73 73 p = 2 25 28 29 29 78 82 82 82 p = ∞ 33 34 34 34 71 80 80 80 NN 33 99 Tw oPC 75 99 The profile cuts of the (axisymmetric) needlets w e ha ve used are plotted in the online supp lemen t. 5.2. Altern atives. W e ha ve inv estigate d the p erformance of th e test (p o wer against lev el) for samp le sets of small to mo derate size ( n = 25 , 100 , 400) and against differen t alternativ es. Those c hoices of n mimic the progres- siv e pu b lication of ev en ts by the Pierre Au ger Observ atory (27 ev ents ab o v e 5 . 7 × 10 19 eV in 2008, 69 ab ov e 5 . 5 × 10 19 in 2010, a few hundred in the future). Generally sp eaking, the physical p laus ib ilit y of those alternativ es is w eak [alternativ e ( H c 1 )], if n ot null [alternativ es ( H b 1 ) and ( H c 1 )]. Our goal is to T able 3 Power of the tests for thr e e mo dels of ( H a 1 ) with values of δ and sample size varying so that √ nd ( f , g ) r emains c onstant. It app e ars that those p articular se quenc es of p owers ar e gener al ly nonde cr e asing with the sample size. The observation mo del uses the Pierr e Aug er exp osur e function n = 25 , δ = 0 . 0 8 n = 100 , δ = 0 . 04 n = 400 , δ = 0 . 02 J ⋆ 3 4 5 6 3 4 5 6 3 4 5 6 Mul ti ple p = 1 14 16 13 13 14 16 14 14 21 20 17 17 p = 2 ⋆ 19 20 16 16 17 21 20 20 23 21 20 20 p = ∞ 23 26 23 22 29 32 32 30 34 32 30 29 PlugIn p = 1 11 11 11 11 17 16 16 16 19 19 19 19 p = 2 16 16 16 16 26 27 27 27 32 32 32 32 p = ∞ 23 22 22 22 32 30 30 30 39 39 39 39 NN 8 6 5 Tw oPC 35 14 14 TESTING THE ISOTROPY OF HIGH ENERGY COSMIC RA YS 23 Fig. 4. Densities (first li ne) and r andom dr aws (se c ond l i ne, n = 100 ) under ( H a 1 ) with δ = 10% and θ = 5 ◦ (left) or θ = 20 ◦ (right). fo cus here on sp ecific departures fr om isotropy . First w e consider unimo dal nonisotropic densities, with a Gaussian s h ap e. Then we consider mixtures of densities th at would only b e obtained if the s ou r ces of the cosmic ra ys w ere kno wn to b e uniformly distributed and rep eating, and at the same distance from us . Third, the Physics-inspired mod el ( H c 1 ) giv es rise to non- isotropic p atterns w ith ric h er f requency con tent compared to the p revious ones (and nonaxisymmetric clusters). W e no w give the precise definitions of the alternativ es. ( H a 1 ) . The first family of alternativ es is obtained as a mixture of the uniform density h 0 and an o ver-densit y at some p oin t of the sph er e, with Gaussian-lik e axisymmetric profile. Precisely , the den s it y under ( H a 1 ) w rites h ( ξ ) = (1 − δ ) h 0 + δ h θ ( ξ ) , where for θ 6 = 0, w e pu t h θ ( ξ ) := h θ , ξ 0 ( ξ ) , h θ , ξ 0 := C θ exp( − ( ξ · ξ 0 ) 2 / 2 θ 2 ) and ξ 0 = ( π / 2 , 0). Such densities are then unimo dal, with a bump whose w idth is pr op ortional to θ . T ypical observ ations of random draw with suc h densit y with δ = 0 . 01 and θ = 5 ◦ or 20 ◦ are displa ye d on Figure 4 . ( H b 1 ) . A second family of alternativ es is a toy model for th e rep eat- ing emission of ev ents from a small n um b er of sources, as exp lained in the In tro duction . Here we assume th at the n s sources are uniformly distribu ted, although in a realistic case, we can exp ect any t yp e of astrophysical sources to follo w the lo cal matter den s it y of the co smic structure (whic h wo uld 24 F A ¨ Y, DELABROUILLE, KER KY ACHARIAN AND PICAR D Fig. 5. Density of X 1 c onditional l y to the r andom dr aw of the c enters of 100 AGNs (first line) and r andom dr aws with n = 400 (se c ond line). The exp osur e i s uniform on the left, ` a la Pierr e Auger Observatory on the right. mak e the detection of anisotrop y easier). This generalization is straigh tfor- w ard enough that we d o not discuss it further at th is stage . Cond itionally to those p ositions, the inciden tal directions are distributed along a mixtur e of n s Gaussian densities cen tred on the sources (to tak e in to account the err or in the measurement of the incidence angle or the deflection of the c h arged particle b y Galacti c magnetic fields), namely , h ( ξ ) = n s X j =1 h θ , ξ i ( ξ ) . This d ensit y is then mo du lated by the exp osur e ε of the detector along equation ( 4 ). Suc h cond itional densities are displa ye d on the first line of Figure 5 with uniform and Pierre Auger exp osures. W e considered th e cases n s = 10 and n s = 100 and fixed θ = 10 ◦ . Note that if n s is m u c h bigger than n , it is difficult to detect this kind of anisotrop y (whic h can b e detec ted only if at least one source h as emitted more than one cosmic ra y). ( H c 1 ) . A third and last alternativ e is obtained by the ph ysical mo del of cosmic ra y observ ations describ ed in d etail in Section 2 . S ources are r an- domly dra wn in a s pherical v olume of radius r max = 70 Mp c, and their flux is assumed inv ersely prop ortional to the square of their distance. The pa- rameters for the sim u lations are tak en to b e E max = 10 21 eV, α = 4 . 2. W e consider different v alues for E min (namely , 1, 4 or 6 × 10 19 eV). Pla ying on TESTING THE ISOTROPY OF HIGH ENERGY COSMIC RA YS 25 Fig. 6. Isotr opization of the c osmic r ays in mo del ( H c 1 ) as E min de cr e ases. Ther e ar e the exact same n s = 30 sour c es in the thr e e c ases and n = 1000 observations. this parameter has an imp ortant practic al incidence. Assuming that the dis- tribution of the energy of th e cosmic rays is a p o wer la w, P ( E > t ) ∼ C t − α +1 , lo we ring the threshold on the selection of the cosmic rays from 6 × 10 19 eV to 4 × 10 19 eV (resp., 10 19 eV) account s to increase the size of the sam- ple (a v ailable observ ations ab o v e the threshold) by a facto r (6 / 4) α − 1 ≃ 3 . 66 (resp., 310). It m eans th at the statistical decision s hould b e made far easier if th e cosmic r a ys we re n ot to o muc h isotropized b y th e Galactic fields as their energies go lo wer. Th is effect is illustr ated in Figure 6 . It is interesti ng to see if the metho ds are s till able to d etect anisotrop y as the cosmic rays b ecome more and more isotropized. Th is is a m ore realistic s im ulation com- pared to mo d els ( H a 1 ) and ( H b 1 ). There is no single size for the scatter of the CRs coming for a giv en s ource, nor the same s ize or directionalit y for eac h source, nor the same flux for eac h source, that h ence is in teresting sp ecifi- cally for a multiscale analysis with no prior assump tion ab out a correlation length. Note that und er the alternative s ( H b 1 ) and ( H c 1 ), the pro cedure is to b e understo o d as a test on the conditional d istribution of ( X i ) i =1 ,...,n with re- sp ect to th e p ositions of the “sources”, whic h are randomly d r a wn once for all. 5.3. Numeric al r esults and discussion. T ables. W e shall represent some of the r esults of our simulatio n s w ith tables of estimated p ow er of the p ro cedures for given alternativ es (in p er- cen t), at the p rescrib ed lev el α = 0 . 05. Practically , we let the finest needlet band ente r ing th e Mul tiple and PlugIn pro cedur es v ary in the set { J ⋆ − 2 , J ⋆ − 1 , J ⋆ , J ⋆ + 1 } where J ⋆ is giv en by ( 15 ). The entry (or en tries) cor- resp ond in g to th e o v erall highest p o wer (b efore roun ding off ) among the 26 v alues is (are) p r in ted in b old t yp e. W e consider three L p norms, n amely , L p for p = 1 , 2 , ∞ . It is p ossible to use an u nbiased estimate of the distance b et ween ˆ f and g in the case of th e L 2 norm. It is referred to as p = 2 ⋆ (see the online s upplement for details) R OC curves. The receiv er op erating c haracteristic (ROC) curves p lot the p o wer p of a pro cedur e as a function of its level α . It is a useful repre- 26 F A ¨ Y, DELABROUILLE, KER KY ACHARIAN AND PICAR D sen tation f or comparison of differen t pro cedures along a wide r ange of lev els. The ROC curv es asso ciated to the TwoPC p ro cedure are a step fu nction b ecause of th e discrete n ature of the test statistic. Some of the R OC curv es are nonconca ve. It should b e recalled, h o wev er, that an y p ro cedure of this kind can b e imp ro ved to a randomized pr o cedure w hose ROC curve is the conca v e u pp er en v elop e of the original one. Accordingly , the r eader’s ey es m u st actual ly analyse the upp er env elop es of the R OC curves. Not e that the p o w er in the tables has not b een mod ified by this argument. R OC curves are r epresen ted in plots with four subplots, corresp onding to the four ab ov e-men tioned choic es of J ⋆ in the needlet m etho ds. The R OC curv es for Tw oPC and NN pr o cedures are the same in the four subp lots. Inset graphs allo w complementary comparison of the metho ds b y zoomin g on the most relev ant lev els (small α ). 5.3.1. Some sp e cific r esults. First, we n ote that the differences of sensi- tivit y b et ween the differen t L p norms w e use are not v ery strong, probably b ecause we consider quite r egular alternativ e hypotheses. As exp ected, the L ∞ is a bit more sensitiv e to m ore spiky (un imo dal) d istributions, whereas more global measures such as L 1 or L 2 p erform b etter under the ( H b 1 ) or ( H c 1 ) m o dels. Th is is illustrated by some ROC curv es in th e online supple- men t. W e no w illustrate the comparison of the p erformances of the four pro cedure with a few tables and figures. It app ears that the metho ds Mul tiple and PlugIn ha ve a consistent b eha viour wh en the t ypical radius of the anisot ropic s tructure is v arying. W e shall discuss further from those cases b elo w. Figure 7 illustrates their goo d p erformances even for small samp les un d er th e model ( H c 1 ) that pro d uce clusters of v arious sizes and sh ap es. The NN pro cedu r e p erforms str ikin gly wo rse than others in almost all but the ( H b 1 ) situations. The go o d sensitivit y to ( H b 1 ) alternativ es can b e explained in the follo w in g mann er. In this case, the p oin ts { X i } i =1 ,...,n are mainly group ed into clus ters of a verag e scale giv en b y the standard deviation of th e Gaussians of th e m ixtu re. If the n um b er of clusters and this standard deviation are to o s mall to co ve r significan tly the w h ole observ ed part of the sphere, th en the rand om distances to the nearest neigh b our are b ound ed b y σ with v ery high probabilit y , which is not the case under th e null. This m ak es the d istribution of the distance to the nearest neigh b our a very sensitiv e tool to discriminate b et ween ( H b 1 ) and the null. V arying the alternativ es, it app ears that no metho d outp erf orms th e other in a uniform w a y , but it seems that th e t wo n eedlet metho ds, if not alw a ys optimal, consisten tly ha v e a go o d b eha viour . Moreo v er, the Mul tiple test is sligh tly more sensitiv e that the PlugIn one. As an illustration, w e represent in T ables 1 and 2 the p o wer of the pro cedures against the ( H c 1 ) alternativ e, for sample sizes equal to 25 and 100, and ( E min , n s ) = (10 19 eV, 100), and TESTING THE ISOTROPY OF HIGH ENERGY COSMIC RA YS 27 Fig. 7. ROC curves (true p ositive r ate against false p ositive r ate) for the four metho ds. F or the ne e d let metho ds, the debiase d L 2 norm is use d. Insets display the same curves as in the mai n plot wi th a lo garithmic sc ale in abscissas, to highlight the c omp ar ative p erformanc es for r elevant level values. 28 F A ¨ Y, DELABROUILLE, KER KY ACHARIAN AND PICAR D (6 × 10 19 eV, 50 0 ), resp ectiv ely . It ca n b e seen from those tables that mo ving the lo w er energy limit up wards make s the detection easier. Mo re tables are a v ailable in the online supplement , f or a rep r esen tativ e panel of alternativ es, con taining more or less spiky d istributions, clusters of smo other alternativ es, w eak or strong anisotropy etc. It m u s t b e stressed that the Tw oPC appr oac h often pr o vides a go o d sensitivit y if not the b est at n = 25. F or most of the alternativ es, h ow ev er, one or the other of the needlets metho ds outp erforms TwoPC as n grows. This is exemplified in T ables 1 and 2 in the case of a ( H c 1 ) alte rnativ e. In our application conte xt, th e sample size o v er a giv en energy threshold is increasing w ith time and exp eriments, so it m ust b e highligh ted that m u ltiscale metho d s are more and more appropriate for analysis of fu ture data sets. 5.3.2. Sep ar ation r ate. W e fo cus here on the b eha viour of the p o wer of the test with resp ect to n . I f r n is the critical r ate in the minimax sense [giv en by equations ( 9 ) and ( 10 )], w e should observ e an app ro ximately same p o w er f or different sample size and the least fav ourable alternativ e densities ˜ f n as soon as th e quantit y r n d ( ˜ f n , g ) remains constan t. On T able 3 we ha ve disp lay ed th e p o wer of the d ifferent pro cedu r es for three d ifferen t densities corresp ond ing to the alternativ e ( H a 1 ) and three sample sizes, keeping th e same v alue for n 1 / 2 d ( f , g ). Indeed, in the ( H a 1 ) case, for an y p o wer n orm, d ( h, h 0 ) = δ d ( h 0 , h θ ). As the p o wer r emains roughly the same in (0 , 1) for the thr ee v alues of the parameters, and as n 1 / 2 is an upp er b ound for the minimax separation r ate in analogy w ith similar problems on Euclidean spaces, th is numerical simulation is consisten t with the claim that the n eedlet based pro cedu res p erform well at the minim ax rate of testing. The in creasing v alue of the p o wer with n together w ith the u n b eatable rate of separation √ n illustrates th e fact that w e only ha v e ac cess to upp er b ounds of the minimax rate. In other w ords, th e densities under consideration are definitely not the lea st fav ourable cases. The comparison of n eedlet metho d s with NN and Tw oPC metho ds tends to b e more fav ourable to needlets metho ds as n b ecomes larger in this case . 5.3.3. R obustness. Assume that th e anisotropy detection by the needlet metho ds is adaptiv e. Th en, as pre-tuned blac k b oxes, those metho ds should remain optimal on a wide range of alternative s . Some simulat ions s upp ort this claim. Note, ho w ev er, that w e only explore ph ysically p ossible alte rna- tiv es wh ic h are smooth non u niform d ensities. The k ey parameter of the Tw oPC m etho d is the angular size δ 0 at whic h w e compare ˆ w ( δ ) to the distr ib ution of w ( δ 0 ) un der the null. F or sak e of fairness in our comparisons, we should allo w some tunin g of this parame- ter. It is clear that the optimal δ 0 is r elated to the “a v erage scale” of the TESTING THE ISOTROPY OF HIGH ENERGY COSMIC RA YS 29 Fig. 8. The empiric al p ower asso ciate d with the Mul tiple (left c olumn) and TwoPC (right c olumn) pr o c e dur es with r esp e ct to their key p ar ameters J ∗ and δ 0 , r esp e ctively. The pr escrib e d l evels of the tests ar e 5%. The thr e e m o dels under c onsider ation in the first r ow ar e pr ovide d by the alternative ( H a 1 ) with θ = 5 ◦ , 10 ◦ and 20 ◦ . On the se c ond r ow, the thr e e alternative mo dels ar e ( H c 1 ) with n s = 500 , and E min = 10 19 , 4 × 10 19 or 6 × 10 19 eV . The numb er of observat ions i s n = 100 everywher e. anisotrop y . Though it is difficult to giv e a precise and general d efinition of this former quant it y , it sh ould b e close to the v alue of th e parameter θ in the particular case of mo del ( H a 1 ). In deed, it app ears from our sim u lations that TwoPC is b etter than the n eedlet metho ds when θ = 5 ◦ and worse when θ = 20 ◦ under ( H a 1 ). On Fig ure 8 we ha v e p lotted the estima ted p o w er of the tests against differen t alternativ es ( H a 1 ) or ( H c 1 ), and for d ifferen t parameters for the metho ds. In the ca se of ( H a 1 ), the first line of the figure sho ws that the op- timal δ 0 is indeed r elated to the parameters θ of the alternativ e. Ho w ever, when dealing with alternativ es su c h as ( H c 1 ) (second line of Figure 8 ) that giv e rise to structur es at different “scales”, the optimal c hoice of δ 0 is not clear. By observing the large v ariations of the p o wer of the TwoPC pr o ce- dure w ith r esp ect to δ 0 in b oth cases, one can co nclude that this pro cedure should incorp orate a data-driv en selection of δ 0 to b e truly efficien t. The situatio n is str ikin gly differen t for th e needlet metho ds. One can observ e from the left column of Figure 8 th at the p o wer reac hes some plate au 30 F A ¨ Y, DELABROUILLE, KER KY ACHARIAN AND PICAR D Fig. 9. The 69 arrival di r e ctions of c osmic r ays with ener gy ab ove 55 EeV and dete cte d by the Pierr e Auger Observatory up to 31 De c emb er 2009 [Pierr e Auger Col lab or ation ( 2010 )]. Their distribution is obviously nonunif orm, due to the i nc omplete c over age f unction of the instrument that is describ e d in Figur e 1 . Anisotr opy tests actual ly c omp ar e the empiric al distribution to the exp osur e f unction (se e text for details). after J ⋆ > J min in a v ery consisten t w a y across the differen t alternativ es. This r obustness is a strong p oin t of those method s. The dep endence in n is quite wea k to o. F or instance, taking J ⋆ = 4 leads to a small loss of efficiency uniformly with resp ect to the b est choic e for eac h giv en situatio n of sample size and mo d el. 6. Analysis of A uger data. W e ha v e ru n the previous tests on the Auger public data made av ailable by the Pierre Auger Collab oration ( 2010 ). It is composed of 69 arriv al directions of cosmic ra ys w ith energy abov e 55 EeV and detected by the Pierre Auger Observ atory b et ween 1 Jan u ary 200 4 and 31 Decem b er 2009. T hose dir ectional even ts are plotted on Figure 9 . The d istributions of the tests un der stud y for n = 69 and und er the n ull h y p othesis ha ve b een ev aluated by Mon te Carlo simulat ion of length 10.000 . Along with the detect ion of a correlation b et ween cosmic rays’ directions and catalo gues of p oten tial sources, the Pierre Auger colla b oration already p erformed a catalo gu e-fr ee test for anisotropy with n o reference to an y cat- alogue, usin g the TwoPC pro cedur e. As n oticed earlier, the critical v alue for this metho d is the c hoice of δ 0 in ( 22 ). The p -v alue of this test for the 69 UHECRs d ata set reac hes a minimal v alue of p -v alue( TwoPC ) ≃ 0 . 008 around δ 0 ≃ 10 . 7 ◦ . Recall th at in order to b e interpretable as a classical p - v alue f or a sin gle hyp othesis testing, this p -v alue should b e computed from an out-of-the-sample prescription of δ 0 , wh ich is not the ca se here. Then this p -v alue stron gly exaggerates the signifi cance of the detection. In deed, as already noticed in [Pierre Auger Collab oration ( 2010 )], w e computed th at the fraction of isotropic simulatio ns th at are as nonisotropic as the real data at some angle b et ween 4 ◦ and 14 ◦ is as high as 10%. W e ha ve also computed that p -v alue( NN ) ≃ 0 . 07 . TESTING THE ISOTROPY OF HIGH ENERGY COSMIC RA YS 31 T able 4 P -values of the M ul tip le and the PlugIn tests for Auge r data ( n = 69 ) Multiple test PlugIn test J ⋆ p = 1 p = 2 ∗ p = ∞ p = 1 p = 2 ∗ p = ∞ 1 0.957 0.788 0.387 0.956 0.958 0.397 2 0.051 0.112 0.035 0.033 0.037 0.036 3 0.118 0.050 0.004 0.017 0.008 0.005 4 0.434 0.046 0.003 0.017 0.008 0.008 5 0.227 0.095 0.624 0.017 0.008 0.008 6 0.762 0.045 0.341 0.017 0.008 0.008 The p -v alues of T able 4 are the p -v alues computed from the Pierre Auger data set for our Mul tiple and PlugIn pro cedure. F or the Mul tiple test , the p -v alue is d efined as the pr op ortion of dra ws (under the null) that ha v e a higher s in gle test statistic in at least one v alue of j ∈ { 1 , . . . , J ⋆ } . The resulting p -v alue is quite sensitiv e to the c hoice of the highest band J ⋆ , except if one uses the L 2 -norm. Note that if w e take the L 2 norm an d the theoretical J ⋆ = 2 give n by the expression ( 15 ), th e results for the Mul tipl e test are not statistically significant. But the Mon te Carlo sim u lations suggest that this theoretical c hoice of J ⋆ is not optimal for small to medium samp le size, b eing to o small. The PlugIn is more s table and co nsisten tly considers that the Auger data is significantly nonisotropic. The almost constan t p -v alues in this case are the consequence of a hard thresholdin g rule in ( 16 ) that cancels all the estimated co efficien ts ˆ β j,k as so on as j ≥ 3 f or this data set. This ma y in turn giv e a rule-of-th umb ru le to define a data-driv en J ⋆ for the multiple test. T o conclude on this imp ortan t data set and this method ology , it app ears that the needlet m etho ds fin d a str on ger statistical evidence of some kind of an isotropy in the Pierr e Auger data. More reali stic alternativ es and more sim u lations can help to c ho ose the J ⋆ parameter of the Mul tiple p r o cedure and additional parameters of the PlugIn approac h . 7. Conclusion. In this pap er we ha v e in v estigate d the pr oblem of the detection of anisotrop y of d irectional data on the unit sphere, with an appli- cation to the analysis of u ltrahigh en ergy cosmic ra y ev en ts as observ ed with a d etector such as the Pierre Auger Observ atory . It w as imp ortan t to con- sider s amp les whose sizes are comparable to the sizes of the data sets that are av ailable no wada ys for co smic ra ys scien tists (ab out 25 at the b egin- ning of this w ork, ab out a hundred no w). Although we are mainly inte rested in small sample p erformances, we ha ve pr op osed a multiple test appr oac h 32 F A ¨ Y, DELABROUILLE, KER KY ACHARIAN AND PICAR D based on a multi resolution analysis of the data, which could hop efully b e pro ved to b e asymptotically optimal in the min imax sense, a wel l-kno wn p essimistic framew ork. W e h a ve prop osed, and tested on v arious sim ulated data sets, t w o meth- o ds using the decomp osition of the directional d ata onto a frame of spherical needlets. T h eir p erform ance has b een compared to other (more sp ecific) ap- proac hes based on the nearest n eigh b our and on the t w o-p oin t correlation function. The sim ulation shows th at the needlet-based metho ds p erform comparativ ely v ery wel l in v arious situations. They are co mp etitiv e with the existing metho d at a s mall sample size, and tend to outp erform them from a mo derate sample size. Moreo v er, the “omnibu s” prop ert y of the needlets metho d is in teresting for the problem at hand, in whic h the t yp e of p ossi- ble anisotropy (the class of alte rnativ e) is not really w ell kno wn a pr iori. In addition, a multiple test based on the u s e of spherical n eedlets offers a go o d opp ortun ity to extend the metho d of detection of anisotropies with n ot only m u ltiplicit y in the scales tested, but also in ranges of energy of the incom- ing particles. In deed, while in this w ork we hav e used the energy lev el as a simple threshold, one could instead imp lemen t a d etectio n using the joint directional-energy information—allo w ing th us to sim u ltaneously extract in- formation fr om the highest energy cosmic rays, whic h are n ot deflected m uc h b y Galactic and extragalact ic m agnetic fields, and also f r om lo wer energy ev ents, more deflected b ut muc h more n u merous. In light of our sim u lations on an energy lev el-dep end en t mo del, the multisca le approac h could lead to stronger conclusion using the CR d ata that are not y et made p ublic b y the Pierre Auger Ob serv atory . As in any nonparametric metho d, th ere is at least one p arameter to b e tuned, often b y hand or us in g more sophisticated data-drive n method s such as cross-v alidation. In the needlet metho ds one can tune sev eral parameters (shap e of the needlets, h ighest s cale J ⋆ — although there is an asymp totic form u la for it, thr esholds on the co efficien ts in the PlugIn approac hes, thresholds on the individu al tests in th e Mul tiple pro cedure, pow er norm). It is p lausible, h ow ev er, th at a large range of p ossible choi ces for most of these parameters give comparable p er f ormance. Although we hav e used n eedlets th at are compactly supp orted windows in the harmonic sp ace, it ma y b e arguable that they are not the most appropri- ate to ol. One could consider, as an alternativ e, b etter spatially concen trated functions [see, e.g., Lan and Marinucci ( 2009 ), suc h as the Mexican needlets] or, in general, try to optimize the needlet window fun ction giv en prior knowl- edge of the p h ysical pr oblem and of the exp ected prop erties of anisotropic distributions of the cosmic ray direction of incidence. In this spirit, it would b e in teresting to consider directional wa velet such as curve lets or ridgelets [see Starc k et al. ( 2006 )] to test for sp ecific strip-lik e alternativ e d ensities. It is also p ossible to consider n ondy adic needlets. Th e choi ce of B ∈ (1 , 2) TESTING THE ISOTROPY OF HIGH ENERGY COSMIC RA YS 33 allo ws a finer co verag e of the frequency line. Th e numerical results presen ted here ha v e not tak en this b en efi t into fu ll accoun t, and wh ether significantl y higher p ow er can b e obtained b y optimizing this n umb er remains to b e in- v estigated. Finally , in add ition to th e aforementioned p ossible extensions of our meth- o ds, we wan t to stress that the work p resen ted here also op ens the wa y to t wo lines of future inv estigatio ns, one on the applications side and one more theoretical. O n the exp erimental side, it will b e of muc h interest to apply the metho d on larger data sets (for instance, b y lo we ring the energy threshold to increase the a v ailable samp le size). On the th eoretica l side, the v alidation of the ap p roac h h as to b e inv estigate d on the basis of some theory in the minimax framew ork it is designed for. Ac kn o wledgment s. F or the n u merical part of this w ork, w e ac kn o wledge the use of the Healp ix pack age [G´ orski et al. ( 2005 )] and of th e SphereLab (an Oc t a ve inte r face to Healp ix pac k age, needlet tran s forms and u tilities). W e thank Dmitri Semiko z f or useful discuss ions concerning high energy cos- mic ra ys, and Maude le Jeune, Jean-F ran¸ cois Cardoso and F r´ ed´ eric Guilloux for making av ailable some of the to ols used for th e computational asp ects of the present work. W e thank the anon ymous r eferees and Ass o ciate Editor for their suggestions and r emarks that s ignifi can tly imp r o ve d the present ation of this pap er. SUPPLEMENT AR Y MA TERIAL Supp lemen t to “ T esting the isot r op y of high energy cosmic ra ys with spherical needlets” (DOI: 10.121 4/12-A OAS619 S UPP ; .p d f ). In the supple- men t, we recall the construction of the needlet d ecomp osition on the sphere, and d iscuss its p ractical usage. W e also complete the Section 5 of th is pap er with more resu lts obtained from Mon te-Carlo sim u lations. REFERENCES Abraham, J. et al. (2008). Ob serva tion of the suppression of the flux of cosmic ra ys ab ov e 4 × 10 19 eV. Phys. R ev. L ett. 101 061101 . Abraham, J. et al. (2010a). Measurement of the depth of maximum of ext ensive air sho w ers ab ov e 10 18 eV. Phys. R ev. L ett. 104 091101 . Abraham, J. et al. ( 2010b). Measuremen t of the energy spectrum of cosmic rays ab o ve 10 18 eV using the Pierre Auger observ atory. Phys. L ett. B 685 239–24 6. Baldi, P. , Kerky acharian, G. , Mari n ucci, D. and Picard, D. (2009a). A daptive density estimation for directional data using needlets. Ann. Statist. 37 3362–3395. MR2549563 Baldi, P. , Kerky acharian, G. , Marinucci, D. and Picard , D. (200 9b). Asymptotics for spherical needlets. Ann. Statist. 37 1150–117 1. MR2509070 34 F A ¨ Y, DELABROUILLE, KER KY ACHARIAN AND PICAR D Beck, R. (2011). Cosmic magnetic fields: Observ ations and prosp ects. In Americ an Insti- tute of Physics Confer enc e Series ( F. A. Aharonian , W. Hofmann and F. M. Rie ger , eds.) 1381 117–136 . American Institute of Ph y sics, Melville, NY. Beno ˆ ıt, A. et al. (2004). First detection of p olarization of the submillimetre diffuse galac- tic dust emission by A rc heops. Astr on. Astr ophys. 424 571–582. Bha tt acharjee, P. and Sigl, G. (2000). Origin and propagation of ex tremely high energy cosmic rays. Phys . R ep. 327 109–247. Bickel, P. , Kleijn, B. and Rice, J. (2008). Even t- w eighted tests for detecting p erio dicity in photon arriv al times. Astr ophysic al Journal 685 384–389. Bickel, P. J. , R i to v , Y. and Stoker, T. M. (2006). T ailor-made tests for goo dness of fit to semiparametric hyp otheses. Ann. Statist. 34 721–741 . MR2281882 Butucea, C. and Tribouley, K. (2006). Nonparametric homogeneity tests. J. Statist . Plann. I nfer enc e 136 597–639. MR2181971 Cro nin, J. W. (2005). The highest-energy cosmic ra ys. Nucle ar Physics B Pr o c e e dings Supplements 138 465–491 . Crutcher, R. M. , W andel t, B. , Heiles, C. , F algarone, E. an d Tro land, T. H. (2010). Magnetic fi elds in inters tellar clouds from Zeeman observ ations: Inference of total field strengths by Ba yesian analysis . Astr ophysic al Journal 725 466 –479. Delabro u ille, J. , Card oso, J. F. , Le Jeune, M. , B etoule, M . , F a ¨ y, G. and Guil- loux, F. (2009). A full sk y , low foreground, high resolution CMB map from WMAP. Astr onomy and Astr ophysics 493 835–8 57. Donoho, D. L. , Johnstone, I. M. , Kerky acharian, G. and Picard, D. (1996). Density estimation by w av elet thresholding. Ann. Statist. 24 508–539. MR1394974 Efr on, B. and Petrosian, V. (1995). T esting iso tropy versus clustering of Gamma-Ra y bursts. Astr ophysic al Journal 449 216. F a ¨ y, G. an d Guilloux, F. (2011). S p ectral estimation on the sph ere with needlets: High frequency asymptotics. Stat. Infer enc e Sto ch. Pr o c ess. 14 47–71. MR2780648 F a ¨ y, G. , Delabr ouille, J. , Kerky acharian, G. and Picard, D. (2013). Supple- ment to “T esting the isotropy of high energy cosmic rays using spherical needlets.” DOI: 10.1214/1 2-AO AS 619SUPP . F a ¨ y, G. , Guilloux, F. , Betoule, M. , Cardoso, J. F. , Delabro uille, J. and Le Je- une, M. (2008). CMB p ow er sp ectrum estimation using wa velets. Phys. R ev. D 78 083013. F osalba, P. , La zarian, A . , Prunet, S. an d T aub er, J. A. ( 2002). Statistical p roperties of galactic starligh t p olarization. Astr ophysic al Journa l 564 762–772. Fr omont, M. and Laurent, B . (2006). Adaptive go o d ness-of-fit tests in a density model. Ann . Statist. 34 680–720. MR2281881 Gin ´ e M., E. (1975). I nv ariant tests for u niformit y on compact R iemannian manifolds based on Sob olev norms. Ann. Statist. 3 1243–126 6. MR0388663 G ´ orski, K. , Hivon, E. , Ba nda y, A. , W an del t, B. , Ha nsen, F. , R einecke, M. and Bar telmann, M. (2005). HEALPix: A framewo rk for high-resolution discretization and fas t analysis of data distributed on th e sphere. Astr ophysic al Journal 622 759–771. Greisen, K. (1966). End to the cosmic-ra y sp ectrum? Phys. R ev. L ett. 16 748–750. Han, J. L. , M anchester, R. N. , L yne, A. G. , Qiao , G. J. and v an Stra ten, W. (2006). Pulsar rotation measures and th e large-scale structure of t he galactic magnetic field. Astr ophysic al Journal 642 868–881. Harari, D. , Mollera ch, S. and Ro u let, E. (2002). Astrophysical magnetic fi eld recon- struction an d spectroscopy with ultra h igh energy cosmic ra y s. J. High Ener gy Phys. 7 6. TESTING THE ISOTROPY OF HIGH ENERGY COSMIC RA YS 35 Heiles, C. (1996). A compreh ensive view of the galactic magnetic fi eld, especially near the Sun. In Polarim etry of the Interstel lar Me di um ( W. G. Rober ge and D. C. B. Whit- tet , eds.). Astr onomic al So ciety of the Pacific Confer enc e Series 97 457. A stonomical Society of the Paci fic, San F rancisco, CA. Hillas, A. M. (1984). The origin of ultra-high-energy cosmic rays. Annual R eview of Astr onomy and Astr ophysics 22 425–44 4. Ingster, Y. I. (1993). Asymptotically minimax hyp othesis testing for n onparametric alternativ es. I. Math. Metho ds Stat ist. 2 85–114. MR1257978 Ingster, Y. I. (2000). Adaptive c hi-sq uare tests. J. Math. Scienc es 99 1110–1120. Ingster, Y. I. and Suslina, I. A. (2003). Nonp ar ametric Go o dness-of-fit T esting Under Gaussian Mo dels . L e ctur e Notes in Statistics 169 . Springer, New Y ork. MR1991446 Juditsky, A. and Lamber t-Lacr oix, S. (2004). O n minimax den sity estimation on R . Bernoul li 10 187–2 20. MR2046772 Kachelriess, M. and Semikoz, D. V. (2006). Clustering of ultra-high energy cosmic ray arriv al directions on medium scales. Astr op article Physics 26 10–15. Kerky a charian, G. , Pham Ngoc, T. M. and Picard, D. (2011). Lo calized spherical deconv olution. Ann. Statist. 39 1042–106 8. MR2816347 Kerky a charian, G. , Petrushev, P. , Picard, D. and Willer, T. (2007). Needlet al- gorithms for estimation in inv erse problems. Ele ctr on. J. Stat. 1 30–76. MR2312145 Kerky a charian, G . , Kyriazi s, G. , Le Pennec, E. , Petrushev, P. and Picard, D. (2010). Inv ersion of n oisy Radon transform by SVD b ased needlets. Appl. C om put. Harmon. Ana l. 28 24–45. MR2563258 Ko te ra, K. and Olin to, A. V. (2011). The astrophysics of ultrahigh-energy cosmic ra y s. Ann ual R eview of A str on and Astr ophys 49 119–1 53. Laco u r, C. and Pham Ngoc, T. M. (2012). Go od n ess-of-fit test for noisy directional data. Av ailable at arXiv: 1203.20 08 . Lan, X. and Marinucci, D. (2009). On the dep endence structure of w av elet co efficients for spherical random fields. Sto chastic Pr o c ess. Appl. 119 374 9–3766. MR2568294 Lehmann, E. L. and R omano, J. P. (2005). T esting Statistic al Hyp otheses , 3rd ed . Springer, New Y ork. MR2135927 Marinucci, D. , Pietrobon, D. , Balbi, A. , B aldi, P. , Cabella, P. , Kerky achar- ian, G. , Na toli, P. , Picard, D. and V i ttorio, N . (2008). Sp h erical needlets for CMB data analysis. Monthly Notic es of the Ro yal Astr onomic al So ci ety 383 539–5 45. Mar t ´ ınez, V. J. and Saar , E. (2002). Statistics of the galaxy distribution . Chapman & Hall/CR C Press, Boca Raton, FL. Meyer, Y. (1992). Wavelets and Op er ators . Cambridge Studies in A dvanc e d M athematics 37 . Cam bridge Un iv. Press, Cambridge. T ranslated fro m the 1990 F rench original by D. H. Salinger. MR1228209 Nara y an, R. and Piran, T. (1993). Do gamma-ray burst sources rep eat? Monthly Notic es of the R oyal Astr onomi c al So ciety 265 L65–L68. Narco wich, F. , Petrushev, P. and W ard, J. (2006a). Decomp osition of Besov and Triebel–Lizorkin spaces on the sphere. J. F unct. Anal. 238 530– 564. MR2253732 Narco wich, F. J. , Petr ushev, P. and W ard, J. D. ( 2006b). Lo calized tight frames on spheres. SIAM J. M ath. Anal. 38 574–5 94 (electronic). MR2237162 P a ge, L. et al. (2007). Three-year Wilkinson Microw av e Anisotrop y Prob e (WMAP) observ ations: Pola rization analysis. Astr ophysic al Journal Supplement 170 335–376. Petr ushev, P. and Xu, Y. (2008). Lo calized p olynomial frames on the ball. Constr. Appr ox. 27 121–148. MR2336420 36 F A ¨ Y, DELABROUILLE, KER KY ACHARIAN AND PICAR D Pierre Auger Collab oration ( A brah a m, J. et al.) (2008). Correlation of the highest-energy cosmic rays with t he p ositions of nearby activ e gala ctic nuclei. Astr op article Physics 29 188–204 . Pierre A u ger Collaboration ( Abrah a m, J. et al.) (2009). Upp er limit on the cosmic- ra y ph oton fraction at EeV energies from the Pierre Au ger observ atory . A str op article Physics 31 399–406 . Pierre A uger Collaboration ( Abreu, P. et al.) (2010). Up date on the correlation of the highest energy cosmic rays with n earb y extragalactic matter. Astr op article Physics 34 314–326 . Pietro bon, D. , B albi, A . and Mari nucci, D. (2006). Integra ted Sachs–Wo lfe effect from the cross correlation of WMAP3 year and th e NR AO VLA sky survey data: New results and constraints on dark energy. Phys. Re v. D 74 043524. Pietro bon, D. , A mblard, A. , B a lbi, A. , Cabella, P. , Coora y, A. and M arin- ucci, D. (2008). Needlet detection of features in the WMAP CM B sky and the impact on anisotropies and hemispherical asymmetries. Phys. R ev. D 78 103504. Quashnock, J. M. and Lamb, D. Q. (1993). Evidence for the Galactic origi n of gamma- ra y bursts. Monthly Notic es of the R oyal Astr onomi c al So ciety 265 L45–L50. Rudjord, Ø. , Hansen, F. K. , Lan, X. , Li guori, M. , Mari n ucci, D. and Ma t ar- rese, S. (2009). An estimate of the p rimordial non-Gaussianity parameter f NL using the needlet bisp ectrum from WMAP. Astr ophysic al Journal 701 369–376. Sommers, P. (2001). Cosmic ray anisotropy analysis with a full-sky observ atory . A str op ar- ticle Physics 14 271–28 6. Spok oiny, V. G. ( 1996). Adaptive hypoth esis testing using wa velets. Ann. Statist. 24 2477–24 98. MR1425962 St ar ck, J. L. , Moudden, Y. , Abrial, P. and Nguyen , M. (2006). W a velets , ridgelets and curvelets on t he sphere. Astr onomy and Astr ophysics 446 1191–12 04. Torres, D. F. and An chordoqui, L. A. (2004). Astrophysical origi ns of ultrahigh energy cosmic ra ys. R ep. Pr o gr. Phys. 67 1663–1730. Triebel, H . (1992). The ory of F unction Sp ac es. II . Mono gr aphs in Mathematics 84 . Birkh¨ a user, Basel. MR1163193 Za tsepin, G. T. and Kuz’ min, V. A. (1966). Upp er limit of the sp ectrum of cosmic rays. Soviet Journal of Exp erimental and The or etic al Physics L etters 4 78. G. F a ¨ y Labora toire MAS Ecole Centrale P aris Grande V oie des Vignes 92 295 Ch ˆ atena y-Mala br y France E-mail: gilles.fay@ecp.fr J. Delabrouille Labora toire APC, CNRS UMR71 64 10 rue A. Domon et L. Du quet 75013 P aris France E-mail: delabrouille@apc.uni v-paris7.fr G. Kerky acharian Universit ´ e P aris X-Nanterre CNRS LPMA 175 rue du Chev a leret 75013 P aris France E-mail: k erk@math.jussieu.fr D. Picard Universit ´ e P aris Diderot CNRS LPMA 175 rue du Chev aleret 75013 P aris France E-mail: picard@math.jussieu.fr
Original Paper
Loading high-quality paper...
Comments & Academic Discussion
Loading comments...
Leave a Comment