An agent-based epidemiological model of incarceration
We build an agent-based model of incarceration based on the SIS model of infectious disease propagation. Our central hypothesis is that the observed racial disparities in incarceration rates between Black and White Americans can be explained as the r…
Authors: Kristian Lum, Samarth Swarup, Stephen Eubank
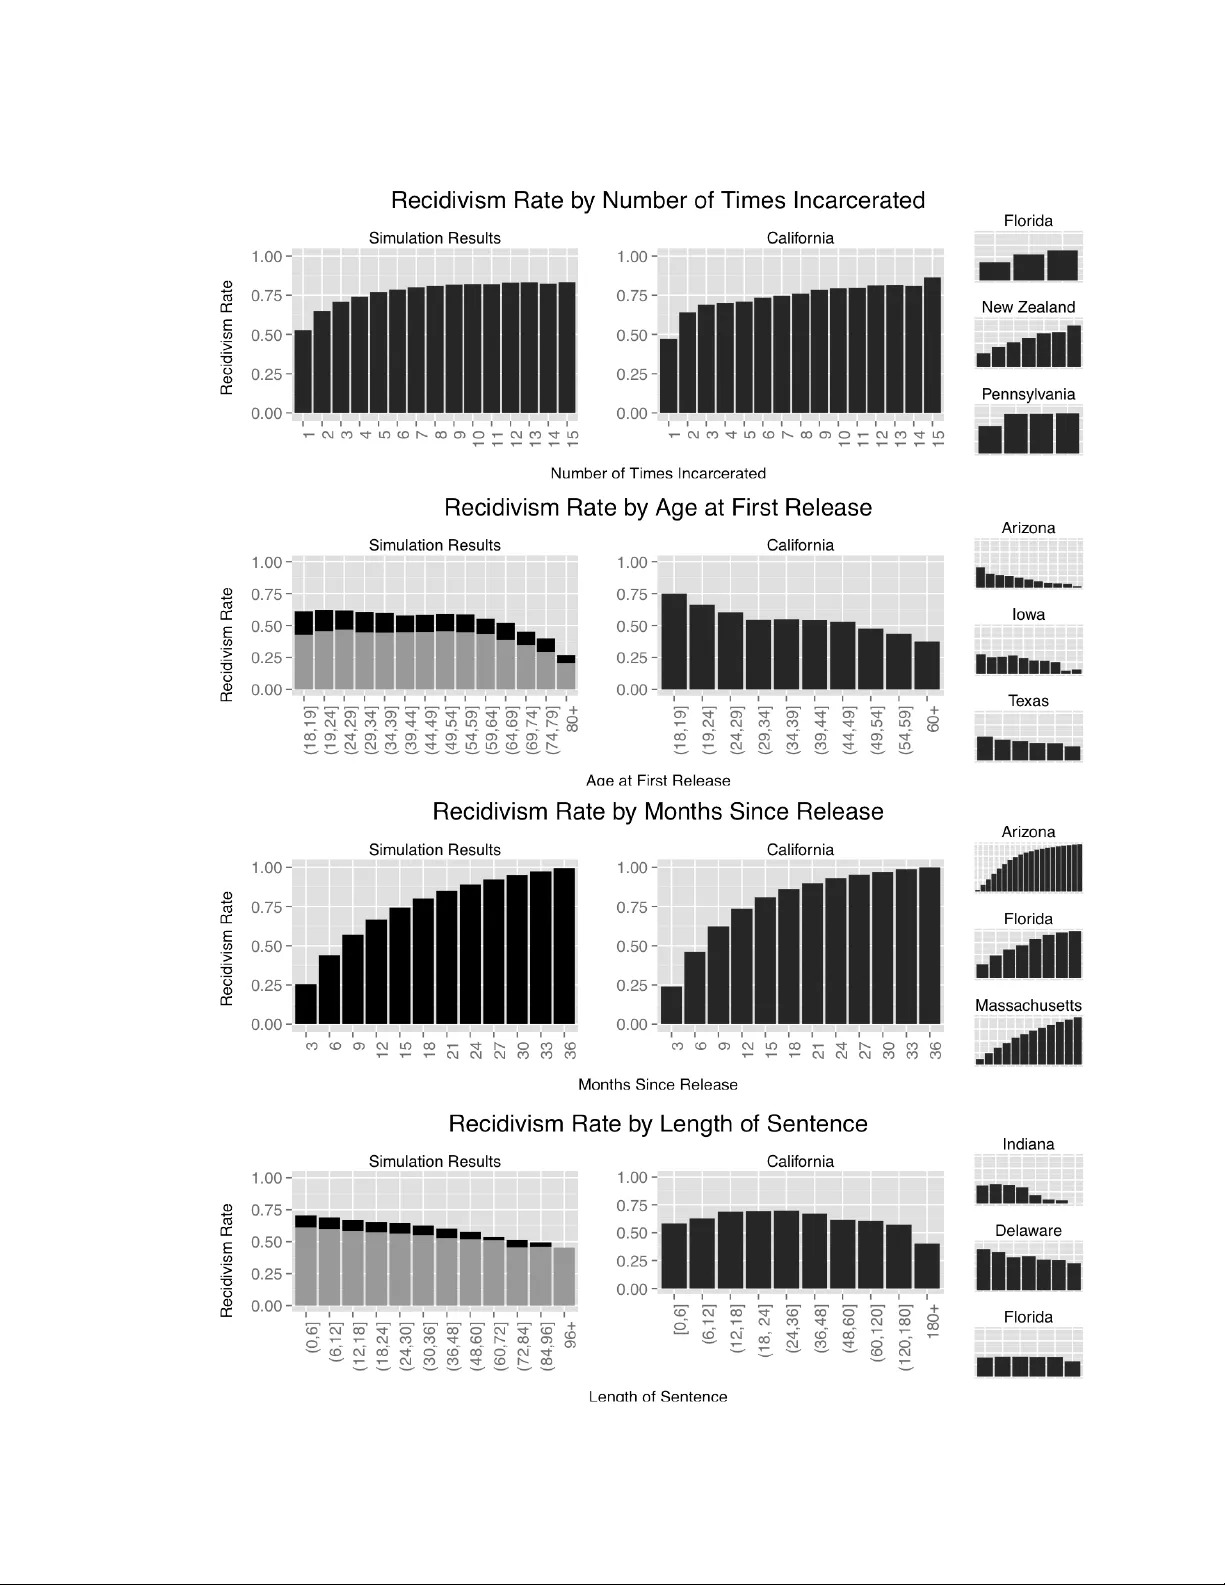
AN A GENT-BASED EPIDEMIOLOGICAL MODEL OF INCAR CERA TION KRISTIAN LUM 1 , SAMAR TH SW AR UP 1 , STEPHEN EUBANK 1 , JAMES HA WDON 2 1 Net w ork Dynamics and Sim ulation Science Lab oratory , Virginia Bioinformatics Institute, Virginia T ech 2 Departmen t of So ciology , Virginia T ec h Abstract. W e build an agen t-based mo del of incarceration based on the SIS mo del of infectious disease propagation. Our cen tral hypothesis is that the observed racial disparities in incarceration rates b et w een Black and White Americans can b e explained as the result of differential sen tencing b et ween the tw o demographic groups. W e demonstrate that if incarceration can b e spread through a social in- fluence netw ork, then even relatively small differences in sentencing can result in the large disparities in incarceration rates. Con trolling for effects of transmissi- bilit y , susceptibilit y , and influence net w ork structure, our mo del repro duces the observ ed large disparities in incarceration rates given the differences in sen tence lengths for White and Blac k drug offenders in the United States without extensive parameter tuning. W e further establish the suitabilit y of the SIS mo del as applied to incarceration, as the observed structural patterns of recidivism are an emergent prop ert y of the model. In fact, our mo del shows a remark ably close corresp ondence with California incarceration data, without requiring any parameter tuning. This w ork adv ances efforts to combine the theories and methods of epidemiology and criminology . k eyw ords: epidemiological criminology , agent-based mo del, incarceration, SIS mo del, influ- ence net work, simulation 1. Introduction The rapid increase in the U.S. incarceration rate o v er the last few decades has b een describ ed as an epidemic. According to Bureau of Justice Statistics, the per capita rate of incarceration nearly quadrupled b et ween 1978 and 2011, from 137 to 511 p ersons p er 100,000 [8]. This prison b o om has primarily affected Blac k Americans, esp ecially Blac k males. By 2011, Black incarceration rates w ere o v er six times higher than White rates (3,023 p er 100,000 for Blacks, and 478 p er 100,000 for Whites). Racial disparities in incarceration rates hav e b een studied extensiv ely[16, 20, 14, 13, 21], and while these disparities are partially due to differences in criminal in v olv e- men t [12], the increase in imprisonmen t for Black males since 1980 was not matc hed 1 2 KRISTIAN LUM 1 , SAMAR TH SW ARUP 1 , STEPHEN EUBANK 1 , JAMES HA WDON 2 b y a similar increase in Black-male criminality [3, 2, 25]. What then accounts for the racial disparities in incarceration? Scholars offer several explanations, including differen tial exp osure to police surv eillance [2], prosecutorial discrimination [17], the use of incarceration to deal with a “racial threat” [7, 23], or sentencing disparities b e- t w een Blac ks and Whites. Although studies rev eal that racial sen tencing disparities are reduced when legal factors [29, 15, 6] or social contexts [11, 28] are considered, a recen t meta-analysis rep orts that sentencing disparities remain even after c ontr ol ling for these factors [14]. While the magnitude of the difference is small and v ariable, it is largest in cases inv olving discretionary p ow ers and for drug offenses. In fact, it has been shown that Blacks receive longer sentences than Whites for drug offenses [2, 20]. Careful study of patterns of incarceration reveals that incarceration b eha ves lik e a con tagious disease in that the close asso ciates of an incarcerated person ha v e higher- than-a v erage probabilities of b eing incarcerated. An individual’s incarceration can b e “transmitted” to others via several mec hanisms. It can increase the strains fam- ily mem b ers must endure, exp ose them to criminal norms, and enmesh them in a criminal sub culture, thereby increasing the probabilit y these p eople w ould them- selv es commit crimes [1, 18] and b e incarcerated. Alternativ ely , once a p erson is incarcerated, the p olice and courts pa y more attention to the inmate’s family and friends, thereb y increasing the probabilit y they will be caugh t, prosecuted and im- prisoned [24, 10, 4]. Regardless of the mec hanisms in volv ed, the incarceration of one family member undoubtedly increases the likelihoo d of other family mem b ers b eing incarcerated [27, 22, 26, 19]. This suggests that mo dels of contagion ma y aptly c haracterize incarceration. It is w ell kno wn that some mo dels of con tagion exhibit nonlinearities. Nonlinear pro cesses suc h as infectious disease outbreaks are capable of amplifying small differ- ences in parameters through feedback in certain circumstances. One suc h example is the SIS (Susceptible-Infected-Suspectible) in whic h individuals transition betw een susceptible and infectious states– near a critical v alue of transmission probability , p ositiv e feedbacks amplify small differences in transmission rate to create large dif- ferences in pr evalenc e , the num ber of infected p eople. Here we explore the p ossibilit y that the dramatic racial disparity in incarceration rates is a consequence of a disparity in sentencing via analogous nonlinearities to those describ ed. Our h yp othesis is that the differences in sen tencing b et ween Blacks and Whites result in disparate transmission probabilities near a critical p oin t, caus- ing the incarceration epidemic to reach very different levels of prev alence under the t w o sen tencing sc hemes. Using an agen t-based SIS mo del, we sim ulate the spread of incarceration through a highly realistic synthetic p opulation. W e run our sim ula- tions under one scenario in which sen tence lengths are consisten t with those receiv ed b y Black Americans for drug p ossession and under a second scenario in which the AN A GENT-BASED EPIDEMIOLOGICAL MODEL OF INCAR CERA TION 3 sen tence lengths are representativ e of those received by Whites. W e demonstrate here that if incarceration is infectious-lik e in that one’s incarceration causes his or her family and friends to themselves b ecome more lik ely than the general p opula- tion to b e incarcerated, then it is plausible that the observed large disparities in incarceration rates b etw een Black and White Americans are the result of inequity in sen tencing. 2. The susceptible - incarcera ted -susceptible (SIS) model The h yp othesized “transmissibility” of incarceration suggests that an SIS mo del in which incarceration is mo deled as though it w ere an infectious disease is appropri- ate. An agen t-based sim ulation of the SIS mo del requires three main comp onen ts: a con tact net w ork through whic h individuals sto c hastically transmit the disease, trans- mission probabilities that dictate the rate at which agen ts transmit to eac h other, and a p erio d of infectivity [5]. Net w ork ties represent opp ortunities for transmission, and the structure of the netw ork through whic h the disease spreads affects the dy- namics of the outbreak. In a disease mo del, net w ork ties b et ween agen ts t ypically denote physical con tact or close pro ximity; in the case of incarceration, they denote the existence of a familial relationship or close friendship, i.e. the existence of a strong influence b etw een the agents. In the disease mo deling paradigm, transmission probabilities may b e a function of characteristics of the individual agen ts (e.g., elderly individuals hav e a higher probabilit y of con tracting a disease) or the relationship b et ween the agen ts (e.g., transmission rates are higher b etw een parents and small c hildren). In our mo del, incarcerated p eople are considered “infectious” to those who are most profoundly affected b y their absence. Incarcerated people “transmit” the incarceration “disease” to their net work mem b ers with a probability that is a function of the relationship t yp e (e.g. an individual’s incarceration has greater effect on his or her child than on a friend) and p ersonal characteristics (e.g. males are more susceptible than females). W e denote the probability that infected agent i transmits to susceptible agent j b y p ( i → j ). In mo deling the spread of disease using the SIS mo del, the p erio d of infectivity , s , is the duration of time during whic h the infected individual is contagious. In our model s is the length of the individual’s prison sentence, as that is the time during whic h the inmate’s family and close friends are acutely affected. Here, we do not explicitly mo del increased risk of incarceration due to an inmate’s difficulty re-integrating in to so ciet y . In our mo del, individuals released from prison cease to be “infectious” and return to a “susceptible” state from which they ma y b ecome re-infected. The source of the new infection will be incarcerated friends and relations, in tro ducing p ositiv e feedbac k in to the system. Given the infectious p erio d, the probabilit y that agent 4 KRISTIAN LUM 1 , SAMAR TH SW ARUP 1 , STEPHEN EUBANK 1 , JAMES HA WDON 2 i transmits the disease to agent j o v er the whole course of the infectious p erio d is giv en by p s ( i → j ) = 1 − (1 − p ( i → j )) s i.e. the complement of the probability that agent i do es not transmit to agent j in an y of the s iterations during which it is infectious. Th us, for fixed p ( i → j ), a longer infectious p erio d results in a higher transmission probabilit y (see Figure 1) and a greater c hance that the outbreak b ecomes widespread. 0 100 200 300 400 500 0.0 0.2 0.4 0.6 0.8 1.0 T ransmission Probability Over Whole Sentence Sentence Length (months) Probability of T ransmission Figure 1. As an example, w e assume that at eac h iteration (mon th), an agen t transmits with probabilit y p = . 1. This shows the probabilit y that a transmission would ha v e been made throughout the duration of the sentence as a function of sentence length in months. 3. Simula tion over view W e syn thesize a realistic m ulti-generational p opulation of agents for which all fam- ily and friendship ties are kno wn. All parameters inv olv ed in creating this p opulation are based on recen t, high quality data. F or example, distributions for the sex, lifes- pan, and the n umber of children of eac h agent are tak en from the US Census, the Cen ters for Disease Con trol and Prev en tion, and the So cial Security Administration, resp ectiv ely . The total population consists of 8,856 agen ts, with 61,376 family and friendship ties. T ransmission probabilities are derived directly from the survey of prison inmates presen ted in [9]. This surv ey provides the probability that an in- mate’s mother, father, sister, brother, or adult c hild are also incarcerated b y inmate gender. That is, p ( i → j ) is tak en directly from the literature. In our simulation, w e treat close friends as siblings in terms of transmission probabilities. W e fo cus on the crime of drug possession, and use data from the Bureau of Justice Statistics to deriv e sentence lengths b y race. AN A GENT-BASED EPIDEMIOLOGICAL MODEL OF INCAR CERA TION 5 Using this h yp othetical synthetic population, we run “Blac k” sim ulations in whic h incarcerated agents are assigned sen tences that are consistent with those receiv ed by Blac k Americans for drug possession and “White” sim ulations using a distribution of sen tence lengths corresp onding to those received by White Americans for the same crime, as described. In or der to test whether differ ential sentencing alone c an explain r acial disp arities in inc ar c er ation r ates, we use the same tr ansmission pr ob abilities and the same network to r epr esent b oth Black and White p opulations . 4. Model Components 4.1. Syn thetic Population. W e b egin with a seed p opulation of n = 1500 individ- uals, { a 1 , a 2 , ..., a n } , from whic h all members of the p opulation will b e descendan ts. T o initialize eac h agen t, it is assigned sev eral attributes. The i th agen t, a i , is assigned a gender from the distribution g i ∼ Bernoulli( . 5), a birth year ( b i ∼ Uniform( L, U )), and a spatial lo cation in the unit square ( x i , y i iid ∼ Uniform(0 , 1)). The lo cation may b e though t of geographically , as a ph ysical location in a cit y , or as a preference space. Regardless of how one prefers to conceptualize the spatial location, it serv es the func- tion of creating comm unities in the netw ork, as friends and sp ouses are selected with resp ect to these locations. T o sim ulate a realistic distribution of life durations, the age at death is sampled according to the 2009 life tables released b y the So cial Se- curit y Administration. 1 In these tables, the probability of death in the next year at eac h age (from 0-119) is giv en b y sex. W e treat these as the probabilities of death at each age throughout the simulation. If individual i is female and b orn in y ear b i , we select a life duration, l i , at random from the distribution given in the female life tables (i.e. l i ∼ Multinomial( p female )). The iteration of death is then given b y d i = b i + l i . F emale agen ts are assigned an age at first birth attribute. Age at first birth is based up on a figure released b y the Center for Disease Control, which lists the mean age at first childbirth for women in 2011 as 25.6 y ears. 2 W e specify h i , the age at first birth, to b e drawn from the distribution h i = 15 + r i where r i ∼ P oisson(10 . 6), whic h has mean 25.6. Eac h female agen t is also assigned the num ber of c hildren she will ha v e through- out her lifetime.The US Census provides the distribution of the num b er of children w omen in the age brack et 40-44 ha ve had and lists the total fertilit y rate for several y ears b et ween 1980 and 2008 , whic h ranges from ab out 1.84 to 2.1. Because w e do not wan t our simulated p opulation to die out, se adjust the raw distribution given in for 40-44 year old women to be consisten t with historical fertility rates. Under this adjusted distribution, the exp ected fertility rate is 2.07 c hildren p er woman. 1 ( http://www.ssa.gov/oact/STATS/table4c6.html ) 2 http://www.cdc.gov/nchs/data/nvsr/nvsr62/nvsr62_01.pdf 6 KRISTIAN LUM 1 , SAMAR TH SW ARUP 1 , STEPHEN EUBANK 1 , JAMES HA WDON 2 4.2. Net w ork Ties. In addition to p ersonal characteristics, each agen t is endo wed with relationships with other agen ts. These are represen ted as edges in a netw ork. In our simulation, all parent-c hild, sibling, sp ouse and close friend relationships are represen ted. When an agent reac hes its 10th “birthda y”, the agent forms friendship ties. In order to select the n um b er of close friends assigned to each agent, w e use data from the 2004 General Social Survey 3 , in whic h resp ondents indicate the num ber of individuals with whom they discuss imp ortant matters and their relationship to up to fiv e of these p eople. Because man y familial relations are already accounted for in our simulation, w e coun t only those p eople listed who are not paren ts, c hildren, sp ouses or siblings to calculate the probabilit y of selecting eac h possible n um b er of friends, f i . Conditional on f i , w e select the sp ecific agents that will b e designated as friends. W e consider p oten tial friends to b e non-siblings b etw een the ages of 9 and 11. This age range is based on information obtained from the National Longitudinal Study of Adolescen t Health 4 , in whic h c hildren were asked to list sev eral of their friends. Of the friends listed, nearly 95% w ere within one grade of the studen t (75% shared the same grade). Because friends within one year of the students made up the ma jority of close childhoo d friendships, we also restrict to this range. F rom this set of p oten tial friends, we select the f i agen ts that are closest in Euclidean space to the given agen t. In the iteration in whic h a female actor’s first child is b orn, she is assigned a partner. In this hypothetical p opulation, we only mo del opp osite-sex sp ousal ties. The algorithm first finds all p otential partners – unrelated and non-friend male agen ts whose current age is b etw een the female agen t’s age and nin e y ears older. W e selected this scheme based up on data from the 1999 US Census that sho ws that for ab out 80% of marriages, the husband’s age minus the wife’s age falls in to the range [ − 1 , 9]. W e restrict male agents to b e strictly older than female agents, as our partner selection algorithm tends to force the age of the male partners to fall to the lo wer end of the allo w able range. F rom this collection of p oten tial partners, the agen t is assigned the p oten tial partner that is lo cated the closest to it, again using Euclidean distance. A t this point, the children of the couple (or single mother) are initialized. The first c hild is assigned to b e b orn in the curren t iteration. Subsequent children are assigned birth y ears as the curren t iteration plus indep enden t and iden tically distributed draws from a Poisson distribution with mean parameter λ = 4 . 5. The mean parameter, λ , is again based on the Centers for Disease Con trol’s data used to calibrate the age at first birth. Child lo cations are set to b e half wa y b et ween the mother and father’s lo cation plus random noise (Uniform( m 1 − . 05 , m 2 + . 05)), where m 1 and m 2 3 http://www3.norc.org/gss+website/ 4 http://www.cpc.unc.edu/projects/addhealth ; data not publicly a v ailable AN A GENT-BASED EPIDEMIOLOGICAL MODEL OF INCAR CERA TION 7 are the midp oin ts b etw een the mother and father’s lo cation along the x and y axis, resp ectiv ely . W e run our algorithm for 200 iterations, resulting in a total p opulation of 13,826 individuals. W e discard the first 150 iterations as a burn-in p erio d, reducing dep en- dence on our initial conditions. Those agents that are part of our sim ulation (i.e. those that are alive at an y p oin t b eyond the 150th iteration) are retained, resulting in a p opulation of size 8,856. The left panel of Figure 2 shows an example family tree generated b y our algorithm. This individual family , of course, do es not exist in isolation of the rest of the p opulation. The p opulation-wide net w ork is shown in the righ t panel. A 2 Birth: 79 Death:154 Birth: 75 Death:163 A 1 Birth: 107 Death:177 B 2 Birth: 1 13 Death:194 B 4 Birth: 101 Death:174 B 1 Birth: 109 Death:187 B 3 C 2 C 3 Birth: 127 Death:205 Birth: 135 Death:21 1 C 4 Birth: 136 Death:216 C 1 Birth: 125 Death:208 C 6 C 8 Birth: 144 Death:214 C 5 Birth: 141 Death:22 8 C 7 Birth: 149 Death:241 Birth: 155 Death:246 4 children … 3 children … 2 children … Figure 2. (left) One family from the synthetic p opulation (righ t) The net w ork of agen ts in our sim ulation. Different colors indicate com- m unities found in the net w ork. These comm unities are not explicitly included in the sim ulation 5. Genera ting Sentences Data released b y the Bureau of Justice Statistics 5 indicates that the duration of sen tence served for the same crime v aries b y race. In particular, the Bureau of Justice Statistics states that for drug possession, the mean sen tence for Whites is 14 months with a median of 10 months. F or Blac ks, the mean sen tence serv ed is 17 months with a median of 12 months. W e use a negativ e binomial distribution to generate sen tence lengths that are consistent with the specified summary statistics. A comparison of the sentence distributions is shown in Figure 3. 5 http://www.bjs.gov/index.cfm?ty=pbdetail&iid=2056 8 KRISTIAN LUM 1 , SAMAR TH SW ARUP 1 , STEPHEN EUBANK 1 , JAMES HA WDON 2 Figure 3. Comparison of the distribution of sen tence lengths for Whites and Blacks under our sim ulation parameters. These distri- butions are fitted to data released b y the Bureau of Justice Statistics. 6. Transmission Probabilities Dallaire [9] presen ts the results of a surv ey of incarcerated individuals. In this surv ey , eac h inmate is ask ed which of their relations are also incarcerated. The prop ortion of inmates whose relations are incarcerated are reported in this data by sex. W e use these probabilities to deriv e our transmission probabilities, p ( i → j ). W e ha v e noted that if agen t i has probabilit y p ( i → j ) of infecting agent j each month it is incarcerated and its sen tence is s months, then the probabilit y of transmission o v er the course of its incarceration, p sentence ( i → j ), is given b y , p sentence ( i → j ) = 1 − (1 − p ( i → j )) s . One can easily solve for p ( i → j ) = 1 − (1 − p sentence ( i → j )) 1 s . W e set s = 14 to approximately calibrate to a v alue betw een the Blac ks and Whites. The derived monthly transmission probabilities used in this sim ulation are given in T able 1. The deriv ed monthly transmission probabilities are most usefully understo o d in the con text of the probabilit y of transmission av eraging o v er sen tence length, i.e. the marginal transmission probabilities, AN A GENT-BASED EPIDEMIOLOGICAL MODEL OF INCAR CERA TION 9 T able 1. Derived monthly transmission probabilities, p ( i → j ). w omen men mother 0.001 0.003 father 0.011 0.011 sister 0.008 0.004 brother 0.033 0.030 sp ouse 0.004 0.001 adult child 0.017 0.006 (1) p race ( i → j ) = ∞ X s =0 p sentence ( i → j ) π race ( s ) , where p sentence is defined ab ov e and π race ( s ) is the distribution of sentence lengths for eac h race. Marginal probabilities by race, sex of inmate, and relation are given in T able 2, along with the original probabilities listed in [9]. These were calculated using the Mon te Carlo metho d. W e notice that our marginal probabilities for the White sen tences tend to be just slightly lo w er than those giv en. F or Blac k sen tences, the marginal probability of transmission tends to b e sligh tly higher than that giv en. This is, of course, unsurprising as the sentences tend to b e shorter for Whites and they th us ha v e fe wer opp ortunities for transmission. Recall that the mon thly transmission rates under the tw o scenarios are precisely the same, so one should not interpret the differences in marginal probabilities to mean that this mo del implies that Blac ks are more susceptible than Whites under the same conditions. The only differences that exist here are due to the discrepancies in sen tencing. W e find that the probability of transmission for Blacks under these parameters tends to b e ab out 20% greater than the probability of transmission for Whites. Resul ts W e run our simulation 250 times using each sen tence length distribution, resulting in 250 “Black” epidemics and 250 “White” epidemics. The p opulations are initialized to ha ve appro ximately 1% of individuals incarcerated at the b eginning of the simula- tion. Although White and Black incarceration rates, in reality , were differen t in the mid-80s, we initialize the simulations equiv alently under the t w o scenarios to rule out the p ossibility that the resultan t disparities are due to initial conditions alone. Our first analysis lo oks at the effects of differential sentencing after 50 y ears. Figure 2a sho ws the mean epidemic curves and corresp onding confidence interv als by race. Figure 2b shows sev eral example tra jectories. While the prison epidemic tak es off 10 KRISTIAN LUM 1 , SAMAR TH SW ARUP 1 , STEPHEN EUBANK 1 , JAMES HA WDON 2 T able 2. Probabilities given in [9] and marginal transmission probabilities for Whites and Blacks. Surv ey White Blac k w omen men women men women men mother 0.012 0.048 0.012 0.046 0.014 0.056 father 0.147 0.148 0.138 0.138 0.163 0.163 sister 0.107 0.059 0.101 0.058 0.121 0.069 brother 0.377 0.349 0.324 0.303 0.370 0.347 sp ouse 0.059 0.011 0.057 0.011 0.069 0.013 adult child 0.213 0.085 0.194 0.082 0.227 0.098 under Blac k sentence lengths, reac hing just under 3% incarcerated on av erage after 50 years, the mo del using White sen tence lengths indicates that the prison p opula- tion first declines and then increases at a m uch slo w er rate, reac hing about 0.725% o v er the same time p erio d. Figure 2c shows the results of remo ving transmission from the mo del, i.e. simulating a situation in whic h agents sp on taneously b ecome incarcerated indep endent of any relationship with an incarcerated p erson. W e set the probabilit y of spontaneous infection such that at the end of the simulation, the Blac k p opulation’s prev alence is roughly 3% as in the SIS sim ulations. Based on this, we conclude that sentence length disparities in the absence of net work effects do not account for the observed difference in incarceration rate, as this mo del results in a difference b et w een the tw o curves of only ab out 20%. It is feedbac k through the lo cal net w ork coupled with sen tencing disparities that causes suc h large differences in incarceration rates. Finally , as a comparison with real data, we initialize the Blac k and White sim u- lations to b e near the real incarceration rates in California in the mid-1980s when mandatory drug sen tencing b ecame law (1% and 0.15% for Blac ks and Whites re- sp ectiv ely). The results of this are shown in Figure 5. F rom 1986 to 2010, the incarceration rate for Blacks in California clim b ed from ab out 1% to 2.18%, whereas the rate for Whites rose muc h more mo destly from 0.15% to 0.277%. In our simu- lations, the Blac k and White sim ulations increase to 2.25% and 0.34%, resp ectiv ely , o v er the same time p erio d. F or the black tra jectory , our mean tra jectory deviates sligh tly though the ultimate results after 25 years are remark ably similar to real- it y; ho w ever, we note that the real tra jectory in California is well within the range of v alues that are t ypical under our simulation, as it falls well within the cloud of tra jectories sho wn. The white tra jectory in California is quite similar to the mean tra jectory in our simulation. AN A GENT-BASED EPIDEMIOLOGICAL MODEL OF INCAR CERA TION 11 Figure 4. (a) The mean incarceration prev alence b y race. Log p- v alues shown b elow indicate that at all but the first time p oint, the mean prev alence is significantly differen t b etw een the t w o p opulations. (b) Several example epidemic curves. (c)The mean incarceration prev a- lence under a non-con tagious mo del. Figure 5. The incarceration rate in California b y y ear and race. The n um b er of incarcerated p eople by race and y ear w as calculated us- ing the National Prisoner Statistics data set from the Inter-Univ ersit y Consortium for P olitical and So cial Research. The total n umber of p eople in California by race and y ear was calculated from the Califor- nia Department of Finance. Additionally , in Figure 6 we compare the recidivism rates deriv ed from the sim u- lation mo del to those released b y the state of California. The plots to the right sho w the same statistics from a v ariet y of other states. These v ary b ecause not all states 12 KRISTIAN LUM 1 , SAMAR TH SW ARUP 1 , STEPHEN EUBANK 1 , JAMES HA WDON 2 release the same statistics; w e chose California as our primary p oin t of comparison b ecause its rep ort shows recidivism rates by the most factors and at the highest lev el of discretization. Remark ably , our mo del repro duces the structural properties of recidivism v ery accurately . F or example, in b oth our mo del and the data from California, recidivism rates increase with the num ber of times an inmate has b een incarcerated, with the largest increase o ccurring b etw een the first and second in- carceration. This effect emerges as a structural prop erty of the SIS mo del without including an incr e ase d pr ob ability of inc ar c er ation for those who have pr eviously b e en inc ar c er ate d . An agen t’s incarceration affects its lo cal netw ork enough that, up on release, it has a higher probabilit y of return. In all cases, including our simulation results, the recidivism rate is lo wer for those who are released at an adv anced age. In fact, our simulation ev en reproduces a subtle demographic bulge in rates that is apparen t in the California rep ort. This is again an emergen t prop erty of the mo del – as an agen t ages, it tends to ha v e fewer (and differen t t yp es of ) contacts who gener- ate p ositive feedbac k for incarceration. The rate b y months since release (for those who recidiv ated within three years) closely matches the structure of the data from all states. These results suggest that our mo del is reflecting the underlying regularities in the system. 6.1. An ordinary differential equations (ODE) approach. Under assumptions of random mixing and homogeneity of transmission rate, the SIS mo del can b e written as a set of ordinary differential equations. In this case, the num b er of p eople infected – the pr evalenc e – when an outbreak reac hes a steady state, I , is determined by the exp ected num ber of transmissions p er infected p erson, whic h in turn is given b y the pro duct ps of transmission rate and the duration of infectivit y . The presence of a p ositiv e feedback lo op makes the relation b et ween prev alence and num b er of transmissions highly nonlinear. In particular, ignoring births and deaths, I = 0 if s < p − 1 and 1 − 1 /ps otherwise. Thus, given the transmission rate p , w e can define a critical duration of infectivity s c ≡ p − 1 suc h that for s < s c the outbreak dies out, while for s > s c it ac hiev es a non-zero steady-state prev alence. Near s c , small differences in sentencing (i.e. duration of infectivit y) can cause large differences in incarceration (i.e. disease) prev alence. W e take an agen t-based simulation approach to mo deling the incarceration epi- demic b ecause neither the assumption of uniform mixing nor the assumption of homogeneit y are met. Indeed, the netw ork of family and friends plays a crucial role in our h yp othesis. F urthermore, the data show that transmission rates dep end on the nature of the relationship b et ween the infectious and susceptible p eople, and an y particular susceptible may simultaneously ha ve sev eral types of relationships with AN A GENT-BASED EPIDEMIOLOGICAL MODEL OF INCAR CERA TION 13 differen t infectious p eople (e.g. mother and sister and daughter). It is easier to cap- ture this heterogeneity in transmission rates in an agent-based sim ulation than in a set of ODEs. Moreo v er, using the output of our sim ulation, w e can gener ate a p opulation-wide mean transmission rate p to calibrate an ODE mo del. The result is p ≈ 0 . 0612 transmissions p er infected p erson per mon th, or s c ≈ 16 . 3 mon ths. Thus the mean sen tence lengths (17 and 14) are on opp osite sides of the critical p oin t. Under this mo del, the incarceration epidemic in the White p opulation w ould ev entually die out, as no sp on taneous infections are allo w ed. Ho w ever, the Blac k p opulation’s incarceration rate would reach a steady state of ab out 3.9%. As this mo del does not accoun t for sp ontaneous infections, this result is consisten t with those of the agen t- based model. This approac h, ho w ev er, do es not allow us to assess the v alidit y of the mo del or commen t on its ability to reproduce structural prop erties of the epidemic using other withheld sources of information, such as the recidivism data w e hav e sho wn. 7. Discussion The mo del presen ted here demonstrates that the dramatic disparities in incarcer- ation rates of Black and White Americans can b e explained b y the “transmission” of incarceration from an incarcerated p erson to his or her close asso ciates combined with mo dest differences in sentencing. A relatively small difference in sentencing of, on a v erage, three mon ths created incarceration discrepancies similar to those observ ed to da y . F urther evidence supp orting the plausibilit y of the mo del was found in its agreemen t with observed patterns of recidivism, esp ecially in California. How ev er, the mo del reveals that, contrary to the arguments of some adv o cates, sentencing differences alone do not account for the disparities. T o generate the v ast incarcera- tion disparities observ ed to day in the U.S., the mo del must include b oth sentencing disparities and a mechanism for transmitting incarceration similar to that in the SIS mo del of disease propagation. Our mo del is silen t on the question, “Wh y is there a disparity in sen tencing?” Ho w ever, it demonstrates that disparities in incarceration rates b etw een White and Blac k Americans ma y ha ve as muc h to do with the social construction of crime as they do the criminal b ehavior of individuals. a cknowledgments The authors thank the Netw ork Dynamics and Simulation Science Lab oratory team, the SAMSI ABM working group, and Jose T orres for their v aluable input. This work has b een partially supp orted by DTRA Gran t HDTRA1-11-1-0016 and the National Institute of General Medical Sciences of the National Institutes of Health 14 KRISTIAN LUM 1 , SAMAR TH SW ARUP 1 , STEPHEN EUBANK 1 , JAMES HA WDON 2 (NIH) under the Models of Infectious Disease Agent Study (MID AS) program, aw ard n um b er 2U01GM070694-09. The conten t is solely the resp onsibility of the authors and do es not necessarily represent the official views of the NIH or DTRA. References [1] Rob ert Agnew. An empirical test of general strain theory . Criminolo gy , 30(4):475–500, 1992. [2] Katherine Beck ett, Kris Nyrop, and Lori Pfingst. Race, drugs, and p olicing: Understanding disparities in drug deliv ery arrests. Criminolo gy , 44(1):105–137, 2006. [3] Katherine Beck ett and Theodore Sasson. The p olitics of injustic e: Crime and punishment in A meric a . Sage, 2000. [4] Sytske Besemer, David P F arrington, and Catrien CJH Bijleveld. Official bias in in tergen- erational transmission of criminal b ehaviour. British Journal of Criminolo gy , 53(3):438–455, 2013. [5] F red Brauer and Carlos Castillo-Ch´ av ez. Mathematic al mo dels for c ommunic able dise ases , v ol- ume 84. SIAM, 2013. [6] Pauline K Brennan and Cassia Sp ohn. Race/ethnicity and sentencing outcomes among drug offenders in North Carolina. Journal of Contemp or ary Criminal Justic e , 24(4):371–398, 2008. [7] George S Bridges and Rob ert D Crutchfield. La w, so cial standing and racial disparities in imprisonmen t. So cial F or c es , 66(3):699–724, 1988. [8] E. Ann Carson and Joseph Mulako-W angota. Imprisonmen t rates of total jurisdiction p opula- tion generated using the corrections statistical analysis to ol (CSA T). T echnical rep ort, Bureau of Justice Statistics, 2013. [9] Danielle H Dallaire. Incarcerated mothers and fathers: A comparison of risks for c hildren and families. F amily R elations , 56(5):440–453, 2007. [10] David P F arrington. Predicting adult official and self-rep orted violence. In G-F. Pinard and L. Pagani, editors, Clinic al Assessment of Danger ousness , pages 66–88. Cambridge Universit y Press, Cam bridge, 2001. [11] Ronald Helms and SE Costanza. Mo deling the politics of punishmen t: A con textual analysis of racial disparit y in drug sentencing. Criminal Justic e R eview , 35(4):472–491, 2010. [12] Kathleen Maguire and Ann L P astore. Sour c eb o ok of criminal justic e statistics, 2000 . Hindelang Criminal Justice Researc h Center, 2001. [13] Marc Mauer. R ac e to inc ar c er ate . The New Press, 2006. [14] Ojmarrh Mitc hell. A meta-analysis of race and sen tencing research: Explaining the inconsis- tencies. Journal of Quantitative Criminolo gy , 21(4):439–466, 2005. [15] Nancy Nicosia, John M MacDonald, and Jeremy Arkes. Disparities in criminal court referrals to drug treatmen t and prison for minority men. A meric an Journal of Public He alth , 103(6):e77– e84, 2013. [16] Pamela E. Oliver. Racial disparities in imprisonmen t: Some basic information. F o cus , 21(3):28– 31, 2001. [17] M Marit Reha vi and Sonja Starr. Racial disparit y in federal criminal c harging and its sen tencing consequences. U of Michigan L aw & Ec on, Empiric al L e gal Studies Center Pap er , (12-002), 2012. [18] Edwin H Sutherland and DR Cressey . Criminolo gy (9th e dn) . Lippincott, Philadelphia, P A, 1974. AN A GENT-BASED EPIDEMIOLOGICAL MODEL OF INCAR CERA TION 15 [19] T erence P Thornberry . The apple do esn’t fall far from the tree (or do es it?): Intergenera- tional patterns of antisocial b ehavior—the American So ciety of Criminology 2008 Sutherland Address. Criminolo gy , 47(2):297–325, 2009. [20] Michael T onry . The so cial, psychological, and p olitical causes of racial disparities in the Amer- ican criminal justice system. Crime and Justic e , 39(1):273–312, 2010. [21] Sara W akefield and Christopher Uggen. Incarceration and stratification. Annual R eview of So ciolo gy , 36:387–406, 2010. [22] Sara W akefield and Christopher Wildeman. Mass imprisonment and racial disparities in child- ho o d b ehavioral problems. Criminolo gy & Public Policy , 10(3):793–817, 2011. [23] Xia W ang and Daniel P Mears. A multilev el test of minority threat effects on sentencing. Journal of Quantitative Criminolo gy , 26(2):191–215, 2010. [24] Donald James W est and David P F arrington. Who b e c omes delinquent? Se c ond r ep ort of the Cambridge Study in Delinquent Development. Heinemann Educational, 1973. [25] Bruce W estern. Punishment and ine quality in A meric a . Russell Sage F oundation, 2006. [26] Christopher Wildeman. Paren tal imprisonmen t, the prison b o om, and the concentration of c hildho o d disadv an tage. Demo gr aphy , 46(2):265–280, 2009. [27] Christopher Wildeman. Paternal incarceration and c hildren’s physically aggressive behaviors: evidence from the fragile families and c hild w ellbeing study . So cial F or c es , 89(1):285–309, 2010. [28] John W o oldredge. Neighborho o d effects on felony sentencing. Journal of R ese ar ch in Crime and Delinquency , 44(2):238–263, 2007. [29] John W o oldredge, Timothy Griffin, Amy Thistlethw aite, and F ritz Rauschen b erg. Victim- based effects on racially disparate sentencing in Ohio. Journal of Empiric al L e gal Studies , 8(1):85–117, 2011. 16 KRISTIAN LUM 1 , SAMAR TH SW ARUP 1 , STEPHEN EUBANK 1 , JAMES HA WDON 2 Figure 6. A comparison of the output of our simulation model with recidivism rates in California and sev eral other states.
Original Paper
Loading high-quality paper...
Comments & Academic Discussion
Loading comments...
Leave a Comment