Randomized algorithms for statistical image analysis and site percolation on square lattices
We propose a novel probabilistic method for detection of objects in noisy images. The method uses results from percolation and random graph theories. We present an algorithm that allows to detect objects of unknown shapes in the presence of random no…
Authors: Mikhail A. Langovoy, Olaf Wittich
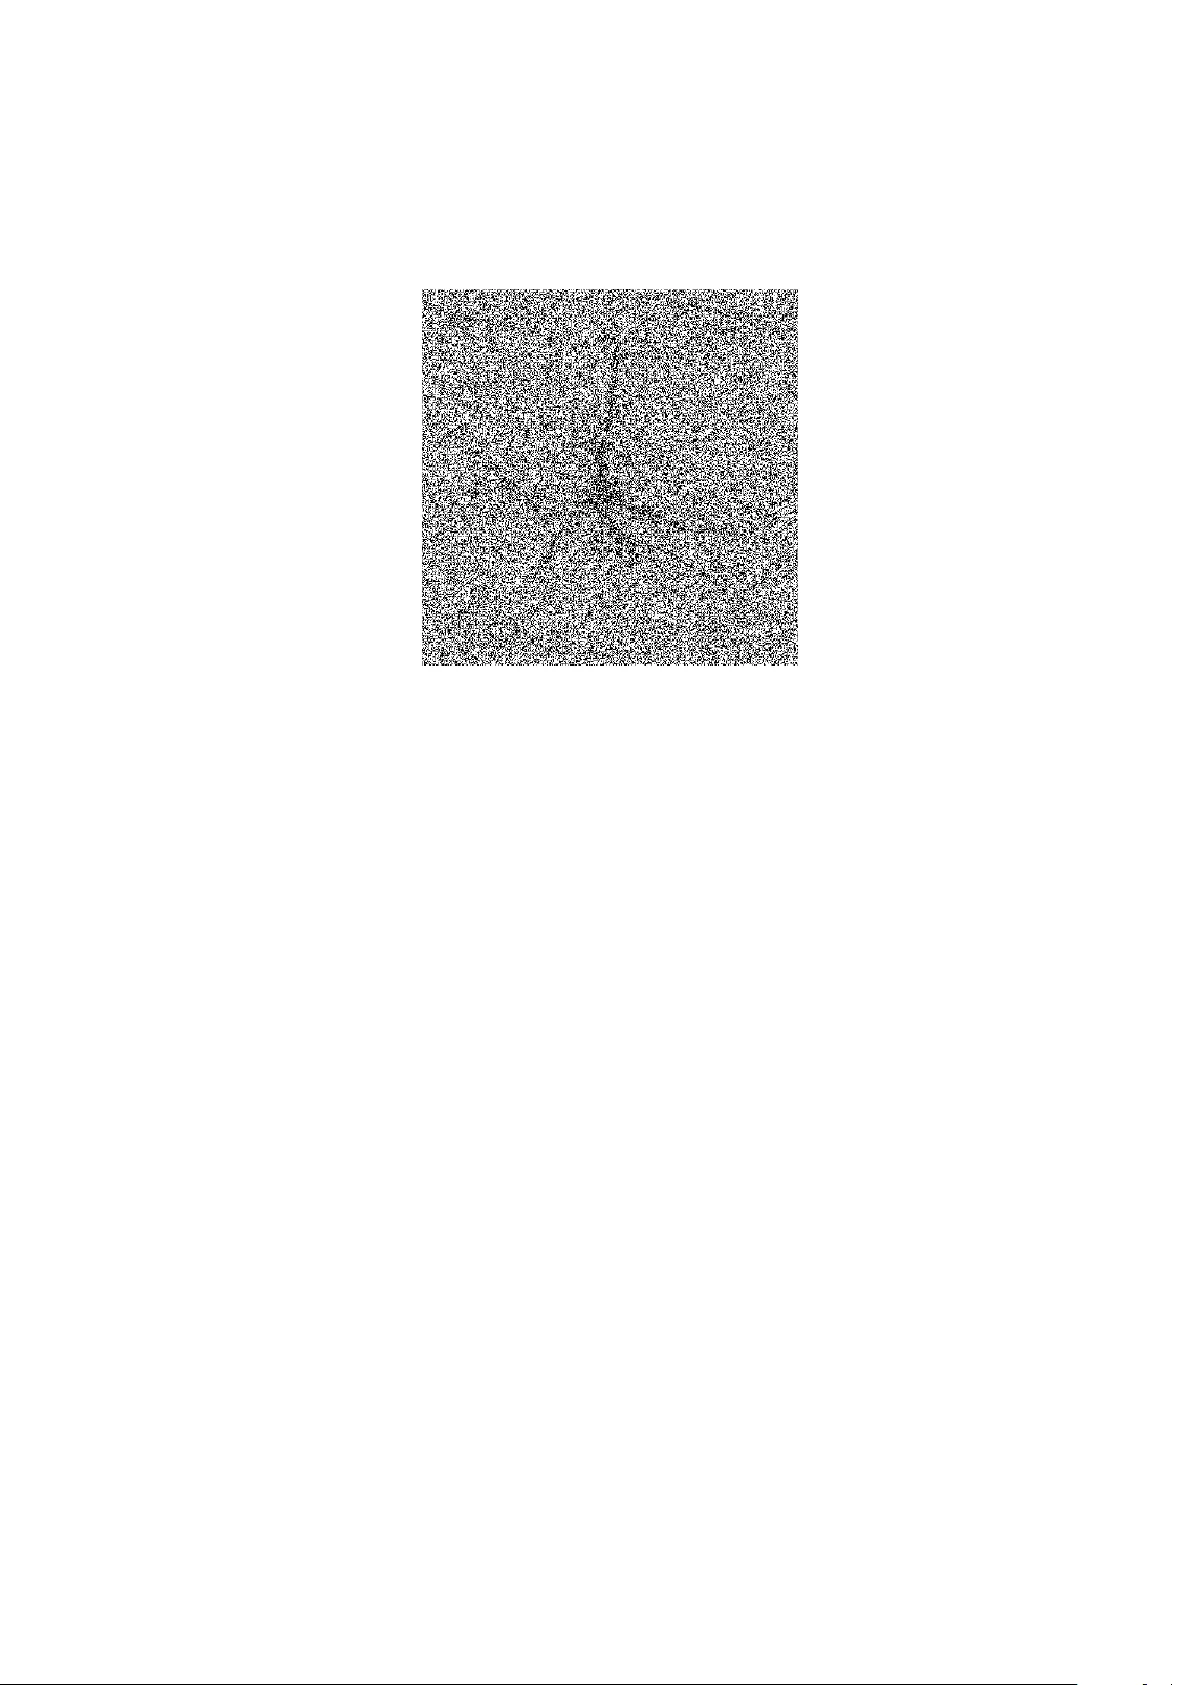
Randomized algorithms for statistical image analysis and site p ercolation on square lattices Mikhail Lango v o y ∗ Mikhail L angovoy, T e chnische Universiteit Eindhoven, EURANDOM, P.O. Box 513, 5600 MB, Eindhoven, The Netherlands e-mail: langovoy@eurandom.tue.nl Phone: (+31) (40) 247 - 8113 F ax: (+31) (40) 247 - 8190 and Olaf Wittic h Olaf Wittich, T e chnische Universiteit Eindhoven and EURANDOM, P.O. Box 513, 5600 MB, Eindhoven, The Netherlands e-mail: o.wittich@tue.nl Phone: (+31) (40) 247 - 2499 Abstract: W e propose a nov el probabilistic method for detection of ob- jects in noisy images. The method uses results from p ercolation and random graph theories. W e present an algorithm that allows to detect ob jects of unknown shapes in the presence of random noise. The algorithm has linear complexity and exp onen tial accuracy and is appropriate for real-time sys- tems. W e pro ve results on consistency and algorithmic complexity of our procedure. Keyw ords and phrases: Image analysis, signal detection, percolation, image reconstruction, noisy image. ∗ Corresponding author. 1 imsart-generic ver. 2007/04/13 file: Image_Analysis_and_Percolation_Square.tex date: May 31, 2018 M. L angovoy and O. Wittich/Dete ction in noisy images and site p er colation 2 1. In tro duction In this paper, we propose a new efficien t tec hnique for quic k detection of ob jects in noisy images. Our approach uses mathematical percolation theory . Detection of ob jects in noisy images is the most basic problem of image analy- sis. Indeed, when one lo oks at a noisy image, the first question to ask is whether there is any ob ject at all. This is also a primary question of interest in suc h div erse fields as, for example, cancer detection (Ricci-Vitiani et al. (2007)), au- tomated urban analysis (Negri et al. (2006)), detection of cracks in buried pip es (Sinha and Fieguth (2006)), and other p ossible applications in astronomy , elec- tron microscopy and neurology . Moreov er, if there is just a random noise in the picture, it do esn’t make sense to run computationally intensiv e pro cedures for image reconstruction for this particular picture. Surprisingly , the v ast ma jority of image analysis metho ds, b oth in statistics and in engineering, skip this stage and start immediately with image reconstruction. The crucial difference of our metho d is that w e do not imp ose any shap e or smo othness assumptions on the b oundary of the ob ject. This p ermits the detection of nonsmooth, irregular or disconnected ob jects in noisy images, under v ery mild assumptions on the ob ject’s interior. This is esp ecially suitable, for example, if one has to detect a highly irregular non-conv ex ob ject in a noisy image. Although our detection procedure w orks for regular images as well, it is precisely the class of irregular images with unknown shap e where our metho d can be v ery adv antageous. Man y mo dern metho ds of ob ject detection, esp ecially the ones that are used b y practitioners in medical image analysis require to perform at least a prelim- inary reconstruction of the image in order for an ob ject to b e detected. This usually makes such metho ds difficult for a rigorous analysis of p erformance and for error control. Our approac h is free from this drawbac k. Even though some pap ers w ork with a similar setup (see Arias-Castro et al. (2005)), b oth our ap- proac h and our results differ substantially from this and other studies of the sub ject. W e also do not use any w av elet-based techniques in the present pap er. W e view the ob ject detection problem as a nonparametric hypothesis testing imsart-generic ver. 2007/04/13 file: Image_Analysis_and_Percolation_Square.tex date: May 31, 2018 M. L angovoy and O. Wittich/Dete ction in noisy images and site p er colation 3 problem within the class of discrete statistical inv erse problems. In this pap er, w e prop ose an algorithmic solution for this nonparametric hy- p othesis testing problem. W e prov e that our algorithm has linear complexity in terms of the num ber of pixels on the screen, and this pro cedure is not only asymptotically consistent, but on top of that has accuracy that grows exp onen- tially with the ”num ber of pixels” in the ob ject of detection. The algorithm has a built-in data-driv en stopping rule, so there is no need in h uman assistance to stop the algorithm at an appropriate step. In this pap er, we assume that the original image is black-and-white and that the noisy image is grayscale. While our fo cusing on grayscale images could hav e b een a serious limitation in case of image reconstruction, it essentially do es not affect the scope of applications in the case of ob ject detection. Indeed, in the v ast ma jorit y of problems, an ob ject that has to be detected either has (on the picture under analysis) a color that differs from the background colours (for example, in roads detection), or has the same colour but of a v ery different in tensity , or at least an ob ject has a relatively thick b oundary that differs in colour from the background. Moreov er, in practical applications one often has some prior information ab out colours of b oth the ob ject of interest and of the bac kground. When this is the case, the method of the presen t paper is applicable after simple rescaling of colour v alues. The paper is organized as follo ws. Our statistical mo del is describ ed in details in Section 2. Suitable thresholding for noisy images is crucial in our method and is dev elop ed in Section 3. A new algorithm for ob ject detection is presen ted in Section 4. Theorem 1 is the main result ab out consistency and computational complexit y of our testing pro cedure. An example illustrating p ossible applica- tions of our metho d is giv en in Section 5. Appendix is devoted to the proof of the main theorem. 2. Statistical mo del Supp ose we hav e a tw o-dimensional image. F or numerical or graphical pro cessing of images on computers, the image alw a ys has to be discretized. This is ac hiev ed imsart-generic ver. 2007/04/13 file: Image_Analysis_and_Percolation_Square.tex date: May 31, 2018 M. L angovoy and O. Wittich/Dete ction in noisy images and site p er colation 4 via certain pixelization pro cedure. In our setup, we will b e working with images that are already discrete. In the present pap er we are in terested in detection of ob jects that hav e a known colour. This colour has to b e differen t from the colour of the bac kground. Mathematically , this is equiv alen t to assuming that the true (non-noisy) images are blac k-and-white, where the ob ject of interest is blac k and the bac kground is white. In other w ords, we are free to assume that all the pixels that b elong to the meaningful ob ject within the digitalized image ha ve the v alue 1 attached to them. W e can call this v alue a black c olour . Additionally , assume that the v alue 0 is attac hed to those and only those pixels that do not b elong to the ob ject in the non-noisy image. If the n um b er 0 is attac hed to the pixel, we call this pixel white . In this pap er w e alwa ys assume that w e observe a noisy image. The observed v alues on pixels could b e different from 0 and 1, so we will typically hav e a greyscale image in the b eginning of our analysis. It is also assumed that on each pixel we hav e random noise that has the known distribution function F ; the noise at each pixel is completely indep endent from noises on other pixels. Let us form ulate the mo del more formally . W e ha ve an N × N array of observ ations, i.e. w e observe N 2 real num bers { Y ij } N i,j =1 . Denote the true v alue on the pixel ( i, j ), 1 ≤ i, j ≤ N , b y I m ij , and the corresponding noise by σ ε ij . Therefore, b y the ab o ve assumptions, Y ij = I m ij + σ ε ij , (1) where 1 ≤ i, j ≤ N , σ > 0, and I m ij = 1 , if ( i, j ) belongs to the ob ject; 0 , if ( i, j ) does not belong to the ob ject. (2) T o stress the dependence on the noise lev el σ , we write our assumption on the imsart-generic ver. 2007/04/13 file: Image_Analysis_and_Percolation_Square.tex date: May 31, 2018 M. L angovoy and O. Wittich/Dete ction in noisy images and site p er colation 5 noise in the follo wing w a y: ε ij ∼ F, E ε ij = 0 , V ar ε ij = 1 . (3) The noise here doesn’t need to b e smo oth, symmetric or even con tin uous. More- o ver, all the results below are easily transferred to the ev en more general case when the noise has arbitrary but known distribution function F g en ; it is not necessary that the noise has mean 0 and finite v ariance. The only adjustment to be made is to replace in all the statements quantities of the form F · /σ b y the quantities F g en ( · ). The Algorithm 1 b elow and the main Theorem 1 are v alid without any c hanges for a general noise distribution F g en satisfying (8) and (9). No w we can pro ceed to preliminary quantitativ e estimates. If a pixel ( i, j ) is white in the original image, let us denote the corresponding probabilit y distribu- tion of Y ij b y P 0 . F or a black pixel ( i, j ) w e denote the corresp onding distribution of Y ij b y P 1 . W e are free to omit dep endency of P 0 and P 1 on i and j in our notation, since all the noises are indep enden t and identically distributed. Lemma 1. Supp ose pixel ( i, j ) has white c olour in the original image. Then for al l y ∈ R : P 0 ( Y ij ≥ y ) = 1 − F y σ , (4) wher e F is the distribution function of the standar dize d noise. Pr o of. (Lemma 1): By (3), P 0 ( Y ij ≥ y ) = 1 − P ( σ ε ij < y ) = 1 − F y σ . Lemma 2. Supp ose pixel ( i, j ) has black c olour in the original image. Then for imsart-generic ver. 2007/04/13 file: Image_Analysis_and_Percolation_Square.tex date: May 31, 2018 M. L angovoy and O. Wittich/Dete ction in noisy images and site p er colation 6 al l y ∈ R : P 1 ( Y ij ≤ y ) = F y − 1 σ . (5) Pr o of. (Lemma 2): By (3) again, w e ha v e P 1 ( Y ij ≤ y ) = P (1 + σ ε ij ≤ y ) = P ( σ ε ij ≤ y − 1) = F y − 1 σ . 3. Thresholding and graphs of images No w we are ready to describ e one of the main ingredien ts of our metho d: the thr esholding . The idea of the thresholding is as follows: in the noisy grayscale image { Y ij } N i,j =1 , we pick some pixels that lo ok as if their real colour was black. Then we colour all those pixels black, irresp ectively of the exact v alue of grey that was observed on them. W e take into account the intensit y of grey observed at those pixels only once, in the b eginning of our pro cedures. The idea is to think that some pixel ”seems to hav e a black colour” when it is not very likely to obtain the observ ed grey v alue when adding a ”reasonable” noise to a white pixel. W e colour white all the pixels that weren’t coloured black at the previous step. A t the end of this pro cedure, w e w ould hav e a transformed vector of 0’s and 1’s, call it { Y i,j } N i,j =1 . W e will be able to analyse this transformed picture b y using certain results from the mathematical theory of p ercolation. This is the main goal of the presen t pap er. But first we ha ve to give more details ab out the thresholding pro cedure. Let us fix, for each N , a real num b er α 0 ( N ) > 0, α 0 ( N ) ≤ 1, such that there exists θ ( N ) ∈ R satisfying the follo wing condition: P 0 ( Y ij ≥ θ ( N ) ) ≤ α 0 ( N ) . (6) imsart-generic ver. 2007/04/13 file: Image_Analysis_and_Percolation_Square.tex date: May 31, 2018 M. L angovoy and O. Wittich/Dete ction in noisy images and site p er colation 7 Lemma 3. Assume that (6) is satisfie d for some θ ( N ) ∈ R . Then for the smal lest p ossible θ ( N ) satisfying (6) it holds that F θ ( N ) σ = 1 − α 0 ( N ) . (7) Pr o of. (Lemma 3): Obvious b y Lemma 1. In this pap er w e will alw ays pick α 0 ( N ) ≡ α 0 for all N ∈ N , for some constan t α 0 > 0. But we will need to hav e v arying α 0 ( · ) for our future research. W e are prepared to describ e our thresholding principle formally . Let p site c b e the critic al pr ob ability for site p er c olation on Z 2 (see Grimmett (1999) for definitions). As a first step, we transform the observed noisy image { Y i,j } N i,j =1 in the follo wing w a y: for all 1 ≤ i, j ≤ N , 1. If Y ij ≥ θ ( N ), set Y ij := 1 (i.e., in the transformed picture the corre- sp onding pixel is coloured black). 2. If Y ij < θ ( N ), set Y ij := 0 (i.e., in the transformed picture the corre- sp onding pixel is coloured white). Definition 1. The ab ov e transformation is called thr esholding at the level θ ( N ). The resulting v ector { Y i,j } N i,j =1 of N 2 v alues (0’s and 1’s) is called a thr esholde d pictur e . Supp ose for a moment that we are giv en the original black and white image without noise. One can think of pixels from the original picture as of v ertices of a planar graph. F urthermore, let us colour these N 2 v ertices with the same colours as the corresponding pixels of the original image. W e obtain a graph G with N 2 blac k or white v ertices and (so far) no edges. W e add edges to G in the follo wing wa y . If an y tw o black vertices are neigh- b ours (i.e. the corresp onding pixels hav e a common side), w e connect these t w o v ertices with a black edge. If an y t wo white vertices are neigh bours, we connect them with a white edge. W e will not add an y edges b etw een non-neigh b ouring p oin ts, and we will not connect vertices of differen t colours to eac h other. imsart-generic ver. 2007/04/13 file: Image_Analysis_and_Percolation_Square.tex date: May 31, 2018 M. L angovoy and O. Wittich/Dete ction in noisy images and site p er colation 8 Finally , w e see that it is possible to view our blac k and white pixelized picture as a collection of black and white ”clusters” on the very sp ecific planar graph (a square N × N subset of the Z 2 lattice). Definition 2. W e call graph G the gr aph of the (pur e) pictur e . This is a very special planar graph, so there are man y efficien t algorithms to work with blac k and white comp onents of the graph. Poten tially , they could b e used to efficiently pro cess the picture. Ho w ev er, the ab ov e represen tation of the image as a graph is lost when one considers noisy images: b ecause of the presence of random noise, we get many gra y pixels. So, the ab ov e construction do esn’t mak e sense anymore. W e o v ercome this obstacle with the help of the ab o ve thresholding procedure. W e make θ ( N ) − thresholding of the noisy image { Y i,j } N i,j =1 as in Definition 1, but with a very sp ecial v alue of θ ( N ). Our goal is to choose θ ( N ) (and corresp onding α 0 ( N ), see (6)) suc h that: 1 − F θ ( N ) σ < p site c , (8) p site c < 1 − F θ ( N ) − 1 σ , (9) where p site c is the critical probabilit y for site p ercolation on Z 2 (see Grimmett (1999), Kesten (1982)). In case if b oth (8) and (9) are satisfied, what do we get? After applying the θ ( N ) − thresholding on the noisy picture { Y i,j } N i,j =1 , we obtained a (random) blac k-and-white image { Y i,j } N i,j =1 . Let G N b e the graph of this image, as in Definition 2. Since G N is random, we actually observe the so-called site p er c olation on blac k vertices within the subset of Z 2 . F rom this point, w e can use results from p ercolation theory to predict formation of black and white clusters on G N , as w ell as to estimate the n um b er of clusters and their sizes and shap es. Relations (8) and (9) are crucial here. T o explain this more formally , let us split the set of vertices V N of the graph G N in to to groups: V N = V im N ∪ V out N , where V im N ∩ V out N = ∅ , and V im N consists of those and only those vertices that corresp ond to pixels b elonging to the original imsart-generic ver. 2007/04/13 file: Image_Analysis_and_Percolation_Square.tex date: May 31, 2018 M. L angovoy and O. Wittich/Dete ction in noisy images and site p er colation 9 ob ject, while V out N is left for the pixels from the background. Denote G im N the subgraph of G N with vertex set V im N , and denote G out N the subgraph of G N with v ertex set V out N . If (8) and (9) are satisfied, w e will observ e a so-called sup er critic al p er c olation of black clusters on G im N , and a sub critic al p ercolation of blac k clusters on G out N . Without going into muc h details on p ercolation theory (the necessary introduc- tion can b e found in Grimmett (1999) or Kesten (1982)), we men tion that there will b e a high probability of forming relatively large blac k clusters on G im N , but there will be only little and scarce black clusters on G out N . The difference b etw een the t w o regions will b e striking, and this is the main component in our image analysis method. In this pap er, mathematical p ercolation theory will b e used to deriv e quanti- tativ e results on behaviour of clusters for b oth cases. W e will apply those results to build efficien t randomized algorithms that will be able to detect and estimate the ob ject { I m i,j } N i,j =1 using the difference in p ercolation phases on G im N and G out N . If the noise level σ is not to o large, then (8) and (9) are satisfied for some θ ( N ) ∈ (0 , 1). Indeed, one simply has to pick θ ( N ) close enough to 1. On the other hand, if σ is relativ ely large, it ma y happ en that (8) and (9) cannot b oth b e satisfied at the same time. Definition 3. In the framework defined by relations (1)-(2) and assumptions h A 1 i - h A 3 i , we sa y that the noise level σ is smal l enough (or 1-smal l ), if the system of inequalities (8) and (9) is satisfied for some θ ( N ) ∈ R , for all N ∈ N . A very imp ortant practical issue is that of choosing an optimal threshold v alue θ . F rom a purely theoretical p oint of view, this is not a big issue: once (8) and (9) holds for some θ , it is guaran teed that after θ − thresholding we will observ e qualitatively different b ehaviour of blac k and white clusters in or outside of the true ob ject. W e will make use of this in what follo ws. Ho wev er, for practical computations, especially for mo derate v alues of N , the v alue of θ is imp ortant. Since the goal is to make p ercolations on V im N and V out N lo ok as differen t as p ossible, one has to make the corresp onding p ercolation imsart-generic ver. 2007/04/13 file: Image_Analysis_and_Percolation_Square.tex date: May 31, 2018 M. L angovoy and O. Wittich/Dete ction in noisy images and site p er colation 10 probabilities for black colour, namely , 1 − F θ ( N ) σ and 1 − F θ ( N ) − 1 σ , as differen t as p ossible b oth from each other and from the critical probability p site c . There can be several reasonable w a ys for choosing a suitable threshold. F or example, w e can propose to choose θ ( N ) as a maximizer of the follo wing function: 1 − F θ ( N ) σ − p site c 2 + 1 − F θ ( N ) − 1 σ − p site c 2 , (10) pro vided that (8) and (9) holds. Alternativ ely , we can prop ose to use a maximizer of sig n 1 − F θ ( N ) − 1 σ − p site c + sig n p site c − 1 + F θ ( N ) σ . (11) 4. Ob ject detection W e either observe a blank white screen with accidental noise or there is an actual ob ject in the blurred picture. In this section, w e prop ose an algorithm to make a decision on whic h of the tw o possibilities is true. This algorithm is a statistical testing pro cedure. It is designed to solve the question of testing H 0 : I ij = 0 for all 1 ≤ i, j ≤ N versus H 1 : I ij = 1 for some i, j . Let us c ho ose α ( N ) ∈ (0 , 1) - the pr ob ability of false dete ction of an ob ject. More formally , α ( N ) is the maximal probabilit y that the algorithm finishes its w ork with the decision that there w as an ob ject in the picture, while in fact there w as just noise. In statistical terminology , α ( N ) is the probabilit y of an error of the first kind. W e allow α to dep end on N ; α ( N ) is connected with complexit y (and ex- p ected w orking time) of our randomized algorithm. Since in our metho d it is crucial to observ e some kind of p ercolation in the picture (at least within the image), the image has to b e ”not to o small” in order imsart-generic ver. 2007/04/13 file: Image_Analysis_and_Percolation_Square.tex date: May 31, 2018 M. L angovoy and O. Wittich/Dete ction in noisy images and site p er colation 11 to b e detectable by the algorithm: one can’t observe anything p ercolation-alike on just a few pixels. W e will use p ercolation theory to determine how ”large” precisely the ob ject has to b e in order to b e detectable. Some size assumption has to b e present in an y detection problem: for example, it is hop eless to detect a single p oint ob ject on a very large screen even in the case of a mo derate noise. F or an easy start, we mak e the following (w ay to o strong) largeness assump- tions about the ob ject of in terest: h D1 i Assume that the ob ject con tains a blac k square with the side of size at least ϕ im ( N ) pixels, where lim N →∞ log 1 α ( N ) ϕ im ( N ) = 0 . (12) h D2 i lim N →∞ ϕ im ( N ) log N = ∞ . (13) F urthermore, we assume the obvious consistency assumption ϕ im ( N ) ≤ N . (14) Assumptions h D 1 i and h D 2 i are sufficient conditions for our algorithm to w ork. They are wa y to o strong for our purp oses. It is possible to relax (13) and to replace a square in h D 1 i by a triangle-shaped figure. Although conditions (12) and (13)are of asymptotic character, most of the estimates used in our metho d are v alid for finite N as w ell. No w we are ready to formulate our Dete ction Algorithm . Fix the false detec- tion rate α ( N ) before running the algorithm. Algorithm 1 (Detection). • Step 0. Find an optimal θ ( N ). imsart-generic ver. 2007/04/13 file: Image_Analysis_and_Percolation_Square.tex date: May 31, 2018 M. L angovoy and O. Wittich/Dete ction in noisy images and site p er colation 12 • Step 1. P erform θ ( N ) − thresholding of the noisy picture { Y i,j } N i,j =1 . • Step 2. Un til {{ Blac k cluster of size ϕ im ( N ) is found } or { all blac k clusters are found }} , Run depth-first search (T arjan (1972)) on the graph G N of the θ ( N ) − thresholded picture { Y i,j } N i,j =1 • Step 3. If a black cluster of size ϕ im ( N ) was found, rep ort that an ob ject w as detected • Step 4. If no black cluster w as larger than ϕ im ( N ), rep ort that there is no ob ject. A t Step 2 our algorithm finds and stores not only sizes of blac k clusters, but also co ordinates of pixels constituting eac h cluster. W e remind that θ ( N ) is defined as in (6), G N and { Y i,j } N i,j =1 w ere defined in Section 3, and ϕ im ( N ) is any function satisfying (12). The depth-first search algorithm is a standard pro cedure used for searc hing connected comp onents on graphs. This pro cedure is a deterministic algorithm. The detailed description and rigorous complexity analysis can b e found in T arjan (1972), or in the classic b o ok Aho et al. (1975), Chapter 5. Let us prov e that Algorithm 1 works, and determine its complexity . Theorem 1. L et σ b e 1-smal l. Supp ose assumptions h D 1 i and h D 2 i ar e satis- fie d. Then 1. Algorithm 1 finishes its work in O ( N 2 ) steps, i.e. is line ar. 2. If ther e was an obje ct in the pictur e, Algorithm 1 dete cts it with pr ob ability at le ast (1 − exp( − C 1 ( σ ) ϕ im ( N ))) . 3. The pr ob ability of false dete ction do esn ’t exc e e d min { α ( N ) , exp( − C 2 ( σ ) ϕ im ( N )) } for al l N > N ( σ ) . imsart-generic ver. 2007/04/13 file: Image_Analysis_and_Percolation_Square.tex date: May 31, 2018 M. L angovoy and O. Wittich/Dete ction in noisy images and site p er colation 13 The c onstants C 1 > 0 , C 2 > 0 and N ( σ ) ∈ N dep end only on σ . R emark 1 . Dep endence on σ implicitly means dep endence on θ ( N ) as well, but this do esn’t sp oil Theorem 1. Remember that we can consider θ ( N ) to b e a function of σ in view of our comments b efore (10) and (11). Theorem 1 means that Algorithm 1 is of quick est p ossible order: it is line ar in the input size. It is difficult to think of an algorithm w orking quic k er in this problem. Indeed, if the image is v ery small and lo cated in an unknown place on the screen, or if there is no image at all, then an y algorithm solving the detection problem will ha ve to at least upload information ab out O ( N 2 ) pixels, i.e. under general assumptions of Theorem 1, any detection algorithm will ha v e at least linear complexit y . Another imp ortant p oint is that Algorithm 1 is not only consistent, but that it has exp onential rate of accuracy . It is also interesting to remark here that, although it is assumed that the ob ject of interest contains a ϕ im ( N ) × ϕ im ( N ) blac k square, one cannot use a v ery natural idea of simply considering sums of v alues on all squares of size ϕ im ( N ) × ϕ im ( N ) in order to detect an ob ject. Neither some sort of thresholding can b e av oided, in general. Indeed, although this simple idea w orks very well for normal noise, it cannot be used in case of an arbitrary , possibly irregular or hea vy-tailed, noise. F or example, for heavy-tailed noise, detection based on non-thresholded sums of v alues o v er subsquares will lead to a high probability of false detection. Whereas the method of the present pap er can still work in man y cases. 5. Example In this section, w e outline an example illustrating p ossible applications of our metho d. W e start with a real greyscale picture of a neuron (see Fig. 1). This neuron is an irregular ob ject with unknown shap e, and our metho d can b e very adv antageous in situations lik e this. Basing on this real picture, we p erform the following simulation study . W e imsart-generic ver. 2007/04/13 file: Image_Analysis_and_Percolation_Square.tex date: May 31, 2018 M. L angovoy and O. Wittich/Dete ction in noisy images and site p er colation 14 Fig 1 . A part of a r e al neur on. add Gaussian noise of level σ = 1 . 8 independently to each pixel in the image, and then we run Algorithm 1 on this noisy picture. A typical v ersion of a noisy picture with this relatively strong noise can b e seen on Fig. 2. W e run the algorithm on 1000 sim ulated pictures. As a result, the neuron was detected in 98.7% of all cases. A t the same time, the probability of false detection w as shown to be b elo w 5%. Now we describ e our experiment in more details. The starting picture (see Fig. 1) was 450 × 450 pixels. White pixels hav e v alue 0 and black pixels hav e v alue 1. Some pixels w ere grey already in the original picture, but this doesn’t sp oil the detection pro cedure. As follows from Theorem 1, our testing pro cedure is consistent at least when (8) and (9) are satisfied, i.e. when 1 − Φ θ σ < p site c = 0 . 58 ... , (15) p site c < 1 − Φ θ − 1 σ , (16) imsart-generic ver. 2007/04/13 file: Image_Analysis_and_Percolation_Square.tex date: May 31, 2018 M. L angovoy and O. Wittich/Dete ction in noisy images and site p er colation 15 Fig 2 . A noisy picture. where θ = θ (450) is the chosen threshold and Φ is the distribution function of the standard normal distribution. In our case, we hav e chosen a default threshold θ = 0 . 5. As can b e seen from considerations at the end of Section 3, this threshold is reasonable but not the most effectiv e one. The thresholded v ersion of Fig. 2 is sho wn on Fig. 3. With this choice of θ , the system of (15) and (16) amounts to 1 − Φ 1 2 σ < p site c < 1 − Φ − 1 2 σ . T aking into account the symmetry of Φ, this is satisfied if and only if Φ 1 2 σ > p site c = 0 . 58 ... . As can b e found from the last equation, our testing pro cedure is asymptotically consisten t at least in the noise level range 0 ≤ σ ≤ 2. W e ha v e chosen σ = 1 . 8 in our simulation study . In practice, Algorithm 1 can b e consistently used for imsart-generic ver. 2007/04/13 file: Image_Analysis_and_Percolation_Square.tex date: May 31, 2018 M. L angovoy and O. Wittich/Dete ction in noisy images and site p er colation 16 Fig 3 . A thresholde d pictur e. stronger noise levels, b ecause in fact there is a numerically significan t difference not only betw een subcritical and sup ercritical phases of p ercolation, but also within eac h of the phases. Supp ose the n ull hypothesis is true, i.e. there is no signal in the original pic- ture. By running Algorithm 1 on empt y pictures of size 450 × 450 with sim ulated noise of level σ = 1 . 8 and θ = 0 . 5, one can find that with probabilit y more than 95% there will b e no black cluster of size 191 or more on the thresholded pic- ture. Due to an exp onential decay of maximal cluster sizes, it is a safe b et to consider as significan t only those clusters that ha v e more than, sa y , 250 pixels. A different and muc h more efficient wa y of calculating ϕ ( N ) for moderate sizes of N is proposed in Lango v o y and Wittich (2009). F or mo derate sample sizes, the algorithm is applicable in many situations that are not cov ered b y Theorem 1. The ob ject do esn’t hav e to con tain a square of size 190 × 190 in order to b e detectable. In particular, for noise level σ = 1 . 8, ev en ob jects con taining a 40 × 40 square are consistently detected. The neuron imsart-generic ver. 2007/04/13 file: Image_Analysis_and_Percolation_Square.tex date: May 31, 2018 M. L angovoy and O. Wittich/Dete ction in noisy images and site p er colation 17 on Fig. 1 passes this criterion, and Algorithm 1 detected the neuron 987 times out of 1000 runs. Ac kno wledgmen ts. The authors would lik e to thank Laurie Davies, Remco v an der Hofstad, Artem Sap ozhniko v and Shota Gugushvili for helpful discus- sions. References Alfred V. Aho, John E. Hop croft, and Jeffrey D. Ullman. The design and analysis of c omputer algorithms . Addison-W esley Publishing Co., Reading, Mass.-London-Amsterdam, 1975. Second printing, Addison-W esley Series in Computer Science and Information Pro cessing. Ery Arias-Castro, Da vid L. Donoho, and Xiaoming Huo. Near-optimal detection of geometric ob jects by fast m ultiscale metho ds. IEEE T r ans. Inform. The ory , 51(7):2402–2425, 2005. ISSN 0018-9448. B ´ ela Bollob´ as and Oliver Riordan. Per c olation . Cam bridge Univ ersit y Press, New Y ork, 2006. ISBN 978-0-521-87232-4; 0-521-87232-4. C. M. F ortuin, P . W. Kasteleyn, and J. Ginibre. Correlation inequalities on some partially ordered sets. Comm. Math. Phys. , 22:89–103, 1971. ISSN 0010-3616. Geoffrey Grimmett. Per c olation , volume 321 of Grund lehr en der Mathema- tischen Wissenschaften [F undamental Principles of Mathematic al Scienc es] . Springer-V erlag, Berlin, second edition, 1999. ISBN 3-540-64902-6. Harry Kesten. Per c olation the ory for mathematicians , volume 2 of Pr o gr ess in Pr ob ability and Statistics . Birkh¨ auser Boston, Mass., 1982. ISBN 3-7643- 3107-0. V. I. Krylo v, V. V. Bobko v, and P . I. Monastyrn y ˘ ı. Vychislitelnye meto dy. Tom I . Izdat. “Nauk a”, Moscow, 1976. M. A. Lango v o y and O. Wittic h. A randomized algorithm for finding the largest cluster for site p ercolation on finite grids. Submitte d , 2009. M. Negri, P . Gam ba, G. Lisini, and F. T upin. Junction-aw are extraction and imsart-generic ver. 2007/04/13 file: Image_Analysis_and_Percolation_Square.tex date: May 31, 2018 M. L angovoy and O. Wittich/Dete ction in noisy images and site p er colation 18 regularization of urban road netw orks in high-resolution sar images. Ge o- scienc e and R emote Sensing, IEEE T r ansactions on , 44(10):2962–2971, Oct. 2006. ISSN 0196-2892. . Lucia Ricci-Vitiani, Dario G. Lom bardi, Emanuela Pilozzi, Mauro Biffoni, Matilde T odaro, Cesare P esc hle, and Ruggero De Maria. Iden tification and expansion of human colon-cancer-initiating cells. Natur e , 445(7123):111–115, Oct. 2007. ISSN 0028-0836. Sunil K. Sinha and Paul W. Fieguth. Automated detection of cracks in buried concrete pip e images. Automation in Construction , 15(1):58 – 72, 2006. ISSN 0926-5805. . Rob ert T arjan. Depth-first search and linear graph algorithms. SIAM J. Com- put. , 1(2):146–160, 1972. ISSN 0097-5397. App endix. Pro ofs. This section is devoted to pro ofs of the ab ov e results. Some crucial estimates from percolation theory are also presen ted for the reader’s con v enience. Pr o of. (Theorem 1): P art I. First w e pro v e the complexity result. Finding a suitable (approximate, within a predefined error) θ from (10) or (11) tak es a constant num ber of oper- ations. See, for example, Krylov et al. (1976). The θ ( N ) − thresholding giv es us { Y i,j } N i,j =1 and G N in O ( N 2 ) operations. This finishes the analysis of Step 1. As for Step 2, it is known (see, for example, Aho et al. (1975), Chapter 5, or T arjan (1972)) that the standard depth-first searc h finishes its work also in O ( N 2 ) steps. It tak es not more than O ( N 2 ) op erations to sa v e p ositions of all pixels in all clusters to the memory , since one has no more than N 2 p ositions and clusters. This completes analysis of Step 2 and shows that Algorithm 1 is linear in the size of input data. imsart-generic ver. 2007/04/13 file: Image_Analysis_and_Percolation_Square.tex date: May 31, 2018 M. L angovoy and O. Wittich/Dete ction in noisy images and site p er colation 19 P art II. Now w e pro v e the b ound on the probability of false detection. Denote p out ( N ) := 1 − F θ ( N ) σ , (17) a probabilit y of erroneously marking a white pixel outside of the image as blac k. Under assumptions of Theorem 1, p out ( N ) < p site c . W e prov e the follo wing additional theorem: Theorem 2. Supp ose that 0 < p out ( N ) < p site c . Ther e exists a c onstant C 3 = C 3 ( p out ( N )) > 0 such that P p out ( N ) ( F N ( n )) ≤ exp( − n C 3 ( p out ( N ))) , for al l n ≥ ϕ im ( N ) . (18) Her e F N ( n ) is the event that ther e is an erroneously mark ed black cluster of size gr e ater or e qual n , lying in the squar e of size N × N c orr esp onding to the scr e en. (A n err one ously marke d black cluster is a black cluster on G N such that eac h of the pixels in the cluster was wr ongly c olour e d black after the θ − thr esholding.) Before proving this result, w e state the following theorem about sub critical site percolation. Theorem 3. (A izenman-Newman) Consider site p er c olation with pr ob ability p 0 on Z 2 . Ther e exists a c onstant λ site = λ site ( p 0 ) > 0 such that P p 0 ( | C | ≥ n ) ≤ e − n λ site ( p 0 ) , for al l n ≥ 1 . (19) Her e C is the op en cluster c ontaining the origin. Pr o of. (Theorem 3): See Bollob´ as and Riordan (2006). T o conclude Theorem 2 from Theorem 3, we will use the celebrated FKG inequalit y (see F ortuin et al. (1971), or Grimmett (1999), Theorem 2.4, p.34; see also Grimmett’s b o ok for some explanation of the terminology). imsart-generic ver. 2007/04/13 file: Image_Analysis_and_Percolation_Square.tex date: May 31, 2018 M. L angovoy and O. Wittich/Dete ction in noisy images and site p er colation 20 Theorem 4. If A and B ar e b oth incr e asing (or b oth de cr e asing) events on the same me asur able p air (Ω , F ) , then P ( A ∩ B ) ≥ P ( A ) P ( B ) . Pr o of. (Theorem 2): Denote b y C ( i, j ) the largest cluster in the N × N screen con taining the pixel with co ordinates ( i, j ), and b y C (0) the largest blac k cluster on the N × N screen con taining 0. By Theorem 3, for all i , j : 1 ≤ i, j ≤ N : P p out ( N ) ( | C (0) | ≥ n ) ≤ e − n λ site ( p out ) , (20) P p out ( N ) ( | C ( i, j ) | ≥ n ) ≤ e − n λ site ( p out ) . Ob viously , it only helped to inequalities (19) and (20) that w e hav e limited our clusters to only a finite subset instead of the whole lattice Z 2 . On a side note, there is no symmetry anymore b et ween arbitrary p oin ts of the N × N finite square; luc kily , this doesn’t affect the present pro of. Since { | C (0) | ≥ n } and { | C ( i, j ) | ≥ n } are increasing ev en ts (on the mea- surable pair corresp onding to the standard random-graph mo del on G N ), w e ha ve that { | C (0) | < n } and { | C ( i, j ) | < n } are decreasing even ts for all i , j . By FK G inequality for decreasing ev en ts, P p out ( N ) ( | C ( i, j ) | < n for all i, j, 1 ≤ i, j ≤ N ) ≥ Y Y 1 ≤ i,j ≤ N P p out ( N ) ( | C ( i, j ) | < n ) ≥ (by (20)) ≥ 1 − e − n λ site ( p out ) N 2 . W e denote below by C a b the ” a out of b ” binomial coefficie n t. It follows that imsart-generic ver. 2007/04/13 file: Image_Analysis_and_Percolation_Square.tex date: May 31, 2018 M. L angovoy and O. Wittich/Dete ction in noisy images and site p er colation 21 P p out ( N ) ( F N ( n )) = P p out ( N ) ∃ ( i, j ) , 1 ≤ i, j ≤ N : | C ( i, j ) | ≥ n ≤ 1 − 1 − e − n λ site ( p out ) N 2 = 1 − N 2 X k =0 ( − 1) k C k N 2 e − n λ site ( p out ) k = N 2 X k =1 ( − 1) k − 1 C k N 2 e − n λ site ( p out ) k = N 2 e − n λ site ( p out ) + o N 2 e − n λ site ( p out ) , b ecause we assumed in (18) that n ≥ ϕ im ( N ), and log N = o ( ϕ im ( N )). More- o ver, w e see immediately that Theorem 2 follo ws now with some C 3 suc h that 0 < C 3 ( p out ( N )) < λ site ( p out ( N )). The exp onential b ound on the probability of false detection follows from Theorem 2. P art I I I. It remains to pro ve the lo wer b ound on the probabilit y of true detection. First w e prov e the following theorem: Theorem 5. Consider site p er c olation on Z 2 lattic e with p er c olation pr ob ability p > p site c . L et A n b e the event that ther e is an op en p ath in the r e ctangle [0 , n ] × [0 , n ] joining some vertex on its left side to some vertex on its right side. L et M n b e the maximal numb er of vertex-disjoint op en left-right cr ossings of the r e ctangle [0 , n ] × [0 , n ] . Then ther e exist c onstants C 4 = C 4 ( p ) > 0 , C 5 = C 5 ( p ) > 0 , C 6 = C 6 ( p ) > 0 such that P p ( A n ) ≥ 1 − n e − C 4 n , (21) P p ( M n ≤ C 5 n ) ≤ e − C 6 n , (22) and b oth ine qualities holds for all n ≥ 1 . imsart-generic ver. 2007/04/13 file: Image_Analysis_and_Percolation_Square.tex date: May 31, 2018 M. L angovoy and O. Wittich/Dete ction in noisy images and site p er colation 22 Pr o of. (Theorem 5): One prov es this by a sligh t mo dification of the corresp ond- ing result for b ond p ercolation on the square lattice. See pro of of Lemma 11.22 and pp. 294-295 in Grimmett (1999). No w supp ose that we ha v e an ob ject in the picture that satisfies assump- tions of Theorem 1. Consider any ϕ im ( N ) × ϕ im ( N ) square in this image. After θ − thresholding of the picture by Algorithm 1, we observe on the selected square site percolation with probabilit y p im ( N ) := 1 − F θ ( N ) − 1 σ > p site c . Then, by (21) of Theorem 5, there exists C 4 = C 4 ( p im ( N )) such that there will b e at le ast one cluster of size not less than ϕ im ( N ) (for example, one could tak e any of the existing left-righ t crossings as a part of such cluster), provided that N is bigger than certain N ( p im ( N )) = N ( σ ); and all that happ ens with probabilit y at least 1 − n e − C 4 n > 1 − e − C 3 n , for some C 3 : 0 < C 3 < C 4 . Theorem 1 is prov ed. imsart-generic ver. 2007/04/13 file: Image_Analysis_and_Percolation_Square.tex date: May 31, 2018
Original Paper
Loading high-quality paper...
Comments & Academic Discussion
Loading comments...
Leave a Comment