How to improve the prediction based on citation impact percentiles for years shortly after the publication date?
The findings of Bornmann, Leydesdorff, and Wang (in press) revealed that the consideration of journal impact improves the prediction of long-term citation impact. This paper further explores the possibility of improving citation impact measurements o…
Authors: Lutz Bornmann, Loet Leydesdorff, Jian Wang
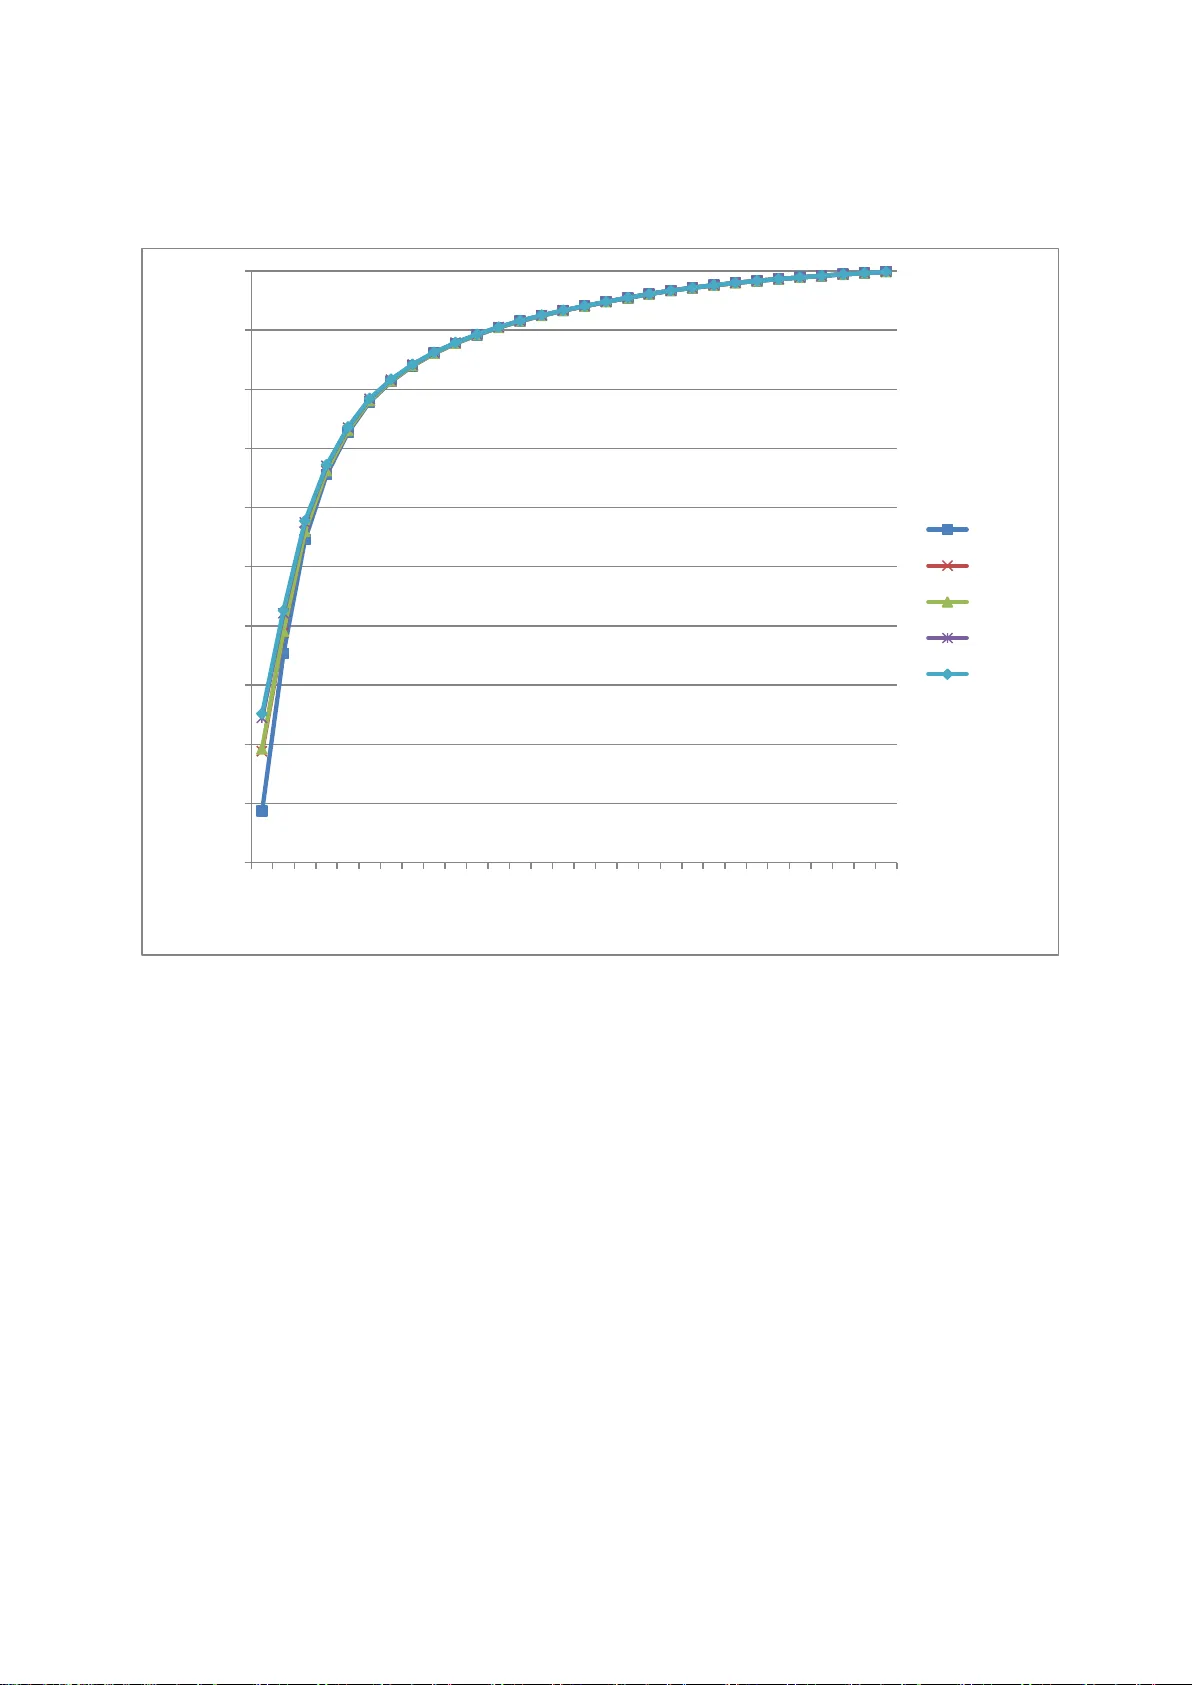
Accepted for publication in the Journal of Informetrics How to im prove the prediction based on citation im pact percentiles for years shortly after the publication date? Lu tz Born mann, # Loet Leydesdorff, * and Jian Wang §+ # Division for Sci ence and I nnovation Studies Administrative Headquarters of the Max Planck Society Hofgartenstr. 8, 80539 Munich, Germany. E-mail: bornmann@gv.mpg.de * Amsterdam School of Communication Research (ASCoR), University of Am ster dam, Kloveniersburgwal 48, 1012 CX Amsterdam, The Netherlands; loet@leydesdorff.net § Institute for Research Inform a tion and Quality Assurance (iFQ) Schützenstraße 6a, 10117 Berlin, Germany + Center for R& D Monitoring (ECOOM) and Depar tm ent of Managerial Economics, Strategy and Innovation, Katholieke Univ ersiteit Leuven, Waaistraat 6, 3000 Leuven, Belgium ; Email: Jian.W ang@kuleuven.be 2 Abstract The findings of Bornmann, Leydesdorff, and Wang (in press) revealed that the consi dera tion of journal impact improves the prediction of long-term citation impact. This paper further explores the possibility of improving citation impact m easur ements on t he base of a short citation window by the consideration o f j ournal impact and other variables, such as the number of authors, the number of cited references, and the number of pages. The dataset contains 475,391 journal papers published in 1980 and indexed in Web of Science (WoS , Thomson Reuters), and all annual citation co unts (fr om 1980 to 2010) for the se papers. As an indicator of citation im pa ct, we used percentiles of citations calculated using the a pproach of Hazen (1914). Our results show that citation impact measurem ent can really be impro ved: If factors generally influencing citatio n impact are considered in the statistical analy sis, the explained variance in the long-term citatio n impac t can be much increased. However, this increase is only visibl e when using the years shortly after publi ca tion but not when using later years. Key words Citation impact norm a lization; Percent ile ; Short citation window 1 Introduction Percentiles used in bibliom etrics provide information about the citation impact of a focal paper compared with other comparable papers in a reference set; for example, all papers in the sa me research field and publication year. A percentile is the value below which a certain proportion of observatio ns ( here: papers) fall: the larger a paper’s percentile, the higher citation impact it has – compared with papers in the same field and publication y ear. Since the percentile appro ach ha s been acknowledged in bibliometrics as a valuable alternative to the normalizatio n of citation counts based on mean citation rates, some different percentile-based approaches have been develo ped (see an ov erview in Bornmann, Leydesdorff, & Mutz, 2013). More recently, two of these approaches (PP top 10% and the Excellen ce Rate, respectiv ely) have bee n prominently used in t he Leiden Ranking ( Waltman et al., 2012) and the SCImago institutions ranking (SCImago Reseach Group, 2012) as evaluation tools. Using a publication set including all papers published in 1980 (nearly 500,000 papers), Bornmann, et al. (in press) investigated how the different percentile-based approaches are able to predict the lo ng -term citation impact (in year 31 , t 31 ) of papers from citation im pacts in previous years (years 1, t 1 , to 30, t 30 ). In comparison to the other approaches, the SCIm a go approach demonstrated unexpected capabilities in accurately predicting the long-term citation impact on the basis of the citatio n impact in the first few years af ter publi cation. The consideration of the journal impact in this approach in solving the problem of tied cit ations seems to have generated this positive effect. For the problem of ranks tying at the top 10% threshold level (Bornmann, de Moya Anegón, & Leydesdorff, 2012), SCImago introduces a secondary sort key in additio n to citation counts: When citation counts are equal, the publication in a journal with the higher SCImago Journal Rank (SJR2) (Guerrero-Bote & de Moya-Anegon, 2012) obtains the higher 4 percentile rank. Adding this journal metric takes into account not only the obser ved citations of the focal paper but also the pre stig e of the journal that a pape r is published in. Given the enduring tension betw een the practical needs for timely assessment of research outputs and the long tim e per iod it takes for rese arch to reveal it s full impact (Bornmann, 2013 ; W an g, 2013), we examine in the present study the added-value of considering the journal impact in predicting t he lon g-ter m citation im pact f rom citation impacts in previous years. For the statistical analy ses, w e use the same data set as Wang (2013) and Bornmann, et al. (in press). However, we consider not only the journal impact but also other factors (e.g., the num ber of authors) for better predicting long-term citation impact. Bibliom e tric studies have already point ed out several other factors – in addition to journal impact – with an (significant) effect on citatio n impac ts (see an overview in Bornmann & Daniel, 2008). Thus, we examined, whether the prediction of long-term citation impact (based on y ear s shortly after the publication date ) can be improved by considering fur ther facto rs. Since the approach of Hazen (1914) to calculate percentiles is widely used in statistical packages, we use it in this study. The results are also generali zable to other approaches (as we will exemplar il y show). 2 Methods 2.1 The percentile approach of Hazen (1914) Two steps are needed in order to calculate percentiles for a reference set based on the percentile-based approach of Hazen (1914): First, al l papers in the set are ranked in ascending order of their numbers of citations. Papers with equal citation counts are set equal by assigning the average rank. This is the default ranking m ethod in the statistical package Stata (StataCorp., 2011). This method ensures that the sum of the ranks is fixed at n *( n +1)/2, where n is the number of papers in the reference set. 5 Second, each paper is assigned a percentile based on its rank (percentile rank). Percentiles can be calculated in di ffer ent ways (Bornmann, Leydesdorff, et al., 2013 ; Cox, 2005 ; H yndm an & Fan, 1996 ). In this study, we used the formula (100 * ( i -0.5)/ n ), derived by Hazen (1914). This formula is used very frequently n owadays for the calculation of percentiles and is wired into the official Stat a command “ quantile ” (StataCorp., 2011) . It ensures that the mean percentile is 50 and symmetrical ly handl es the tails of the distributions. 2.2 Dataset used In this study, we define a reference set for a paper under study as a set of papers wit h the same WoS subject category and document type. The reference sets were used to calculate the percentile-based approach developed by Hazen (1914). Each paper in W oS is classified into one unique document type but possi bl y into multiple subject ca tego ries. Therefore, for papers with multiple subject categories, the average percentile rank is used. Furthermore, the citation percentiles could be too coar se if the size of the reference set is too small. Therefore, only reference sets wi th at le ast one hundred pa pers a re included. 1 For example, if a paper belongs to two different reference sets: A and B , and A ha s more than 100 papers while B has less than 100 papers, then the percentiles based on B are discarded. I f neither A nor B has more than 99 papers, then both results based on A and B are discarded, and this paper is excluded from the further analysis. The dataset contains all journal papers published in 1980 and indexed in Web of Science (WoS, Thomson Reuters), that is, 746,460 papers in total. Two restrictio ns are then imposed on the sample: (1) three docum ent types – articles, reviews, and notes 2 – were kept while other documents types were excluded, and (2) only papers having at le ast one reference set with hundred or more papers were included. As a result , we have 475,391 papers for 1 We d ecided to us e 100 papers as a limi t to produc e reliable dat a. Th ere is a high probabilit y t hat t he use of a limit of 50 or 200 would come to similar results as ou rs. 2 Notes were remov ed from the dat abase as a document type in 1997, but they were cit able items in 1980. 6 analysis, and the annual cit ation counts (from 1980 to 2010) for these papers were retrieved from WoS. 2.3 Statistical procedures and variables (covariates) We fitted 30 sets of regression models with the percentile of citatio ns in year 31, t 31 , as the dependent variable and the (short-)time-window citation percentiles (from y ear 1 to y ear 30) as one independent variable, correspondingly. For each set of models, Model 1 onl y uses short-time-window citation percentiles as predictors (for example, model 1 in set 1 only uses citation percentile in y ear 1 a s the predictor), and Model 2 to 5 sequentially add the other four covariates: journal impact factor (JIF ), number of authors, number of cited references, and number of pages. We used ordinary least-squares regressions, and the normality assumption is not seriously violat ed . The JIF in the year of 1983 is used and calculated from the database by the authors: JIF 1983 for a j ournal equals to the nu mber of tim es that “ citable items ” published in that journal in 1981 and 1982 w ere cited in 1983 divided by the total number of “ citable items ” published by that journal in 1981 and 1982. T he “citable item s” include articles, reviews, and notes. Previous studies have shown that an increase in the number of authors, t he number of cited references, and the number of pages can be expected to result in a higher impact of a paper (Bornm ann & Daniel, 2008 ; Dide gah & Thelwall, 2013 ; Taborsky, 2009 ; Vieira & Gom es, 2010) . We expect that the consideration of these proven relationships in the regression models will lead to a better prediction of the long-term citation impact – especially based on the citation im pa ct measured shortly after the publicatio n da te. The number of authors, the num ber of cited reference s, and the number of pages are skew distributed, so the natural log arithm of these variables is used f or model estim ations. In addition, using the log also allows non-linear relationships between the dependent and the in depende nt variables. Previous studies suggest diminishing effects or even inverted- U shaped effects of these factors (Bornmann & Williams, 2013). We empirically test ed the 7 linear models (using the original scale o f these variables), diminishing return models (using the log of these variables), and inverted-U shaped models (using the original scale of these variables and their squared terms) for each vari able individuall y, and found t hat the log models result in the lowest Bay es ian information criterion (BIC) values. The BIC has been proposed as a means to compare the fit of different regression models. The lower the value of BIC, the better the fit (Long & Freese, 2006). This result suggest that the effects of the number of authors, the number of cit ed references, and the number of pages on citations (ln) are better described by dimini shi ng return models than by linear or quadratic models. In other words, as the number of authors, references, or pages i ncre ases, citations (ln) increase at a decreasing rate. Therefore the natural log arithm of these variables is used for model estimations, instead of using the original scale of these variables or using the linear and squared terms of these variables. 3 Results Table 1 reports descriptive statistics of the dependent variables and covariates. Because shorter citation tim e windows are of greater interest i n this context, we only report model set 1 and set 2 here, in Table 2 and Table 3, respectively. As discussed before, from model 1 to model 5, covariates are gradually added. All regression coefficients are statistically significant, and it might be because of the l arge sample we have (Kline, 2004). With regard to the research questio n of this stud y (how to improve the prediction of the long- term citation impact?), the most important informatio n is the adjusted R 2 in Table 2, which is an indicator for the explanatory power of a model and “represents t he squared re siduals that are explained by the model as a share of the tot al squared residuals” (Kohler & Kreuter, 2012, p. 269). We calculated an adjusted R 2 , because R 2 monotoni call y increases as term s are added to a model (Hardin & Hilbe, 2012). An adjusted R 2 includes shrinkage terms. The higher the (adjusted) R 2 in Table 2, t he more variation in citation impact at time t 31 is e xplained by the 8 covariates, including the citation impact at tim e t 1 and other factors found to have considerable effects on citation impact (e.g., t he nu mber of authors) in the literature. As the results in Table 2 show, adding JIF increases the R 2 from .09 (model 1) to .19 (model 2), while further adding the number of authors (ln) does not have additional effect on the R 2 . However, the number of cited references (ln) and the number of pages (ln) do further improve the R 2 . If all factors (covariates) are included in the regression model (model 5), the R 2 reaches the highest value o f .25. This result shows that incorporating these factors leads to a significantly improv ed pre dictio n of the long-term citation impact at a very early time poi nt: the first year after the publicatio n of a pa per. Table 3 shows the regression model sets predicting citation impact in y ear 31 ba sed on citation impact in y ear 2 gra dually adding cov ariate s. In comparison to Table 2, the citation impact at t 2 can already explain a relatively high am ount of the long -term citation impact: the R 2 is .35. Adding the covariates having a general influence on cit ation impact leads to an increase in the R 2 up to .43. Thus, the consideration o f these c ovariates can improv e the R 2 but not to the extent at y e ar 1 (see the results for year 1 in Table 2) . Figure 1 shows the variance (R 2 ) of citation impact at time t 31 which is explained by the covariates in the different mo dels (c itation impact at tim e t 1 to t 30 as well as influencing factors of citation impact). Corresponding to each model in Table 2 and Table 3, 28 further models were calculated using the citation im pact at time t 3 to time t 30 (instead of the citation impact at tim e t 1 and t 2 ) as a cov ariate. It is clearly visible in Figure 1 that the estim ation of the long-term citation impact can only be improved b y the consi dera tion of the covariates in the years shortly after the publicatio n date (the first one to three years). In later years, inclusion of the covariates no longer improves the R 2 of the long-term citation impact. We repeated the calculatio n of the regression models using a citation rank approach (P100) (Bornmann, et al., in press) instead of the percentiles based on the form ula of Ha zen (1914) and received very simil ar results (which are therefore not shown in this paper). 9 4 Discussion The findings of Bornmann, et al. (in press) revealed that the consideration of journal impact improves the prediction of long-term citation impact. In this study we have t ried to investigate whether it is possible to improve citation impact measurements on the base of a short citation window by the consideration of journal impact and other factors, such as the number of authors, the number of cited references, and the number of pages. Our results show that citation impact m eas urement can rea lly be improved in this manner in the first years after publication. If factors generally influencing citation impact are considered in the statistical analysis, the variance in the long-term citation impact explained by the citation impact in years shortly after the publicatio n date of a paper can be much increased. However, this increase is only significant when us in g the years shortly after publication, but disappears in later y ear s. Our results suggest that in bibliometric evaluation that use short citation time windows, citation impact measurem ents should be adjusted for factors influencing citation impact. Similar adjustments have been proposed fo r institutional performance measurements: Starting out from Goldstein and Spiegelhalter’s (1996) recommendations for the conducting of quantitative comparisons among institutions, Bornmann, Mutz, and Daniel (2013) undertook a reformulation of the Leiden Ranking 2011/2012 (LR) by means of multilevel regression models. The LR was published early in 2012 and uses a set of bibliometric indicators to rank the universities. The results of the regression model s show that the larger the publication output of a university and the grea ter the number of inhabit ants, total area , and GDP (PPP) per capita of a country where the university is located , the higher the citation impact of a university. This result is comparable to the findings in this study where we found that the prediction of the long-term citation impact o f a pa per is significantly inf luenced b y several factors (e.g. the JIF). 10 Based on the results of the regression mo dels, Bornmann, Mutz, et al. (2013) generated a covariate-adjusted ranking of universities. This ranking shows the differences among the universities assuming that a ll universities have the same mean in each o f the covariates included. The results of the covariate-adjusted ranking differ greatly from the non- adjusted ranking. The results of a correlation analysis also m a ke this clear: There is only a moderate correlation (r = .47) between the results of the non-adjusted and covariance-adjusted performance metri cs. Similar to the procedure of Bornmann, Mutz, et al. (2013) f or universities, covariance-adjusted citation im pact metrics c ould be g ener ated for single papers, which could then be used inst ead of the non -adjusted impact metrics. As our results point out the adjusted metrics would be a better predictor o f the long-ter m citatio n impac t of a publication than the non-adjusted metrics. It could be the task of future research to generate these adjusted citation impact metrics and to validate them against an externa l criterion. For exampl e, Bor nmann and Leydesdorff (2013) us ed data of F1000 to investigate the relationship between peers’ rating s and bibliometric metri cs . F1000 i s a p ost-publication peer review system of the biomedical literature. The comparison of met rics with peer e valuatio n has bee n widely ac knowledg ed as a way of validating m etrics : 3 “ The natural criterio n against which to validate metrics is expert evaluation by peers ” (Harnad, 2008, p. 103) . A successful v alidation of the adjusted c itatio n impact metrics in addition to the results referring to reliability in this study would confirm the necessity to consider influencing factors o n citation impact in bibliometric studies (especially in years shortly after the publication dat e of a paper). 3 Whe n using pee r evaluati on to va lidate metri cs, it should be c onsidered t hat peers are also fa llible (Bornmann, 2011 ) 11 Acknowledge m ents The data used in this paper are from a bibliometrics da tabase develo ped and maintained by the Competence Center for Bibliom etrics for the Ger man Science Sy stem ( KB) and derived from the 1980 to 2011 Science Cit ation Index Expande d (SCI-E), Social Sciences Citation Index (SSCI), Arts and Humanities Cit ation Index (AHCI), Conference Proceedings Citation Index- Science (CPCI-S), and Conference Proceedings Cit ation Index - Social Science & Humanities (CPCI-SSH) prepared by Thomson Reuters (Scientific) Inc. (TR ®), Philadelphia, Pennsylvania, USA: ©Copy right Tho mson Reuters ( Scientifi c) 2012. KB is funded b y the German Federal Mini str y of Education and Research (BMBF , projec t num ber : 01PQ08004A). 12 References Bornmann, L. (2011). Scientific peer revi ew. A nnual Review of Information Science and Technology, 45 , 199-245. Bornmann, L. (2013). The problem of cit ation impact assessments for recent publication y ears in institutional evaluatio ns . Journal of Informetrics, 7 (3), 722 -729. doi: http://dx.doi.org/10.1016/j.joi.2013.05.002 . Bornmann, L., & Dani e l, H. -D. (2008). What do citation counts measure? A review of studies on citing behavior. Journal of Documentation, 64 (1), 45-80. doi: 10.1108/00220410810844150. Bornmann, L., de Moy a Ane gón, F., & Leydesdorff, L. (2012). The new Excellence Indi cator in the World Report of the SCIm ago Institutions Rankings 2011. Journal of Informetrics, 6 (2), 333-335. doi: 10.1016/j.joi.2011.11.006. Bornmann, L., & Leydesdorff, L. (2013). The validatio n of (advanced) bibliometric indicators through peer assessments: A comparative study using dat a fr om InCit es and F1000. Journal of Informetrics, 7 (2), 286-291. doi: 10.1016/j.joi.2012.12.003. Bornmann, L., Leydesdorff, L., & Mutz, R. (2013). The use of percenti les and percentile rank classes in the analysis of bibliom etric data: opportunities and limits. J ournal of Informetrics, 7 (1), 158-165. Bornmann, L., Leydesdorff, L., & W ang, J. (in press) . Which percentil e -based approach should be preferred for calculating no r malized citation impact v alues? An empirical comparison of five approaches includi ng a newl y developed cit ation -rank approach (P100). Journal of Informetrics . Bornmann, L., Mutz, R., & Dani el, H. -D. (2013). A multilevel-statistical reformulation of citation-based university ranking s: the Leiden Ranking 2011/2012. Journal of the American Society for Information Science and Technology, 64 (8), 1649-1658. Bornmann, L., & W illiams, R. (2013). How to calculate the practical significance of citation impact differences? An empiri cal example from evaluative institutional bibliometrics using adjusted predictio ns a nd marginal effects. Journal of Informetrics, 7 (2), 562- 574. doi: 10.1016/j.joi.2013.02.005. Cox, N. J. (2005). Calculating percentile ranks or plotti ng positions. Retrieved Ma y 30, from http://www.stata.com/support/faqs/stat/pcrank.html Didegah, F., & Thelwall, M. (2013). Determi nants of re search citatio n impact in nanoscience and nanotechnology. Journal of the American Society for Information Science and Technology, 64 (5), 1055-1064. doi: 10.1002/asi.22806. Goldstein, H., & Spiegelhalter, D. J. (1996). League tables and their limit ations: statistical issues in comparisons of institutional performance. Journal of the Royal Statistical Society Series a-Statistics in Society, 159 , 385-409. Guerrero-Bote, V. P., & de Moya-Anegon, F. (2012). A further step forward in measuring journals' scientific prestige: the SJR2 indicator. Journal of Informetrics, 6 (4), 674-688. Hardin, J., & Hilbe, J. (2012). Generalized linear models and extensions (3 ed.). College Station, Texas, USA: Stata Corporation. Harnad, S. (2008). Validating research perform anc e metrics against peer rankings. E thics in Science and Environmental Politics, 8 , 103-107. Hazen, A. (1914). Storage to be provided in impounding reservoirs for municipal water supply. Transactions of American Society of Civil Engineers, 77 , 1539-1640. Hyndm an, R. J., & Fan, Y. N. (1996). Sample quantiles in statistical packages. American Statistician, 50 (4), 361-365. Kline, R. B. (2004). Beyond significance testing: reformi ng data analysis m ethods in behavioral research . Washington, DC, USA: American Psychological Asso ciation. 13 Kohler, U., & Kreuter, F. (2012). Data analysis using Stata (3. ed.). College Station, TX, USA: Stata Press, Stata Corporatio n. Long, J. S., & Freese, J. (2006). Regression models for categorical dependent variables using Stata (2. ed.). College Station, TX, USA: Stata Press, Stata Corporation. SCImago Reseach Group. (2012). SIR Worl d Report 2012 . Gra nada, Spain: University o f Granada. StataCorp. (2011). Stata statistical software: release 12 . College Station, TX, USA: St a ta Corporation. Taborsky, M. (2009). Biased citatio n prac tice and taxonom ic parochialism. Ethology, 115 ( 2), 105-111. doi: 10.1111/j.1439-0310.2009.01610.x. Vieira, E. S., & Gomes, J. A. N. F. (2010). Citations to scientific articles: its dist ribution and dependence on the article features. Journal of Informetrics, 4 (1), 1-13. doi: 10.1016/j.joi.2009.06.002. Waltman, L., Calero-Medina, C., Kosten, J., Noyons, E. C. M., Tijssen, R. J. W ., van Eck, N. J., . . . Wouters, P. (2012). The Leiden Ranki ng 2011/2012: data collection, indicators, and interpretation. Journal of t he American Society for Information Science and Technology, 63 (12), 2419-2432. Wang, J. (2013). Citation time window choice for research impact evaluation. Scientometrics, 94 (3), 851-872. doi: 10.1007/s11192-012-0775-9. 14 Table 1. Description of the dependent variable and covariates ( n =475,391 publications) Variable Mean Standard deviation Minimum Maximum Percentiles in year 31 49.68 27.95 0.70 100.00 Percentiles in y ear 1 50.02 16.25 33.45 100.00 Percentiles in y ear 2 49.97 24.06 7.55 100.00 JIF 2.08 1.52 0.00 26.98 Number of authors (ln) 0.69 0.59 0.00 4.57 Number of cited references (ln) 2.35 1.19 0.00 7.24 Page numbers (ln) 1.94 0.67 0.00 4.62 15 Table 2. Regression models predicting citation im pact at year 31 based on citation impact in year 1 gradually adding covariates Model 1 Model 2 Model 3 Model 4 Model 5 Intercept 24.36 * (0.13) 17.15 * (0.12) 15.72 * (0.13) 7.14 * (0.13) 1.68 * (0.15) Percentile in y ear 1 0.51 * (0.00) 0.40 * (0.00) 0.40 * (0.00) 0.38 * (0.00) 0.37 * (0.00) Journal Impact Factor 5.95 * (0.02) 5.64 * (0.03) 4.17 * (0.03) 4.35 * (0.03) Number of authors (ln) 3.06 * (0.06) 1.85 * (0.06) 2.20 * (0.06) Number of cited references (ln) 5.82 * (0.03) 4.73 * (0.04) Page numbers (ln) 3.95 * (0.06) R 2 (adjusted) 0.09 0.19 0.19 0.24 0.25 Notes. Standard errors in parentheses * p<.01 16 Table 3. Regression models predicting citation im pact at year 31 based on citation impact in year 2 gradually adding covariates Model 1 Model 2 Model 3 Model 4 Model 5 Intercept 15.17 * (0.08) 11.27 * (0.08) 10.23 * (0.08) 3.92 * (0.09) -0.50 * (0.11) Percentile in y ear 2 0.69 * (0.00) 0.62 * (0.00) 0.61 * (0.00) 0.59 * (0.00) 0.58 * (0.00) Journal Impact Factor 3.64 * (0.02) 3.41 * (0.02) 2.39 * (0.02) 2.54 * (0.02) Number of authors (ln) 2.33 * (0.06) 1.44 * (0.05) 1.72 * (0.05) Number of cited references (ln) 4.48 * (0.03) 3.61 * (0.03) Page numbers (ln) 3.18 * (0.05) R 2 (adjusted) 0.35 0.39 0.39 0.42 0.43 Notes. Standard errors in parentheses * p<.01 17 Figure 1. Explained variance of citation impact at y ear 31 by the covariates in the different models 0,00 0,10 0,20 0,30 0,40 0,50 0,60 0,70 0,80 0,90 1,00 1 3 5 7 9 11 13 15 17 19 21 23 25 27 29 Explained variance (adjusted R 2 ) Year subsequent to publication in 1980 Model 1 Model 2 Model 3 Model 4 Model 5
Original Paper
Loading high-quality paper...
Comments & Academic Discussion
Loading comments...
Leave a Comment