How to evaluate individual researchers working in the natural and life sciences meaningfully? A proposal of methods based on percentiles of citations
Although bibliometrics has been a separate research field for many years, there is still no uniformity in the way bibliometric analyses are applied to individual researchers. Therefore, this study aims to set up proposals how to evaluate individual r…
Authors: Lutz Bornmann, Werner Marx
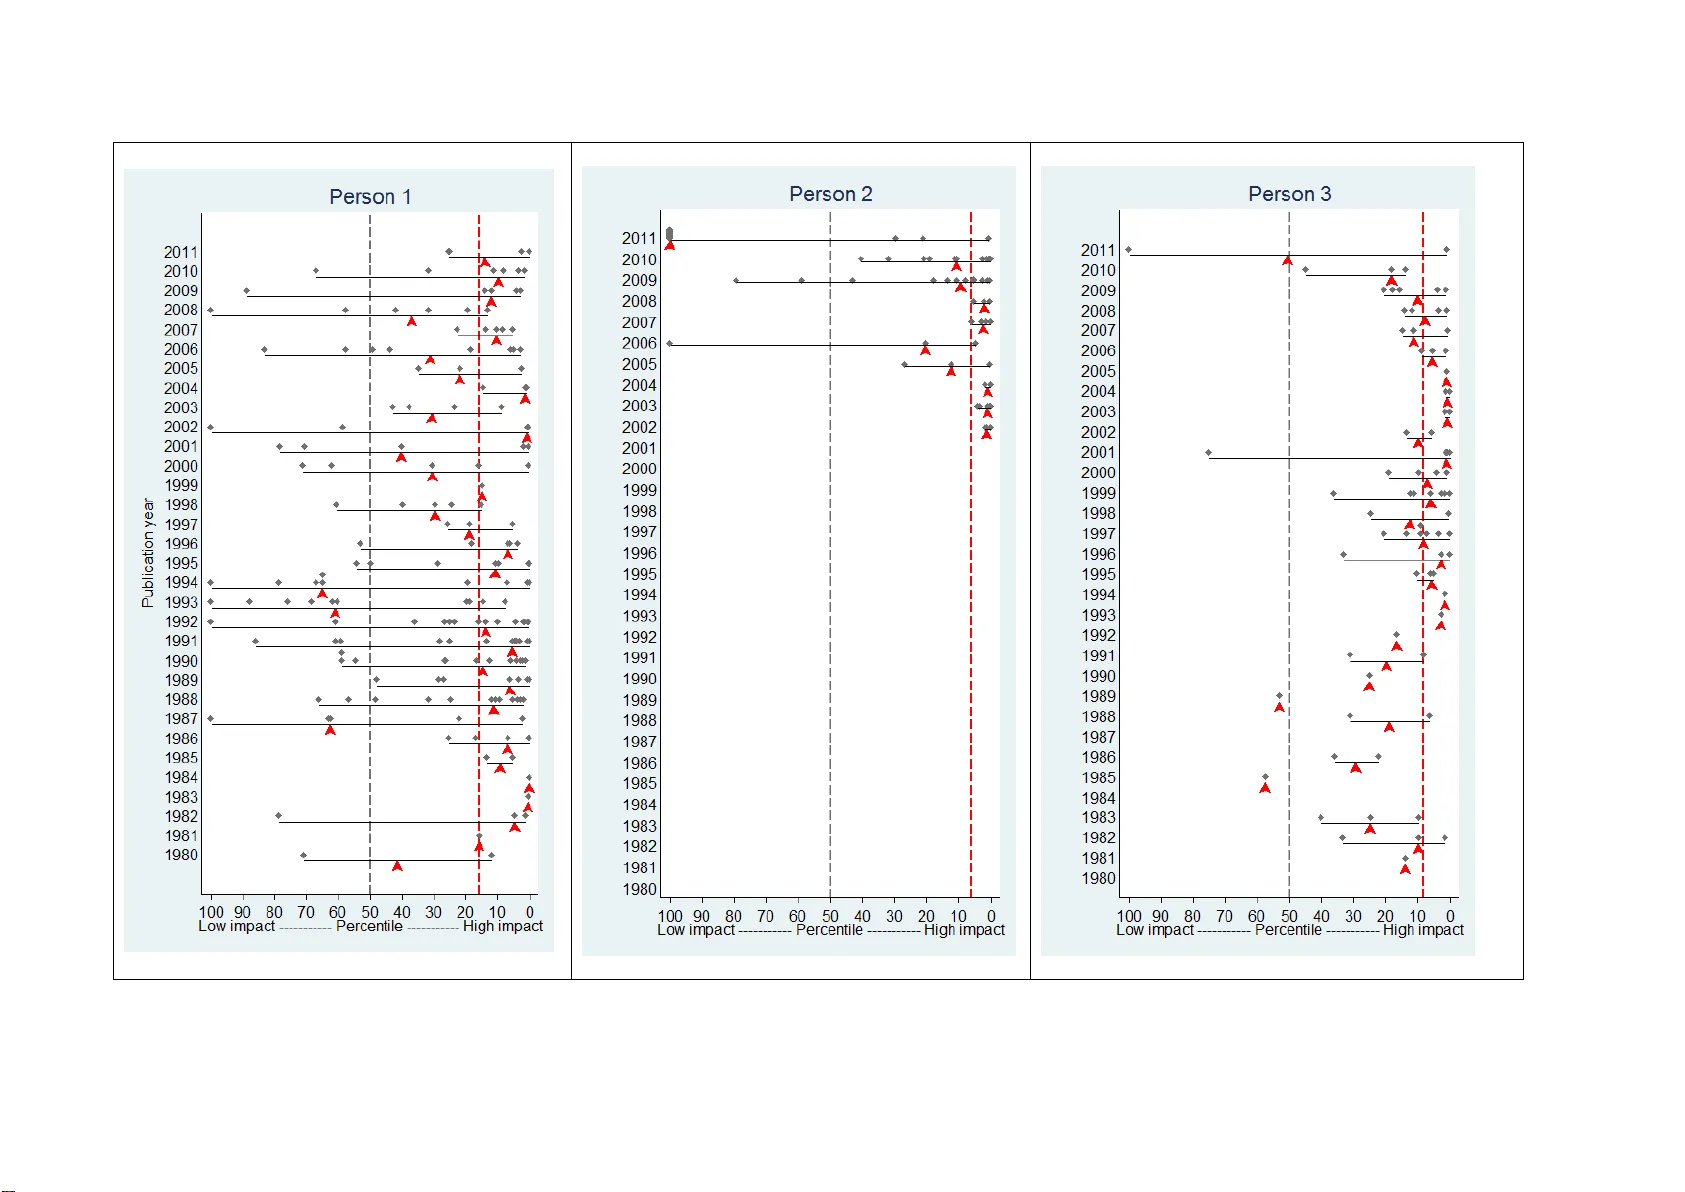
Accepted for publication in Scientometrics How to evaluate ind ividual researc hers work ing in the natural and life scienc es meaningfully ? A proposal of m ethods based on percentiles of citation s Lutz Bornmann$ and Werner Marx* $ Administrative Headquarters of the Max Planck Society, Division for Science and Innovation Studies, Research Analysis, Hofgartenstr. 8, D-80539, Munich, Tel. +49-(0)89- 2108-1265, E-mail: bornmann@gv.mpg.de * Max Planck Institute for Solid State Research, Information Retrieva l Services (IVS -CPT), Heisenbergstraße 1, D-70569 Stuttgart, E-mail: w.marx@fkf.mpg.de 2 Abstract Although bibliometrics has been a separate research field for many years, there is still no uniformity in the way bibliometric analyses are a pplied to individual researchers. Therefore, this study aims to set up proposals how to evaluate individual researchers working in the natural and life sciences. 2005 saw the introduction of the h index, which gives information about a researcher's productivity and the impact of his or her publica tions in a single number (h is the number of publications with at least h citations); however, it is not possible to cover the multidimensional complexit y of research performance and to undertake inter-personal comparisons with this number. This study therefore includes recommenda tions for a set of indicators to be used for evaluating re searchers. Our proposals relate to the selection of data on which an evaluation is based, the analysis of the data a nd th e presentation of the results. Key words bibliometrics, publications, productivity, citations, percentiles, researchers 3 1 Introduction 1 Researchers do science. That is why scientific success is as a rule attributed to individuals (and not institutions or research groups). As these a ttributions can make or break a researcher's reputation, the history of science is marked by countless disputes over the priority assigned to significant results of research (Merton, 1957). The most prestigious and best- known honour a scientist can receive today is the Nobel Prize. Every year, scientists in a number of different disciplines are awarded this prize for outstanding scientific achievement. Since governments have turned to new public management tools to ensure greater efficacy, quantitative measures of performance and benchmarking have been neede d (Lamont, 2012). Prizes (not only the Nobel Prize) cannot be quantitatively analysed to provide an evaluation of the broad majority of researchers: They are rather rare events for researchers and are often awarded for achievements which lie in the distant past (Council of Canadian Academies, 2012). It has therefore become customary in the natural sciences to use bibliometric indicators to measure performance. Especially over the last few years, bibliometric assessment of individual researchers has attracted particular attention. In 2005, Hirsch (2005) presented the h index which gives information about the productivity of a scientist and the impact of his or her publications in one number (h is the number of publications with at least h citations). The h index became very popular relatively quickly (Zhang & Glänzel, 2012). However, as we show in the following, the h index is of only limited suitability for ass essing a researcher's performance (Council of Canadian Academies, 2012). Bibliometric analysis of research pe rformance in the natural and lif e sciences is based on two fundamental assumptions: (1) the results of important research are published in journal articles (van Raan, 2008). That is why the number of articles which a researche r has published says something about how productive his or her research is. (2) Each new piece of research 1 A simi lar Ger man version of this paper w as published in Zeitschrift fü r Evaluation . 4 should be closely linked to current or past research (by other scientists) (Merton, 1980). These close references are marked by citations. As citations refle ct the cognitive impact of the cited publication on the citing publication, the citations are considered as a measure of the impact a publication has on science. 2 It is not difficult to search the number of publications and citations listed for individual scientists in the available literature databases (Kreiman & Maunsell, 2011). Because both numbers (number of publications and citations) are linked to scientific practice 3 and the data is readily available, they have become the most important tools for evaluating individual researchers quantitatively (Garfield, 2002). Today, evaluation studies go further than merely giving the number of publications and citations for a researcher; numerous bibliometric indicators are also used (Grupp & Mogee, 2004), allowing the multi-dimensional nature of scientific achievement to be captured in its complexity (Froghi et al., 2012 ; Haslam & Laham, 2010). Pendlebury (2009) for example suggests using eight different metrics (such a s the average number of publications per year or total citation counts). Each metric has certain advantages and might compensate for the disadvantages of another (Sahel, 2011). A meaningful picture of research performance only emerges when several metrics are taken into account (Lewison, Thornicroft, Szmukler, & Tansella, 2007). However, it should be considered that many metrics chosen for a study correlate with each to a high degree (Abramo, D'Angelo, & Costa, 2010 ; Duffy, Jadidian, Webster, & Sandell, 2011 ; Hemlin, 1996) – even if results differ at a detailed level (Opthof & Wilde, 2011). Therefore, the metrics used in an evaluation study should not, as fa r as possible, lead to redundant results. We would like to present a selection of these metrics in this stud y . 2 The results of st udies on citing beha viour “suggest that not only the content o f scientific work, bu t also other, in part non-scientific, factors play a role in citi ng be haviour. Citations can t herefore be viewed as a complex, multidimensional and not a unidi mensional pheno menon ” ( Bo rnmann & Daniel, 2008 , p. 69 ). According to van Raan (200 5a) “there is, ho wever, sufficient evidence that the se refere nce motives are not so different or ‘randomly given’ to such an extent that the pheno menon of citation would lose its role as a reliable measure of impact” (p. 135). A prerequisite is that t he publication set of the researcher is suf ficiently large. 3 Publications and citations are linked to scientific p ractice to varying degrees; otherwise, we could not have salami-slicing or salami style of publishing (Bornmann & Daniel, 20 07a ). Scientists ha ve been found to slice up data and interpretations i nto two, three, four, o r more papers. 5 Although bibliometrics has been a separate research field for many years (Andres, 2011 ; de Bellis, 2009 ; Moed, 2005 ; Vinkler, 2010) there is still no uniformit y in the way bibliometric analyses are applied to individual researc hers (Sah el, 2011). This study aims to set up proposals how to evaluate individual researchers working in the natural and life sciences meaningfully. The se proposals are particularly necessary in this area. “Evaluating individual scientific performance is an essential component of researc h assessment, and outcomes of such evaluations can play a key role in institutional research strategies, including funding schemes, hiring, firing, and promotions” (Sahel, 2011). Our proposals relate to the selection of data on which an evaluation of this kind is based, the analysis of the data and the presentation of the results. We have limited the study to the e ssential methods. This means that we only propose those (from the plethora of available options, see Vinkler, 2010) which we deem necessary and meaningful for the evaluation. Moreover, we ha ve kept the proposals as simple as possible so that they are strai ghtforward to use. The following describes analy ses with which to measure the productivity of a scientist and the impact of his or her research over a previous period of scie ntific activit y . The methods proposed here are in line with the standards which we have proposed for the bibliometric analysis of research institutions (Bornmann et al., in press). To present our proposals, we use here the data for three selected researc hers who work in similar areas of research but are of different ages and enjoy different levels of academic succe ss. The data is used onl y to illustrate our proposals. For this reason, the researchers are de signated anonymousl y (Person 1, Person 2 and Person 3). 6 2 Methods 2.1 Study design In this section, we would like to discuss some fundamental points which should be taken into account when carrying out a study into the scientific performance of individual researchers. 1) Analysis of publications: A considerable number of publications is recommended as a basis for a statistical analy sis of a sin gle researcher. At the group level, van Raan (2000) deems 10 to 20 publications per year appropriate. According to Lehmann, Jackson, and Lautrup (2008) “i t is possible to draw reliable conclusio ns regarding an author’s citation recor d on the basis of approximatel y 50 papers” ( p. 384). These recommendations for the minimum number of publications imply that an evaluated researcher should be at least at the postdoctoral level. In order to have a set that is as large as possible with which to evaluate a researcher, we recommend taking all the publications into account for the study (and not a set limited to specific publication years) . This solution i mplies that the evaluation does not focus on the cu rrent research performance, but the performance across the whole academic career. Including all of a researcher's publications in the evaluation study obviates the need to use inference statistics to extrapolate from the selected publications (the sample) to the total number (the population) (Bornmann & Mutz, 2013). 2) Citation analysis: If at all possible, everything a researcher has published before the evaluation should be included in the citation analysis. However, it should also be taken into account that it is difficult to evaluate the impact of the most recent publications reliably. The most recent 1 to 2 publication years of a researcher cannot be included in the evaluation, even if methods of field normalization are 7 used (Bornmann, 2013c ; Wang, 2013). According to the Council of Canadian Academies (2012) “p ast research suggested that, for the natural sciences and engineering, an appropriate citation window is typically between three and five years … More recent evidence, however, has proposed that a citation window as short as two years may be appropriate in so me cases … This evidence implies that citation-based indicators should be limited to assessing re search published at least two years previously. Any attempt to use citation- based indicators for more recent research may result in spurious or misleading findings” (p. 68). Depending on the subject area, citations of a publication generally peak in the following two to four years before steadily decrea sing in the following years. “In Biology, Biomedi cal research, Chemistry, Clinical medicine a nd Ph ysics, the peak in citations occurs in the second year after publication, after w hich citations stabili ze or start a decline. Citations for a second group of disciplines follow a more regular and slower - growing trend: for Earth and space science, Engineering, and especially f or Mathematics, the peak of citations occurs in the last year of the time window” ( Abramo, Cicero, & D’Angelo, 2011, p. 666 ). Therefore it is only after several years that it is possible to predict how the impact of a publication will develop. 3) Self-citations: In p rinciple we are of the view that self-citations are usually an important part of the scientific communication and publication process and should therefore be taken into account in an evaluation study. “A self -citation indicates the use of own results in a new publication. Authors do this quite frequently to build upon own results, to limit the length of an article by referring to already published methodology, or simply to make own background material published in ‘grey’ literature visible” (Glänzel, Debackere, Thijs, & Schubert, 2006, p. 265). Only if the question of an evaluation study explicitly means to what extent a 8 scientist h as influenced other scientists’ w ork, self-citations should be obviously ignored. In every evaluation study, however, it should be checked whether a researcher cites him or herself excessively. A large stud y examined the proportion of author self- citations in Norway (from 1981 to 1996): “ More than 45,000 publications have been analysed. Using a three -year citation window we find that 36% of all citations represent author self- citations” (Aksnes, 2003, p. 235). Our experience in practical evaluation in the natura l and life sciences has shown that the perc entage of self-citations is 10-20%. Given the information in the Norwegian study and similar data in other publications (Andres, 2011, pp. 60-61) and our experience in compiling bibliometric reports for individual researchers, we think that a figure that does not exceed approximately 30% is a reasonable level of self-citation (van Raan, 2005b). 2.2 Describing the researcher If possible, a study evaluating an individual researcher should include information about his or her career so that the bibliometric results can be interpreted against this background (Cronin & Meho, 2007 ; Sugimoto & Cronin, 2012). This information includes, for example, the institutions where a re searcher has alread y wor ked or is currentl y working. I f the researcher has a web site, the URL should be given in the evaluation report. The following provides some help regarding other bibliographical information: “For eac h scientist, we gathered employment and basic demographic data from CVs, sometimes complemented by Who’s Who profiles or faculty web pages. We record the f ollowing information: degr ees (MD, PhD, or MD/PhD); year of graduation; mentors during graduate school or post -doctoral fellowship; gender; and department(s)” (Azoulay, Graff Zivin, & Manso, 2009, p. 14). There are similar descriptions in other studies (Duffy, et al., 2011). 9 We do not supply any biographica l information for the three rese archers who have been included as examples in this study in order to preserve their identity. 2.3 Description of the database As many names in the literature databases (suc h as S mith, A.) cannot be assigned completely unambiguously to a certa in person, compil ing the publication set so that it is completely reliable represents a major challenge for single researc her evaluation studies. “ I n bibliometrics, name ambiguity re presents a considerable source of error and can affect the quality and validity of the resu lts” (D'Angelo, Giuffrida, & Abramo, 2011, p. 258). It is estimated that at least 10% of authors share their name with one or more other authors (D'Angelo, et al., 2011 ; Strotmann & Zhao, 2012). It would be very helpful for the evaluation process if each researcher had a unique identification number through which every publication could be accessed. Initiatives of this nature a lread y e xist (see for example http://www.researcherid.com/), but they have not yet had reliable and definite results for all researchers (Kreiman & Maunsell, 2011). The best approach to recording publications accurately would therefore be to use personal publication lists. However, in many cases this is not possible for practical reasons. We therefore recommend that the publications be searched in the databases and – in order to avoid errors and omissions – that the searched publication sets be cross-checked against the publications proven to be from the researchers in question (on his/her institutional homepage). This cross-check should at least cover whether the number of the publications searched in the databases matches the number given by the researcher. Where there are differences, the search strategy in the database should be optimised or the information provided by the researcher verified (Bornmann, et al., in press). In general, researchers should be best possibly involved in the process of compiling their publication set. There may be exceptional circumstances 10 where this may not be the case, but one would usually expect that the individual scientist can provide the personal publication list. The databases used as a rule in evaluative bibliometrics are those supplied by Thomson Reuters (Web of Science, WoS) and Elsevier (Scopus) (Council of Canadian Academies, 2012). In some disciplines it is advisable to work with spec ialist databases (as well). Some of these now give the citation counts for publications as well (for example, Chemical Abstracts in Chemistry ). However, we do not advise using Google Scholar (GS) as a basis for bibliometric analysis. Several studies ha ve pointed out that GS has numerous deficiencies for research evaluation (Bornmann et al., 2009 ; García-Pére z, 2010 ; J acso, 2009, 2010). Besides a number of bibliometric centre s (e.g., the Centre for Science and Technolog y Studies, CWTS, in Leiden, the Netherlands), Thomson Reuters is one supplier of relative citation rates which are time and subject-normalised and which can be used for bibliometric- based evaluation of research. The relative (that is, time and subject-normalised) citation rates can be obtained from the National Citation Report and InCites. Both data bases are based on the WoS. Independent of the source of the time and subject-normalised data (Thomson Reuters or bibliometric centre), the quality of the data should be checked accordingly : errors in normalization can strongly bias the a nal ysis at the level of the individual. To test the reliability of the data, the empirical re sults based on two different data sources can be compared. The number of publications in the WoS core journals (cur rently around 10,000 full y recorded journals) has become the standard measure for the quantifica tion of scientific productivity in the natural and life sciences. In WoS, Thomson Reuters offers various citation indexes (such as the Science Citation Index, SCI , and the Social Science Citation Index, SSCI), the availability of which is subject to a licence a nd which should therefore be documented in every study. Not only outside of the core natural and life sciences subjects (particularly in the area of computer science and engineering science and technology) but also 11 inside of these subjects the coverage of the publications by the databases is not 100%. Moed (2005, p. 126) presents percentages for the overall coverage of the natural and life sciences b y the SCI, which range from 92% (molecular biology a nd biochemistr y) to 53% (mathematics) (see also Korevaar & Moed, 1996 ; Moed & Hesselink, 1996). This means that in the best case, an average of 8% is missing, in the worst case an average of 47%. A similar range was found by Butler and Visser (2006, p. 329) for Australian university publications. It should be further considered that the coverage of publications by WoS is shrinking (Larsen & von Ins, 2009). 2.4 Software We used the statistics program Stata (Bornmann & Ozimek, 2012 ; StataCorp., 2011) to analyse the data for this study. Other programs (such as SPSS or R) can also be used for such analyses. The results are presented in line with the American Psychological Association (2010) guidelines, the standard in empirical social science s. 3 Results A summary of the productivity and citation impact results for the three scientists is shown in Table 1. The detailed results for each indicator are pre sented in additional tables and illustrations. The productivity indicators (upper part of Table 1 ) aim to present a differentiated picture of the publication output, in particular with rega rd to the document types and the author succession. The impact indicators (lower part of Table 1 ) include three types: (1) the base data (total citations, proportion of self-citations, citations per publication), (2) the widely used h index and one of its variant, the m quotient, and (3) the normalized impact indicators (average percentile, top 10% based excellence indicators). These indicator types provide quite different kinds of information concerning scientific perf ormance: The total number of citations and the number of citations per publication are hardly more than the raw data for the 12 calculation of advanced impact indicators. The proportion of self-citations shows whether a critical upper limit is exceeded by a researcher. The h index (and also the m quotient) has to be included because of its proliferation within the scientific community . The advanced indicators, i.e. the normalized impact indicators, provide a time period- and field-independent measurement of research performance, which focus on a researcher ’s complete set of publica tions or alternativel y on the amount of excellent publications. Since the various impact indicators measure research performance different ly , there numbers may contradict each other. We suggest to give the advanced indicators, the (average) percentiles and the top 10% based excellence indica tors, the highest weight when comparing the scientific performance of single researchers. Only these indicators facilitate a fair evaluation of performance. Even if advanced indicators are used, it is important that the results are interpreted against the backdrop of each researcher ’s curriculum vitae and the specific needs of the evaluation process. 3.1 Productivity Publications Figure 1 shows for each researcher the number of publications by document type (also see Table 1 ). Note that the Thomson Reuters classification of publications by document types follows their own criteria and frequently is not in line with the classifica tion in the journals (Meho & Spurgin, 2005). When published, original research results are usuall y c lassified b y database producers as “ A rticles” and long literature overviews as “ R eviews” (Moed, van Leeuwen, & Reedijk, 1996). As Figure 1 shows, publications with the document type “Article”, dominate for all three researchers. “Procee dings papers” also play an important part, particularly for researcher 3, but also for the other two re searchers. Researcher 1 has published significantly more documents of all types (n=190) than Researcher 2 (n= 76) and 3 (n=95). 13 While Researcher 1 published 7.9% (n=15) of his publications as first author (he is the sole author in none of them), this figure is 22.4% of Resea rcher 2's publications (n=17) (he is the sole author in 5 of them) and for Researcher 3 it is 40% (n=38) of the publications (in 12 of which he is the sole author) (see Table 1). We recommend that this information about authorship is taken into account when comparing the productivity of researchers (Su gimoto & Cronin, 2012 ; Zhang & Glänzel, 2012). A publication written without co-authors generally requires more work than one with co-authors (Kreiman & Maunsell, 2011). Furthermore, publications in which the scientists are first authors can be considered more significant in most disciplines, as the first authors frequently do most of the researc h (d e Moya-Anegón, Guerrero-Bote, Bornmann, & Moed, in press). In addition to authorship and document types, the distribution of publications over the years is also an interesting fac tor in researcher evaluation. Are the publications distri buted evenly or unevenly ? Does productivit y increase or decrease; that is, is there a noticeable trend over the years? When did the academic career start? As a rule, this is considered e quivalent to the appearance of the first publication (Kreiman & Maunsell, 2011). As Figure 2 shows for the researchers investigated in this study, publishing history can vary widely (also see Table 1): While Researchers 1 and 3 published for the first time as early as the beginning of the 1990s, Researcher 2 started much later, in 2001. Researcher 1 achieved the highe st levels of productivity approximately 10 years after the beginning of his/her academic career and since then has published around 5 times a year. Since the start of his or her care er, Researcher 2's publications have demonstrated a rising trend which stabilised at 14 per year be tween 2009 and 2011. Researcher 3 published at a consistently low level from the beg inning of the 1980s, peaking at 10 publications in 1997 over many years of publishing activity . As the results of summarizing analyses show in Table 1, Researcher 1 has 5.9 publications per year (arithmetic average); this figure is 6.9 for Researcher 2 and 3.2 for Rese archer 3. 14 Journals According to Pinski and Narin (1976) the analysis of researcher productivity does not take account of the importance of their publications: “The total numbe r of publications of an individual, school or country is a measure of total activit y only; no infe r ences concerning importance may be drawn” (p. 298). There should therefore be additional anal ysis to re veal the significance of the publications. As well as the citation analy sis for each publication, which is shown in the next section, we recommend listing the journals in which a researcher has published. The Normalized Journal Position (NJP) should also be given so that the importance of the journals in their subject area can be determined. We recommend using this indicator rather than the Journal Impact Factor (JIF) as it is not possible to compare the JIFs of journals in different fields with each other (Bornmann, Marx, Gasparyan, & Kitas, 2012 ; Marx & Bornmann, 2012 ; Pendlebury, 2009). The NJP is a gauge of the ranking of a journal in a subject category (sorted by JIF) to w hich the journal is assigned b y Thomson Reuters in the Journal Citation Reports (JCR) (if a journal belongs to more than one category, an average ranking is calculated). “Unlike the IF med [Median JIF of publications], it [NJP] allows for inter-field comparisons as it is a field- normalized indicator” (Costas, van Leeuwen, & Bordons, 2010, p. 1567). The lower the NJP for a journal, the hig her its impact in the field. 4 It is not possible to include all the publications from the three researc hers in the calculation of the NJP. Only those articles ca n be taken in to account which have been published in journals currently analysed by Thomson Reuters for the JCR (and for which a JIF is calculated). 169 publications by Researc her 1 (89%), 63 publications b y Re searcher 2 (83%) and 85 publications by Researc her 3 (90%) are included in the analysis. JIFs from the 4 As a n alter native to t he NJP , other methods for nor malizing the JIF could be used. An overview o f t hese methods can be found in Vinkler (2010, p p. 186-189). However, it is an adva ntage of the NJP co mpared to the other methods that the nece ssary data are read ily available in the WoS. It might be a disadvantage of all normalizing methods that they are based o n jo urnal set s to d elineate di fferent fields. It is well known that these ca tegories can b e quite i mprecise – especially i n cas e of multi-disc iplinary journals and highly specialized fields of research (Bornmann, M utz, Neuha us, & Daniel, 2008 ). T hus, if a publication li st contains p ublicatio ns from these journals and/o r the evaluated scie ntist is active in a highly specialized field, the use of j ournal metrics based on j ournal sets may be a pro blem. 15 JCR Science Edition 2011 were used to calculate the NJP. For example, Thomson Reuters assigns the journal Chemistry of Materials to the subject categories “ Chemistry, P hysical” and “ Materials Science, Multidiscip linary.” In “ Chemistry, P h ysica l” the journal ranks 14 in a total of 134 journals (sorted in decreasing order by the JIF for 2011)(14/134=0.105) and in “ Materials Science, M ultidisciplinary” ranks 13 in a total of 231 (13/231=0.056). The NJP for this journal is 0.08 ((0.105+0.056)/2). The results of the analysis of journals for the three scientists are shown in T able 2. Researcher 1 has the most publications (n=72) in Journal 14 with an NJP of 0.19; for Researcher 2 the most publications (n=9) are in Journal 3 with an NJP of 0.03 and for Researcher 3 (n=34) in Journal 21 with an NJP of 0.31. The best NJP for all the scientists is 0.01 for Journal 1 . Taking an average over all the journals, the NJP is better for Researcher 2 at 0.19 than for Researcher 3 (NJP=0.29) and Researc her 1 (NJP=0.36). The average impa ct for the journals in which Researcher 2 has published is thus higher tha n for Researchers 3 and 1. 3.2 Impact Citations Citations measure an aspect of scientific qualit y – the impact of publications (van Raan, 1996). Martin and Irvine (1983) distinguish betwee n this aspect (“the 'impact' of a publication describes its actual influence on surrounding research activities at a given time,” p. 70) and 'importance' (“the influence on the advance of scientific knowledge,” p. 70) and 'qualit y' (“how well the research has been done ,” p. 70). The y consider the impact as the most important indicator of the significance of a publication on scientific activities. Cole (1992) sees citations as a valid indicator of quality, as they correlate with other qualit y indicators: “Extensive past research indicates that citations are a valid indica tor of the subjective assessment of quality by the scientific c ommunit y. The number of citations is highly 16 correlated with all other measures of quality that sociologists of science emplo y. As long a s we keep in mind that researc h of hi gh quality is being defined a s research that other scientists find useful in their current work, citations provide a satisfactory indicator” (p. 221, see also Bornmann, 2011 ; Smith & Eysenck, 2002). Other benefits of citations for measuring quality (using the impact) are (Marx, 2011) : “it is valid, relatively objective, and, with existing databases and search tools, straightforward to compute” (Nosek et al., 2010, p. 1292). While we have taken account of all the document type s in the anal yses of productivity (see above), it is recommended that only substantial works of researc h are included in citation analyses: “The standard practice is to use journal it ems that have been co ded as regular discovery accounts [articles], brief communications (notes), and review articles – in other words, those types of papers that contain substantive scientific information. Traditionally left to the side are meeting abstracts (generally not much cited), letters to the editor (often expressions of opinion), and correction notices” (Pendlebury, 2008). Following this recommendation, the results presented in the following encompass only “Articles”, “Notes”, “Proceedings Papers” and “Reviews” by the three researc hers. In total, there are 15,192 citations for Researcher 1, 3,796 for Researcher 2 and 7,828 for Researcher 3 (see Table 1). 5 While the proportion of self-citations among these citations for Researcher 1 is 3-4%, this value is approximately 6% for Researchers 2 a nd 3. On average, Researchers 1 (M=83) and 3 (M=89) have had significantly more citations per publication than Researcher 2 (M=52) Percentiles Numerous studies in bibliometrics have shown that citation counts are time and field- dependent. We can therefore expect a varying number of c itations for publications in different fields and years. “This is due to a number of factors: (i) different numbers of journals indexed 5 Citations are a p robabilistic p rocess and there fore the nu mber of citations to t he p ublicatio ns o f the researc hers may vary for all sorts of reasons that have nothing to do with cognitive i mpact (B ornmann & Daniel, 2008 ) . In addition, the measure ment o f citatio ns d oes i nevitably entai l measurement er rors. Hence, stati stical estimation s of the po ssible error invol ved – like confidence i ntervals (C umming, 2012 ) or stabilit y intervals (W altman et al., 2012b) – ar ound the values of citation i ndicators co uld be calculated and ad ded. 17 for the fields in the main bibliometric databases, such as Web of Science or Scopus; (ii) different citation practices among fields and last, but not least (iii) different production functions across fields” (Abramo, et al., 2011, p. 661). According to (Schubert and Braun (1993), 1996)), normalisation should therefore be used with citation analyses. Current research into bibliometrics indicates that there are good arguments in favour of percentiles for normalising citations of individual publications in terms of the subject area and the publication year (Bornmann, Mutz, Marx, Schier, & Daniel, 2011 ; Leydesdorff, Bornmann, Mutz, & Opthof, 2011 ; Waltman, et al., 2012b) . “First, it [percentile ranking ] provides normalization across time such that papers from different years can be directly compared. This result is particularly important for recent papers, because they have typically not had enough time after publication to accumulate large numbers of c itations. Second, given the skewed nature of citation count distributions, it keeps a f ew highly cited papers from dominating citation statistics” (Boyack, 2004, p. 5194 ; Ruiz-Castillo, 2012). Accor ding to analyses by Albarrán and Ruiz-Castillo (2011), around 70% of the publications in a set receive fewer citations than average and 9% of the publications can be designated as highly- cited. The percentile provides information about the impact the publication in question has had compared to other publications (in the same subject area and publication year). Using the distribution of citation frequencies (sorted in descending order) all the publications from the same subject area and the same year of publication as the publication in question are broke n down into 100 percentile ranks. The maximum value is 100 which denotes that a publication has received 0 citations (based on the InCites percentile definition). Accordingly, the lower the percentile rank for a publication turns out to be, the more cita tions it has received among the publications in the same subject area a nd publication year. The perce ntile for the publication in question is determined using the distribution of the perc entile ranks over all publications. For example, a value of 10 means that the publication in question is among the 18 10% most cited publications; the other 90% of the publications have achieved less impact. A value of 50 represents the median and therefore an average impact compared to the other publications. Normalising citations with percentiles allows the impact of publications from different subject areas and publication y ears to be compared with each other. Figure 3 shows the distribution of percentiles for the publications which the thr ee researchers have published over the years. Beam plots (Doane & Tracy, 2000) have been used for illustration (see Bornmann & Marx, in press). They make it possible to present the distribution of percentiles in a publication year combined with the median from these percentiles. It is an advantage of beam plots that they allow two perspectives of evaluations: an overview on the whole career of a person and the focus on specific time periods during the career (e.g., on current research activities) for standalone assessment as well as for comparisons between scientists. While in Figure 3 the individual percentiles for the publications are shown using grey rhombi, the median over a year is display ed with the aid of a red triangle. Furthermore, for each person a red dashed line shows the median of the percentiles for all the years and a grey line marks the value 50. As described above, a value of 50 designates the average impact of a publication in a subject area or publication year. The percentiles for 2011 are only included in order to show all the publication years; a s the citation window for these publications is as a rule too short to accumulate citations, the percentile in many cases is 100 (see Researc her 2 in the figure, for example). As the analyses for the three researchers in Figure 3 show, they achieved a very substantial impact with their publications on ave rage (median). While Researchers 2 and 3 have an average percentile of 6.2 and 8.3, for Researcher 1 this fig ure is 15.9 (see Table 1). Apart from 2005 and 2006, Researcher 2 has had average percentiles around a value of 10 since he or she began publishing. This makes these publications among the 10% m ost cited publications in their subject area and publication y ear. Researcher 3 exhibits a similarly excellent performance over the last twenty years of his or her pub lishing activit y . 19 3.3 The combination of the number of publications and their impac t in one n umber In 2005, the h index was proposed as an indicator with which to measure the performance of individual researchers as follows: “A scientist has index h if h of his or her N p papers have at least h citations each and the other ( N p − h ) papers have ≤ h c itations each” (Hirsch, 2005, p. 16569). Although before 2005 the performance of researchers wa s usuall y measured with separate indicators for productivity and impac t, the h index combines both of these into one number. The h index was adopted relatively quickly b y science insiders and non-academics and became the subject of discussion (Bornmann & Daniel, 2007b, 2009). By the end of 2011, Hirsch’s (2005) publication had been cited almost 1000 times. The h index is now offered as an indicator in many literature databases, such as WoS and Scopus. In so far as bibliometrics has studied the h index, it is concerned primarily with the advantages and disadvantages of the h index (Alonso, Cabrerizo, Herrera-Viedma, & Herrera, 2009 ; Egghe, 2010; Norris & Oppenheim, 2010 ; Panaretos & Malesios, 2009 ; Thompson, Callen, & Nahata, 2009 ; Zhang & Glänzel, 2012). On the one hand, it is seen as an advantage that the h index is easy to calculate, but on the other, a disadvantage that it is normalised neither f or a ge nor for field. It is not possible to compare the h index of researchers from different fields and of different (academic) age s with each other. Against the background of the disadvantages of the h index, almost 40 variations on the h index such a s E gghe ’s (2006) g index have been proposed (Bornmann, Mutz, Hug, & Daniel, 2011). However, none of the variations have so far prevailed successfully over (or besides) the h index. As Table 1 shows, Researcher 1 has a significantly higher h index (h=54) than Researcher 2 (h=27) and Researcher 3 (h=38). As the h index depends very much on the productivity and/or the (academic) age of a researcher ( Bornmann, Mutz, & Daniel, 2008), we followed the recommendation by Hirsch (2005) and have normalised the h index for age, by dividing it by the number of years since the appearance of the first publication. Hirsch (2005) calls this quotient the m quotient. For the three r esearchers (see Table 1) it reveals a clear 20 advantage in the performance of Researcher 2 (m =2.5) compared to Researcher 1 (m=1.7) and Researcher 3 (m=1.2). Even though the h index is age-normalised to give the m quotient, the second step, normalisation for field is missing. (Bornmann (2013a), 2013b)) therefore suggests an alternative to the h index: specifying the number of publications for a researcher which belong to the 10% of the most-cited publications in their field and publication year ( P top 10% ). This indicator is based on the percentile a pproach, in that it counts those publications with a percentile les s than or equal to 10 (see above). The indicator is one of the “su ccess indicators” in bibliometrics which count successful publications and take time and field- normalisation into account (Franceschini, Galetto, Maisano, & Mastrogiacomo, 2012 ; Kosmulski, 2011, 2012). As well as field-normalisation, P top 10% offers another advantage in that it does not use an arbitrary threshold to determine publications in a set with high citation impact. A number of publications (Waltman & van Eck, 2012) have already pointed out the disadvantage of this arbitrariness with the h index. “For ins tance, the h-index could equally well have been defined as follows: A scientist has an h-index of h if h of his publications each have at least 2h citations and his remaining publica tions each have fewer than 2(h+1) citations. Or the following definition could have been proposed: A scientist has an h-index of h if h of his publications each have at least h/2 citations and his remaining publications each have fewer than (h+1)/2 citations” (Waltman & van Eck, 2012, p. 408). According to Kreiman and Maunsell (2011), a threshold should be defined as follows: “This threshold would have to be defined empirically and may itself be field-dependent. This may help encourage scientists to devote more time thinking about and creating excellence r ather than wasting eve r yone’s time with publications that few consider va luable.” A standard in bibliometrics is used to select highly cited publications for P top 10% : Publications which are among the 10% most cited publications in their subject area are as a rule called highly cited or excellent (Bornmann, de 21 Moya Anegón, & Leydesdorff, 2012 ; Sahel, 2011; Tijssen & van Leeuwen, 2006 ; Tijssen, Visser, & van Leeuwen, 2002 ; Waltman, et al., 2012b). As the analyses of the P top 10% for the three researchers in Table 1 show, Researc her 1 has many more excellent publications (70) than Researchers 2 (P top 10% = 31) a nd 3 (P top 10% = 48). To compare the number of P top 10% with an expec ted value, it is possible to calculate the proportion of P top 10% in a rese archer's publication set ( PP top 10% ). A comparison with an expected value is not possible with the h index. The expected va lue of PP top 10% is 10%. If one were to select sample publications (percentiles) at random from a databa se, such as InCites, it could be expected that 10% of the publications would belong to the 10% of the most cited publications in their subject area and publication y ear ( Bornmann, de Moya Anegón, et al., 2012). PP top 10% is seen as the most important indic ator in the Leiden Ranking by the Centre for Science and Technology Studies (Leiden University , The Netherlands) : “We … regard the PP top 10% indicator as th e most important impact indica tor in the Leiden Ranking” (Waltman et al., 2012a, p. 10). As Table 1 shows, all three researchers have considerably more highl y-cited publications than might be expected. F or Researchers 2 and 3, even more than half of the publications are in P top 10% . In the same way as Hirsch (2005) proposed the m quotient for the h index, we would like to propose using the number of years as an ac tive researcher (P top 10% quotient) to normalise P top 10% for age. I ndicators for individual researchers should in general be normalised for age. It is possible to explain the cumulative impact of publications by a researcher to a great extent by the y ears since completion of his or her doctoral studies: “Years since PhD accounted for 43% of the varia nce in log(total citations), 48% of the variance in log( h ), 36% of the variance in log( e ), and 54% of the variance in log( h m ) [ e and h m are variants of the h index]” (Nosek, et al., 2010, p. 1287). In taking into account the number of years as an active researcher, the P top 10% quotient is therefor e normalised not just in terms of the publication year and the field of the individual publications (see above), but also in 22 terms of the age of the researcher. The results with this indicator are shown in Table 1. With a value of 2.8, Researcher 2 published around twice as many P top 10% as Researcher 3 (P top 10% quotient=1.6). The P top 10% quotient for Researcher 1 is 2.2. 4 Discussion An evaluation report for one or more researchers should conclude with a short summary of the most important results. Although with 3 publications per year Re searcher 3 is the least productive of the three, (the other two researc hers have published around 6 times a year), he or she has produced by far the most publications as first a uthor or single author (38 and 12 respectively). The average impac t of the journals in which Researcher 2 has published is higher than that of Researchers 3 and 1. Researcher 1's publications have been c ited most (n=15,192). Researcher 2 does very well particularly on the age-normalised indicators: His or her m quotient (2.5) and P top 10% quotient (2.8) are significantly higher than those of the other two researchers. At 57.8%, Researcher 3 has the highest proportion of excellent publications ( PP top 10% ) in the set. In this study, we have endeavoure d to present a set of different bibliometrical methods with which to evaluate a single researcher. This set is flexible and can be adapted to the application in question. The methods and indicators presented here need not b e used in every instance. For example, with the indicators based on P top 10% which we have presented f or showing publication impact the foc us is on excellence: the abilit y of rese archers to (a) publish in excellent journals (that is, journals which achieve on average a hig h impact in their discipline) and (b) produce publications which are cited ve ry frequently compared to other publications in the same field (Tijssen & van Leeuwen, 2006). The focus on excellence is in line with a general trend in science policy: “Many countries are moving towards research policies that emphasize excellence; conse quentl y, they develop evaluation systems to identify universities, research groups, and researc hers t hat can be said to be 'excellent'“ (Danell, 2011, 23 p. 50). Moreover, a trans-disciplinary bibliometric study could show that scientific progre ss is based primarily on highly -cited publications ( Bornmann, de Moya-Anegón, & Leydesdorff, 2010). If, however, an evaluation of a single scientist does not focus on excellence , the impa ct analyses could be restricted to the presentation of beam plots. Percentiles are used to normalise the impact of individual publications for time and subject area. It is this normalisation which makes it possible to make mea ningful statements about the impact of publications. However, the normalisations are carr ied o ut on the level of the individual publications and are limited to the impact of individual publications. In order to make it possible to make evaluative stateme nts about the productivit y a nd impact of a person, it would be desirable to have available benchmarks at the individual level. Kreiman and Maunsell (2011) have already said as much (Garfield, 1979) : “When comparing different post-doctoral candidates for a junior faculty position, it would be desirable to know the distribution of values for a given index across a large population of individuals in the same field and at the same career stage so that differences among candidates can be evaluated in the context of this distribution. Routinely providing a confidence interval with an index of performance will reveal when individuals are statistically indisting uishable and reduce the chances of misuse” (p. 249). While in many disciplines there are no such comparison values, they have already been introduced in the fields of logistics and medical informatics to evaluate the productivity and impact of researchers (Coleman, Bolumole, & Frankel, 2012 ; El Emam, Arbuckle, Jonker, & Anderson, 2012). When a researcher is evaluated, the bibliometric analy ses should be supplemented with the analysis of other indicators. “It also strongly r ecommended that additional criteria be taken into consideration when assessing individual research performance. These criteria include teaching, mentoring, participation in collective tasks, and collabora tion -building, in addition to quantitative parameters that are not measured by bibliometrics, such as number of patents, speaker invitations, international contracts, di stinctions, and technology transfers” 24 (Sahel, 2011). Bibliometrics needs to be enhanced as appropriate (or replaced by other indicators) particularly in disciplines which cannot be included among the natura l and life sciences. “For the humanities and social sciences (philosophy, history , law, sociolog y, psychology, languages, political sciences, and art) and for mathematics, the exist ing databases do not cover these fields sufficiently. As a consequence, these fields are not able to properly use bibliometrics” (Sahel, 2011). An expert in bibliometrics (familiar with research evaluation) should decide in every case how a researcher is evaluated bibliometrically . A qu alified expert has published in this field and should follow standard procedures. Bibliometrics is now a field in its own right with its own specialist journals and regular conferences. “Calculations should not be left to non - specialists (such as administrators that could use the rapidly a ccessible data in a biased wa y) because the number of potential errors in judgment and assessment is too large. Fre quent errors to be avoided include the homonyms, variations in the use of name initials, and the use of incomplete databases” (Sahel, 2011). Only experts in bibliometrics can take account of the diverse problems and difficulties which ca n arise in a bibliometric anal ysis (Retzer & Jurasinski, 2009). In principle, the evaluation of a researcher should be carried out as part of an “informed peer review” ( Abramo & D’Angelo, 201 1 ; Tay lor, 2011). This i nvolves referees from the same discipline as the researcher being evaluated. We see it as the task of the experts in bibliometrics to give guidance to the referees by indicating how to interpret the different indicators and the results of the bibliometric evaluation. The referees produce a review on the basis of (i) their own assessment of the researcher and (ii) a bibliometric a nalysis (undertaken in advance by an expert in bibliometrics ). Quantitative (bibliometric) methods for measuring the productivity a nd impact of research performance are particularly a t risk from the incorrect interpretation of data. This is because research into the underly ing data is usually separate from its interpretation and application for the purposes of evaluating research. It should not be forgotten that much 25 bibliometric data is politically critical and associated with strong interests (in par ticular reputation and money). Bibliometric indicators have become such a powerful tool within the context of science policy that consideration must be g iven to t heir potential for misleading and destructive use. Their potency requires a code of professiona l eth ics to govern their application (Weingart, 2005). Primarily this means applying the best and fairest approach available in the current bibliometric community (that is, the most appropriate indicators and not the simplest and cheapest) and also that the limitations of the method and potential distortions are pointed out (Marx & Bornmann, in press). Scientists, who should be used to handling bibliometric data as end users, should be able to understand the limitations of the data and the risks that can result and it must be possible for them to call them to account. However this is often not the case: when money and reputation are at stake, scientists are also only human and forget the rules of g ood scientific practice. Bibliometric data is likely to be misinterpreted if this can benefit their positive image or completely ignored if it does not provide confirmation of scientists' perception of themselves. It might also be used as ammunition against competitors if it seems appropria te for this purpose. The danger of partiality presents anyone creating bibliometric da ta (the database producers) and undertaking bibliometric studies (the bibliometricians) with a special responsibility. The end users of the da ta are called upon to take the guidelines of both groups seriously to take account of the outcomes and relationships determined b y bibliometric research over decades. 26 Acknowledge m ents We thank two anonymous reviewers for the recommendations to sig nificantly improve the manuscript. 27 References Abramo, G., Cicero, T., & D’Angelo, C. A. (2011). Assessing the varying level of impact measurement accuracy as a function of the citation window leng th. Journal of Informetrics, 5 (4), 659-667. doi: 10.1016/j.joi.2011.06.004. Abramo, G., D'Angelo, C. A., & Costa, F. D. (2010). Testing the trade-off between productivity and quality in research activities. Journal of the American Society for Information Science and Technology, 61 (1), 132-140. Abramo, G., & D’Angelo, C. (2011). Evaluating research: from informed peer review to bibliometrics. Scientometrics, 87 (3), 499-514. doi: 10.1007/s11192-011-0352-7. Aksnes, D. W. (2003). A macro study of self-citation. Scientometrics, 56 (2), 235-246. Albarrán, P., & Ruiz-Castillo, J. (2011). References made and citations received by scientific articles. Journal of the American Society for Information Science and Technology, 62 (1), 40-49. doi: 10.1002/asi.21448. Alonso, S., Cabrerizo, F. J., Herrera-Viedma, E., & Herrera, F. (2009) . h- Index: a review focused in its variants, computation and standardization for differe nt scientific fields. Journal of Informetrics, 3 (4), 273-289. doi: 10.1016/j.joi.2009.04.001. American Psychological Association. (2010). Publication manual of the American Psychological Association (6. ed.). Washington, DC, USA: American Psychological Association (APA). Andres, A. (2011). Measuring Academic Research: how to undertake a bibliometric study . New York, NY, USA: Neal-Schuman Publishers. Azoulay, P., Graff Zivin, J. S., & Manso, G. (2009). Incentives and creativity: evidence from the academic life sciences (NBER Working Pape r No. 15466) . Cambrid ge, MA, USA: National Bureau of Economic Researc h (NBER). Bornmann, L. (2011). Scientific peer review. Annual Review of Information Science and Technology, 45 , 199-245. Bornmann, L. (2013a). A better alternative to the h index. Journal of Informetrics, 7 (1), 100. doi: 10.1016/j.joi.2012.09.004. Bornmann, L. (2013b). How to analyse percentile citation impact data meaningfully in bibliometrics: The statistical analysis of distributions, perc entile rank classes and top - cited papers. Journal of the American Society for Information Science and Technology, 64 (3), 587-595. Bornmann, L. (2013c). The problem of c itation impact assessments for recent publication years in institutional evaluations. Journal of Informetrics, 7 (3), 722-729. doi: http://dx.doi.org/10.1016/j.joi.2013.05.002 . Bornmann, L., Bowman, B. F., Ba uer, J., Marx, W., Schier, H., & Palzenberger, M. (in press). Standards for using bibliometrics in the evaluation of researc h institutes. In B. Cronin & C. Sugimoto (Eds.), Next generation metrics . Cambridge, MA, USA: MIT Press. Bornmann, L., & Daniel, H.-D. (2007a). Multiple publication on a single research study: does it pay ? The influence of number of research articles on total citation counts in biomedicine. Journal of the American Society for Information Science and Technology, 58 (8), 1100-1107. Bornmann, L., & Daniel, H.-D. (2007b). What do we know about the h index? Journal of the American Society for Information Science and Technology, 58 (9), 1381-1385. doi: 10.1002/asi.20609. Bornmann, L., & Daniel, H.-D. (2008). What do citation counts measure? A review of studies on citing behavior. Journal of Documentation, 64 (1), 45-80. doi: 10.1108/00220410810844150. 28 Bornmann, L., & Daniel, H.-D. (2009). The state of h index research. Is the h index the ideal way to measure research performance? EMBO Reports, 10 (1), 2-6. doi: 10.1038/embor.2008.233. Bornmann, L., de Moya-Anegón, F., & Ley desdorff, L. (2010). Do scientific advancements lean on the shoulders of giants? A bibliometric investiga tion of the Ortega hypothesis. PLoS ONE, 5 (10), e11344. Bornmann, L., de Moya Anegón, F., & Ley desdorff, L. (2012). Th e new Excellence Indicator in the World Report of the SCImago Institutions Rankings 2011. Journal of Informetrics, 6 (2), 333-335. doi: 10.1016/j.joi.2011.11.006. Bornmann, L., & Marx, W. (in press). Distributions instead of single numbers: percentiles and beam plots for the assessment of single researchers. Journal of the American Society of Information Science and Technology . Bornmann, L., Marx, W., Gasparyan, A. Y., & Kitas, G. D. (2012). Diversity, value and limitations of the Journal Impact Factor and alternative metrics. Rheumatology International (Clinical and Experimental Investigations) , 32 (7), 1861-186 7. Bornmann, L., Marx, W., Schier, H., Rahm, E., Thor, A., & Daniel, H. D . (2009). Conver gent validity of bibliometric Google Scholar data in the field of chemistry . Citation counts for papers that were accepted by Angewandte Che mie International Edition or rejected but published elsewhere, using Google Scholar, Science Citation Index, Scopus, and Chemical Abstracts. Journal of Informetrics, 3 (1), 27-35. doi: 10.1016/j.joi.2008.11.001. Bornmann, L., & Mutz, R. (2013). The advantage of the use of sa mples in evaluative bibliometric studies. Journal of Informetrics, 7 (1), 89-90. doi: 10.1016/j.joi.2012.08.002. Bornmann, L., Mutz, R., & Daniel, H.-D. (2008). Are there better indices for evaluation purposes than the h index? A comparison of nine different variants of the h index using data from biomedicine. Journal of the American Society for Information Science and Technology, 59 (5), 830-837. doi: 10.1002/asi.20806. Bornmann, L., Mutz, R., Hug, S. E., & Daniel, H. D. (2011). A meta-analysis of studies reporting correlations between the h index and 37 different h index variants. Journal of Informetrics, 5 (3), 346-359. doi: 10.1016/j.joi.2011.01.006. Bornmann, L., Mutz, R., Marx, W., Schier, H., & Daniel, H.-D. (2011). A multilevel modelling approach to investigating the predictive validity of e ditorial decisions: do the editors of a high-profile journal select manuscripts that are highly cited after publication? Journal of the Royal Statistical Society - Series A (Statistics in Society), 174 (4), 857-879. doi: 10.1111/j.1467-985X.2011.00689.x. Bornmann, L., Mutz, R., Neuhaus, C., & Daniel, H.-D. (2008). Use of citation counts for research evaluation: standards of good practice for analy zing bibliometric data and presenting and interpreting results. Ethics in Science and Environmental Politics, 8 , 93-102. doi: 10.3354/esep00084. Bornmann, L., & Ozimek, A. (2012). Stata commands for importing bibliometric data and processing author address information. Journal of Informetrics, 6 (4), 505-512. doi: 10.1016/j.joi.2012.04.002. Boyack, K. W. (2004). Mapping knowledge domains: characterizing PNAS. Proceedings of the National Academy of Sciences of the United States of America, 101 , 5192-5199. Butler, L., & Visser, M. S. (2006). Extending citation analysis to non-source items. Scientometrics, 66 (2), 327-343. doi: DOI 10.1007/s11192-006-0024-1. Cole, S. (1992). Making science. Between nature and society . Cambridge, MA, USA: Harvard University Press. Coleman, B. J., Bolumole, Y. A., & Frankel, R. (2012). Benchmarking individual publication productivity in logistics. Transportation Journal, 51 (2), 164-196. 29 Costas, R., van Leeuwen, T. N., & Bordons, M. (2010). A bibliometric c lassificator y approach for the study and assessment of research performance at the individual level: The effects of age on productivity and impa ct. Journal of the American Society for Information Science and Technology, 61 (8), 1564-1581. Council of Canadian Academies. (2012). Informing research choices: indicators and judgment: the expert panel on science performance and research funding. . Ottawa, Canada: Council of Canadian Academies. Cronin, B., & Meho, L. I. (2007). Timelines of creativity : a study of intellectual innovators in information science. Journal of the American Society for Information Science and Technology, 58 (13), 1948-1959. doi: Doi 10.1002/Asi.20667. Cumming, G. (2012). Understanding the new statistics: effec t sizes, confidence intervals, and meta-analysis . London, UK: Routledge. D'Angelo, C. A., Giuffrida, C., & Abramo, G. (2011). A heuristic approac h to author name disambiguation in bibliometrics databases for large-scale research assessments. Journal of the American Society for Information Science and Technology, 62 (2), 257- 269. doi: 10.1002/asi.21460. Danell, R. (2011). Can the quality of scientific work be pre dicted using information on the author's track record? Journal of the American Society for Information Scienc e and Technology, 62 (1), 50-60. doi: 10.1002/asi.21454. de Bellis, N. (2009). Bibliometrics and citation analysis: from the Science Citation Index to Cybermetrics . Lanham, MD, USA: Scarecrow Press. de Moya-Anegón, F., Guerrero-Bote, V. P., Bornmann, L., & Moed, H. F. (in press). The research guarantors of scientific papers and the output counting: a promising new approach. Scientometrics . Doane, D. P., & Tracy, R. L. (2000). Using beam and fulcrum displays to explore data. American Statistician, 54 (4), 289-290. doi: 10.2307/2685780. Duffy, R., Jadidian, A., Webster, G., & Sandell, K. (2011). The research productivity of academic psychologists: assessment, trends, and best prac tice recommendations. Scientometrics, 89 (1), 207-227. doi: 10.1007/s11192-011-0452-4. Egghe, L. (2006). Theory and practise of the g -index. Scientometrics, 69 (1), 131-152. doi: 10.1007/s11192-006-0144-7. Egghe, L. (2010). The Hirsch index and related impact measures Annual Review of Information Science and Technology, 44 , 65-114. El Emam, K., Arbuckle, L., Jonker, E., & Anderson, K. (2012). Two h-index benchmarks for evaluating the publication performance of medical informatics researc hers. Journal of Medical Internet Research, 14 (5). doi: 10.2196/jmir.2177. Franceschini, F., Galetto, M., Maisano, D., & Mastrogiacomo, L. (2012). The succe ss - in dex: an alternative approach to the h- index for evaluating an individual’s research output. Scientometrics, 92 (3), 621-641. doi: 10.1007/s11192-011-0570- z. Froghi, S., Ahmed, K., Finch, A., Fitzpatrick, J. M., Khan, M. S., & Dasgupta, P. (2012). Indicators for research performance evaluation: an overview. BJU International, 109 (3), 321-324. doi: 10.1111/j.1464-410X.2011.10856.x. García-Pérez, M. A. (2010). Accuracy and completeness of publication and citation records in the Web of Science, PsycINFO, and Google Scholar: A case study for the computation of h indices in Psychology . Journal of the Americ an Society for Information Science and Technology, 61 (10), 2070-2085. doi: 10.1002/asi.21372. Garfield, E. (1979). Citation indexing - its theory and application in science, technology, and humanities . New York, NY, USA: John Wiley & Sons, Ltd. Garfield, E. (2002). Highly cited authors. Scientist, 16 (7), 10. 30 Glänzel, W., Debackere, K., Thijs, B., & Schubert, A. (2006). A concise review on the role of author self-citations in information science, bibliometrics and science policy . Scientometrics, 67 (2), 263-277. Grupp, H., & Mogee, M. E. (2004). Indicators for national science and technolog y policy : their development, use, and possible misuse. In H. F. Moed, W. Glänzel & U. Schmoch (Eds.), Handbook of quantitative science and technology rese arch. T he use of publication and patent statistics in studies of S& T systems (pp. 75-94). Dordrecht, The Netherlands: Kluwer Acade mic Publishers. Haslam, N., & Laham, S. M. (2010). Quality, quantity, and impact in academic publication. European Journal of Social Psychology, 40 (2), 216-220. doi: 10.1002/ejsp.727. Hemlin, S. (1996). Research on research evaluations. Social Epistemology, 10 (2), 209-250. Hirsch, J. E. (2005). An index to quantify an individual' s scientific research output. Proceedings of the National Academy of Science s of the United States of America, 102 (46), 16569-16572. doi: 10.1073/pnas.0507655102. Jacso, P. (2009). Google Scholar's g host authors. Library Journal, 134 (18), 26-27. Jacso, P. (2010). Metadata mega mess in Google Scholar. Online Information Review, 34 (1), 175-191. doi: 10.1108/14684521011024191. Korevaar, J. C., & Moed, H. F. (1996). Validation of bibliometric indicators in the field of mathematics. Scientometrics, 37 (1), 117-130. doi: Doi 10.1007/Bf02093488. Kosmulski, M. (2011). Successful papers: a new idea in evaluation of scientific output. Journal of Informetrics, 5 (3), 481-485. doi: 10.1016/j.joi.2011.03.001. Kosmulski, M. (2012). Modesty-index. Journal of Informetrics, 6 (3), 368-369. doi: 10.1016/j.joi.2012.02.004. Kreiman, G., & Maunsell, J. H. R. (2011). Nine criteria for a measure of scientific output. Frontiers in Computational Neuroscience, 5 . doi: 10.3389/fncom.2011.00048. Lamont, M. (2012). Toward a Comparative Sociology of Valuation and Evaluation. Annual Review of Sociology, 38 (1), 201-221. doi: doi:10.1146/annurev-soc-070308-120022. Larsen, P. O., & von Ins, M. (2009). The steady growth of scientific publication and th e declining coverage provided by Science Citation Index. In B . Larsen & J. Leta (Eds.), Proceedings of ISSI 2009 - 12th International Conference of the International Society for Scientometrics and Informetrics, Vol 2 (Vol. 2, pp. 597-606). Leuven: Int Soc Scientometrics & Informetrics-Issi. Lehmann, S., Jackson, A., & Lautrup, B. (2008). A quantitative analysis of indicators of scientific performance. Scientometrics, 76 (2), 369-390. doi: 10.1007/s11192-007- 1868-8. Lewison, G., Thornicroft, G., Szmukler, G., & Tansella, M. (2007). Fair assessment of the merits of psychiatric research. British Journal of Psychiatry, 190 , 314-318. doi: 10.1192/bjp.bp.106.024919. Leydesdorff, L., Bornmann, L., Mutz, R., & Opthof, T. (2011). Turning the tables in citation analysis one more time: principles for comparing sets of documents. Journal of the American Society for Information Science and Technology, 62 (7), 1370-1381. Martin, B. R., & Irvine, J. (1983). Assessing basic research - some partial indicators of scientific progress in radio astronomy. Research Policy, 12 (2), 61-90. Marx, W. (2011). Bibliometrie in der Forschungsbewertung: Aussagekraft und Grenzen. Forschung & Lehre, 11 , 680. Marx, W., & Bornmann, L. (2012). Der Journal Impact Factor: Aussag ekraft, Grenzen und Alternativen in der Forschungsevaluation. Beiträge zur Hochschulforschung, 34 (2), 50-66. Marx, W., & Bornmann, L. (in press). On the problems of dealing with bibliometric data. Journal of the American Society for Information Sciences and Technology . 31 Meho, L. I., & Spurgin, K. M. (2005). Ranking the re search productivity of library and information science faculty and schools: an eva luation of data sources and research methods. Journal of the American Society for Information Science and Technology, 56 (12), 1314-1331. Merton, R. K. (1957). Priorities in scientific discovery : a chapter in the sociolog y of sc ience. American Sociological Review, 22 (6), 635-659. doi: 10.2307/2089193. Merton, R. K. (1980). Auf den Schultern von Riesen ein Leitfaden durch das Labyrinth der Gelehrsamkeit . Frankfurt am Main, Germany: Syndikat. Moed, H. F. (2005). Citation analysis in research evaluation . Dordrecht, The Netherlands: Springer. Moed, H. F., & Hesselink, F. T. (1996). The publication output and impac t of academic chemistry research in the Nether lands during the 1980s: bibliometric analysis and policy implications. Research Policy, 25 (5), 819-836. Moed, H. F., van Leeuwen, T. N., & Reedijk, J. (1996). A critical analysis of the journal impact factors of Angewandte Chemie and the Journal of the American Chemical Society - inaccuracies in published impact factors based on overall citations only . Scientometrics, 37 (1), 105-116. Norris, M., & Oppenheim, C. (2010). The h-index: a broad review of a new bibliometric indicator. Journal of Documentation, 66 (5), 681-705. doi: 10.1108/00220411011066790. Nosek, B. A., Graham, J., Lindner, N. M., Ke sebir, S ., Hawkins, C. B., Hahn, C., . . . Tenney, E. R. (2010). Cumulative and career-stage citation impact of social-personality psychology programs and their members. Personality and social Psychology Bulletin, 36 (10), 1283-1300. doi: Doi 10.1177/0146167210378111. Opthof, T., & Wilde, A. A. M. (2011). Bibliometric data in clinical cardiology revisited. The case of 37 Dutch professors. Netherlands Heart Journal, 19 (5), 246-255. doi: 10.1007/s12471-011-0128- y. Panaretos, J., & Malesios, C. (2009). Assessing scientific research performance and impact with single indices. Scientometrics, 81 (3), 635-670. doi: 10.1007/s11192-008-2174-9. Pendlebury, D. A. (2008). Using bibliometrics in evaluating research . Philadelphia, PA, USA: Research Department, Thomson Scientific. Pendlebury, D. A. (2009). The use and misuse of journal metrics and other citation indicators. Archivum Immunologiae Et Therapiae Experimentalis, 57 (1), 1-11. doi: 10.1007/s00005-009-0008- y. Pinski, G., & Narin, F. (1976). Citation influence for journal aggregates of scientific publications - theory, with application to literature of phy sics. Information Processing & Management, 12 (5), 297-312. Retzer, V., & Jurasinski, G. (2009). Towards objectivity in researc h evaluation using bibliometric indicators: a protocol for incor porating complexit y. Basic and Applied Ecology, 10 (5), 393-400. doi: 10.1016/j.baae.2008.09.001. Ruiz-Castillo, J. (2012). The evaluation of citation distributions. SERIEs: Journal of the Spanish Economic Association, 3 (1), 291-310. doi: 10.1007/s13209-011-0074-3. Sahel, J. A. (2011). Quality versus quantity: asse ssing individual research performance. Science Translational Medicine, 3 (84). doi: 10.1126/scitranslmed.3002249. Schubert, A., & Braun, T. (1993). Reference standards for citation based a ssessments. Scientometrics, 26 (1), 21-35. Schubert, A., & Braun, T. (1996). Cross-field normalization of scientometric indicators. Scientometrics, 36 (3), 311-324. Smith, A., & Eysenck, M. (2002). The correlation between RAE ratings and citation counts in psychology . London: Department of Psy cholog y, Royal Holloway, University of London, UK. 32 StataCorp. (2011). Stata statistical software: release 12 . College Station, TX, USA: Stata Corporation. Strotmann, A., & Zhao, D. (2012). Author name disambiguation: What differe nce does it make in author-based citation analysis? Journal of the American Society for Information Science and Technology, 63 (9), 1820-1833. doi: 10.1002/asi.22695. Sugimoto, C. R., & Cronin, B. (2012). Biobibliometric profiling: An examination of multifaceted approaches to scholarship. Journal of the American Society for Information Science and Technology, 63 (3), 450-468. doi: 10.1002/asi.21695. Taylor, J. (2011). The assessment of research quality in UK universities: peer review or metrics? British Journal of Management, 22 (2), 202-217. doi: 10.1111/j.1467- 8551.2010.00722.x. Thompson, D. F., Callen, E. C., & Nahata, M. C. (2009). New indices in scholarship assessment. American Journal of Pharmaceutical Education, 73 (6). Tijssen, R., & van Leeuwen, T. (2006). Centres of research excellence and science indicators. Can 'excellence' be captured in numbers? In W. Glänzel (Ed.), Ninth International Conference on Science and Technology Indicators (pp. 146-147). Leuven, Belgium: Katholieke Universiteit Leuven. Tijssen, R., Visser, M., & van Leeuwen, T. (2002). Benchmarking international scientific excellence: are highly cited re search papers an appropriate frame of reference? Scientometrics, 54 (3), 381-397. van Raan, A., F. J. (2008). Bibliometric statistical properties of the 100 largest European research universities: prevalent scaling rules in the science system. Journal of the American Society for Information Science and Technology, 59 (3), 461-475. doi: 10.1002/asi.20761. van Raan, A. F. J. (1996). Advanced bibliometric methods as quantitative core of peer review based evaluation and foresight exerc ises. Sciento metrics, 36 (3), 397-420. van Raan, A. F. J. (2005a). Fatal attrac tion: conceptual and methodological problems in the ranking of universities by bibliometric methods. Scientometrics, 62 (1), 133-143. van Raan, A. F. J. (2005b). Measurement of central aspects of scientific research: performance, interdisciplinarity, struc ture. M easurement, 3 (1), 1-19. van Raan, A. J. F. (2000). The Pandora's Box of citation analy sis: measuring scientific excellence - the last evil? In B. Cronin & H. B. Atkins (Eds.), The Web of Knowledge (pp. 301-319). Medford, NJ, USA: Information Today, Inc. Vinkler, P. (2010). The evaluation of research by scientometric indicators . Oxford, UK: Chandos Publishing. Waltman, L., Calero-Medina, C., Kosten, J., Noyons, E. C. M., Tijssen, R. J. W., van Eck, N. J., . . . Wouters, P. (2012a). The Leiden Ranking 2011/2012: data collection, indicators, and interpretation. Retrieved February 24, from http://arxiv.org/abs/1202.3941 Waltman, L., Calero-Medina, C., Kosten, J., Noyons, E. C. M., Tijssen, R. J. W., van Eck, N. J., . . . Wouters, P. (2012b). The Leiden Ranking 2011/2012: data collection, indicators, and interpretation. Journal of the American Society for Information Science and Technology, 63 (12), 2419-2432. Waltman, L., & van Eck, N. J. (2012). The inconsistency of the h-index. Jo urnal of the American Society for Information Science and Technology, 63 (2), 406-415. doi: 10.1002/asi.21678. Wang, J. (2013). Citation time window choice for research impact evaluation. Scientometrics, 94 (3), 851-872. doi: 10.1007/s11192-012-0775-9. Weingart, P. (2005). Das Ritual der Evaluierung und die Verführbarkeit. In P. Weingart (Ed.), Die Wissenschaft der Öffentlichkeit: Essays zum Verhältnis von W issenschaft, Medien und Öffentlichkeit (pp. 102-122). Weilerswist, Germany: Velbrück. 33 Zhang, L., & Glänzel, W. (2012). Where demographics meets scientometrics: towards a dynamic career analysis. Scientometrics, 91 (2), 617-630. doi: 10.1007/s11192-011- 0590-8. 34 Table 1. Overview of the scientific performance of three researchers. Indicator Person 1 Person 2 Person 3 Productivity Article 143 54 43 Editorial 1 1 4 Letter 3 0 1 Meeting Abstract 3 0 2 News Item 0 2 0 Note 12 0 1 Proceedings Paper 26 17 40 Review 2 2 4 Total publications 190 76 95 Number of articles, notes, proceedings papers and reviews 183 73 88 Number of publications as first author * 15 17 38 Number of publications with no co-authors * 0 5 12 Year of first publication * 1980 2001 1981 Number of years between the first publication and 2011 * 32 11 31 Number of publications per year (arithmetic average * 5.9 6.9 3.2 Impact Total citations ** 15,192 3,796 7,828 Number of citations per publication ** (arithmetic average) 83 52 89 Proportion of self-citations in total citations * 3.4% 6% 5.8% h index ** 54 27 38 m quotient ** 1.7 2.5 1.2 Average percentile (median)** 15.9 6.2 8.3 P top 10% ** 70 31 48 PP top 10% ** 39.3% 52.5% 57.8% P top 10% quotient ** 2.2 2.8 1.6 Remarks * Based on publications of all document types ** Based on articles, letters, reviews, notes and proceedings papers 35 Figure 1. Number of publications with different document types by three researchers 0 20 40 60 80 100 120 140 160 180 200 Num ber of pub lications Person 3 (n=95) Person 2 (n=76) Person 1 (n=190) ARTICLE EDITORIAL LETTER MEETING ABSTRACT NEW S ITEM NOTE PROCEEDINGS PAPER REVIEW 36 Figure 2. Number of publications by three re searchers over the years 2 1 1 3 3 1 3 2 1 2 1 5 2 5 12 2 7 2 13 1 13 2 16 1 10 1 9 1 7 5 5 4 4 10 6 2 1 7 6 6 5 1 5 5 5 3 4 8 2 5 3 4 4 4 1 8 3 3 7 5 6 6 5 4 5 14 6 6 14 3 5 14 3 2011 2010 2009 2008 2007 2006 2005 2004 2003 2002 2001 2000 1999 1998 1997 1996 1995 1994 1993 1992 1991 1990 1989 1988 1987 1986 1985 1984 1983 1982 1981 1980 Pu b l i c a t i o n y e a r Person 1 Person 2 Person 3 37 Table 2. Number of publications by three researc hers in various journals. T he Normalized Journal Position (NJP) based on the Journal Impact Factors from the Journal Citation Reports Science Edition 2011 is given for each journal. The journals are sorted in descending order by NJP. Person 1 Person 2 Person 3 Journal Number NJP Journal Number NJP Journal Number NJP Journal 1 1 0.01 Journal 1 3 0.01 Journal 1 1 0.01 Journal 2 3 0.05 Journal 2 1 0.01 Journal 2 1 0.03 Journal 3 26 0.06 Journal 3 9 0.03 Journal 3 3 0.03 Journal 4 1 0.07 Journal 4 5 0.05 Journal 4 1 0.05 Journal 5 3 0.07 Journal 5 1 0.05 Journal 5 3 0.06 Journal 6 1 0.07 Journal 6 1 0.05 Journal 6 1 0.08 Journal 7 2 0.08 Journal 7 3 0.06 Journal 7 5 0.08 Journal 8 1 0.08 Journal 8 1 0.07 Journal 8 3 0.09 Journal 9 1 0.08 Journal 9 1 0.07 Journal 9 2 0.10 Journal 10 1 0.10 Journal 10 2 0.08 Journal 10 1 0.14 Journal 11 1 0.10 Journal 11 1 0.09 Journal 11 1 0.18 Journal 12 1 0.16 Journal 12 3 0.09 Journal 12 4 0.20 Journal 13 1 0.17 Journal 13 1 0.09 Journal 13 2 0.24 Journal 14 72 0.19 Journal 14 1 0.10 Journal 14 3 0.24 Journal 15 1 0.22 Journal 15 2 0.11 Journal 15 2 0.24 Journal 16 1 0.22 Journal 16 1 0.11 Journal 16 3 0.26 Journal 17 1 0.24 Journal 17 2 0.13 Journal 17 1 0.27 Journal 18 6 0.26 Journal 18 7 0.14 Journal 18 1 0.30 Journal 19 1 0.30 Journal 19 1 0.17 Journal 19 1 0.30 Journal 20 1 0.30 Journal 20 3 0.19 Journal 20 2 0.31 Journal 21 2 0.30 Journal 21 1 0.23 Journal 21 34 0.31 Journal 22 1 0.34 Journal 22 6 0.30 Journal 22 2 0.38 Journal 23 3 0.37 Journal 23 2 0.34 Journal 23 1 0.41 Journal 24 1 0.41 Journal 24 1 0.38 Journal 24 1 0.43 Journal 25 2 0.42 Journal 25 1 0.47 Journal 25 1 0.49 38 Journal 26 1 0.42 Journal 26 1 0.56 Journal 26 2 0.62 Journal 27 4 0.44 Journal 27 1 0.59 Journal 27 1 0.66 Journal 28 4 0.45 Journal 28 1 0.59 Journal 28 1 0.88 Journal 29 1 0.47 Total 63 0.19 Journal 29 1 0.93 Journal 30 1 0.49 Total 85 0.29 Journal 31 1 0.52 Journal 32 1 0.59 Journal 33 1 0.60 Journal 34 2 0.63 Journal 35 9 0.64 Journal 36 2 0.64 Journal 37 1 0.64 Journal 38 1 0.70 Journal 39 1 0.70 Journal 40 1 0.77 Journal 41 1 0.77 Journal 42 1 0.80 Journal 43 1 0.91 Total 169 0.36 39 Figure 3. Distribution of percentiles for the publications by three re searchers over the years
Original Paper
Loading high-quality paper...
Comments & Academic Discussion
Loading comments...
Leave a Comment