A New Algorithm of Speckle Filtering using Stochastic Distances
This paper presents a new approach for filter design based on stochastic distances and tests between distributions. A window is defined around each pixel, overlapping samples are compared and only those which pass a goodness-of-fit test are used to c…
Authors: Leonardo Torres, Tamer Cavalcante, Alej
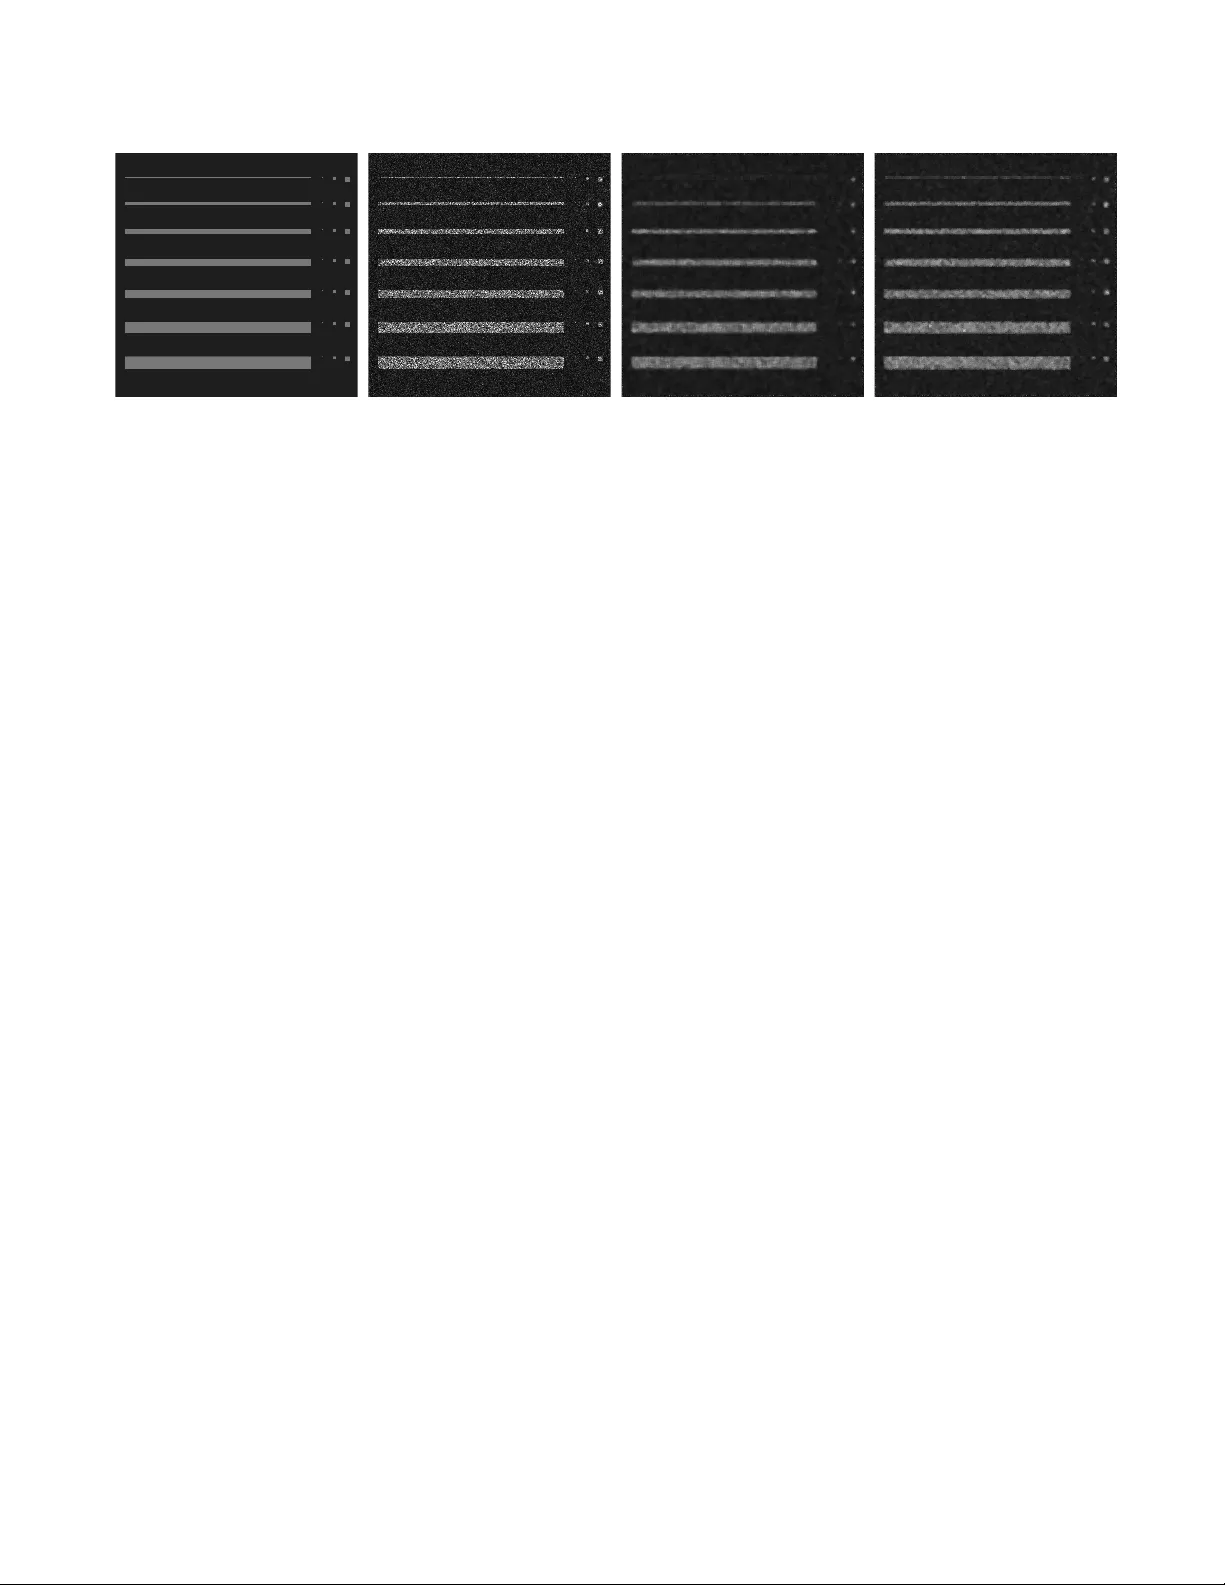
A NEW ALGORITHM OF SPECKLE FIL TERING USING STOCHASTIC DIST ANCES Leonar do T orr es, T amer Cavalcante, Alejandr o C. F rery Uni versidade Federal de Alagoas – UF AL Laborat ´ orio de Computac ¸ ˜ ao Cient ´ ıfica e An ´ alise Num ´ erica – LaCCAN 57072-970, Macei ´ o, AL – Brazil ABSTRA CT This paper presents a ne w approach for filter design based on stochastic distances and tests between distributions. A windo w is defined around each pixel, ov erlapping sam- ples are compared and only those which pass a goodness- of-fit test are used to compute the filtered v alue. The technique is applied to intensity SAR data with homo- geneous regions using the Gamma model. The proposal is compared with the Lee’ s filter using a protocol based on Monte Carlo. Among the criteria used to quantify the quality of filters, we employ the equiv alent number of looks, line and edge preserv ation. Moreover , we also assessed the filters by the Uni versal Image Quality Index and the Pearson’ s correlation on edges regions. Index T erms — SAR data, Speckle Reduction, Sto- chastic Distances, Information Theory 1. INTRODUCTION Synthetic Aperture Radar (SAR) data are generated by a system of coherent illumination and are affected by the interference coherent of the signal. It is known that these data incorporate a granular noise that degrades its quality , kno wn as speckle noise, which is also present in the laser , ultrasound-B, and sonar imagery [ 1 ]. The noise makes the segmentation, e xtraction, analysis and, classification of objects and information in the image hard tasks. Statistical analysis is essential for dealing with spec- kled data. It provides comprehensiv e support for dev elo- ping procedures for interpreting the data ef ficiently , and to simulate plausible images [ 2 ]. In this paper , the mul- tiplicati ve model was used to describe the speckle noise (see Section 2). Dif ferent statistical distributions are proposed in the literature to describe speckle data. In this paper we use the Gamma distribution to describe the speckle noise, and a constant to characterize the ground truth [ 2 ]. The pro- posed filter is a local nonlinear procedure. It is based on stochastic distances between distrib utions, as presented in [3]. The paper is organized as follows: Section 2 presents the statistical modeling used to describe speckle data. Section 3 describes the new method for filtering speckle. Section 4 presents the metrics for assessing the quality of the filtered images. Sections 5 and 6 present the results and conclusions. 2. THE MUL TIPLICA TIVE MODEL According to reference [ 1 ], the multiplicati ve model can be used to describe SAR data. This model asserts that the intensity observed in each pixel is the outcome of the random variable Z : Ω → R + which, in turn, is the product of two independent random v ariables: X : Ω → R + , that characterizes the backscatter; and Y : Ω → R + , which defines the intensity of the speckle noise. The distribution related to the observed intensity Z = X Y is completely specified by the distributions proposed for X and Y . This paper focus is homogeneous regions in intensity images, so the constant X ∼ λ > 0 defines the backs- catter , and Y ∼ Γ( L, L ) models the speckle noise by a Gamma distribution (with expected v alue E ( Y ) = 1 ), where L is equi valent number of looks. Thus, it follows that Z ∼ Γ ( L, L/λ ) and its density is f Z ( z ; L, λ ) = L L λ L Γ( L ) z L − 1 exp n − Lz λ o , (1) L ≥ 1 , z , λ > 0 . 3. STOCHASTIC DIST ANCES FIL TER The proposed filter is local and nonlinear . It is based stochastic distances and tests between distrib utions [ 3 ], obtained from the class of ( h, φ )-di vergences. The pro- posal employs the neighborhoods defined by Nagao and Matsuyama [4]. Each filtered pixel has a 5 × 5 neighborhood, within which nine areas are defined and treated as different sam- ples. Denote b θ 1 the estimated parameter in the central 3 × 3 neighborhood, and b θ 2 , . . . , b θ 9 the estimated pa- rameters in the eight remaining areas. T o account for possible departures from the homogeneous model, we estimate b θ i = ( L i , λ i ) , i = { 1 , . . . , 9 } by maximum likelihood. The proposal is based on the use of stochastic distan- ces on small areas within the filtering windo w . Consider Z 1 and Z i random v ariables defined on the same probabi- lity space, characterized by the densities f Z 1 ( z 1 ; θ 1 ) and f Z i ( z i ; θ i ) , respectively , where θ 1 and θ i are parame- ters. Assuming that both densities hav e the same support I ⊂ R , the ( h, φ )-di vergence between f Z 1 and f Z i is gi ven by D h φ ( Z 1 , Z i ) = h Z x ∈ I φ f Z 1 ( x ; θ 1 ) f Z i ( x ; θ i ) f Z i ( x ; θ i ) d x , (2) where h : (0 , ∞ ) → [0 , ∞ ) is a strictly increasing func- tion with h (0) = 0 and h 0 ( x ) > 0 , φ : (0 , ∞ ) → [0 , ∞ ) is a con vex function for all x ∈ R . Choices of the functi- ons h and φ result in se veral di ver gences. Di vergences sometimes do not obey the requirements to be considered distances. A simple solution, described in [3], is to define a ne w measure d h φ gi ven by d h φ ( b θ 1 , b θ i ) = D h φ ( Z 1 , Z i ) + D h φ ( Z i , Z 1 ) 2 . (3) Distances, in turn, can be con veniently scaled in order to present good statistical properties that make them test statistics [3]: S h φ ( b θ 1 , b θ i ) = 2 mnk m + n d h φ ( b θ 1 , b θ i ) , (4) where b θ 1 e b θ i are maximum likelihood estimators ba- sed on samples size m and n , respecti vely , and k = h 0 (0) φ 00 (1) − 1 . The null hypothesis θ 1 = θ i is rejec- ted at a lev el η , if Pr( S h φ > η ) , and since under mild conditions S h φ is χ 2 M asymptotically distributed, being M the dimension of θ 1 , the test is well defined. Details can be seen in the work by Salicr ´ u et al. [ 5 ]. The statis- tical test deri ved in this paper was the K ullback-Leibler test: S K L = 2 mn m + n b L b λ 2 1 + b λ 2 i 2 b λ 1 b λ i − 1 . (5) The filtering procedure consists in checking which regions can be considered as coming from the same dis- tribution that produced the data which comprises the central block. The sets which are not rejected are used to compute a local mean. If all the sets are rejected, the filtered value is updated with the av erage on the 3 × 3 neighborhood around the filtered pixel. 4. IMA GE QU ALITY ASSESSMENT Image quality assessment in general, and filter perfor- mance ev aluation in particular , are hard tasks [ 6 , 7 ]. Mos- chetti et al [ 6 ] discussed the need of making a Monte Carlo study when assessing the performance of image filters. They proposed a protocol which consists of using a phantom image (see Figure 1(a)) corrupted by speckle noise (see Figure 1(b)). The experiment consists of si- mulating corrupted images as matrices of independent samples of some distrib ution with different parameters. Every simulated image is subjected to filters, and the results are compared (see Figures 1(c) and 1(d)). Among the criteria used to quantify the quality of the filters, we employ the equi v alent number of looks ( NEL ), line pre- serv ation and edge preserv ation. A “good” technique must combat speckle and, at the same time, preserve details as well as rele vant information. W e also assessed the filters by the universal image quality index [ 7 ] and the correlation measure β ρ . The uni versal image quality index is defined by Q = s xy s x s y 2 xy x 2 + y 2 2 s x s y s 2 x + s 2 y , (6) where s 2 • and • denote the sample variance and mean, respecti vely . The range of Q is [ − 1 , 1] , being 1 the best v alue. The quantity β ρ = P n j =1 ( x j − ¯ x )( y j − ¯ y ) q P n j =1 ( x j − ¯ x ) 2 P n j =1 ( y j − ¯ y ) 2 , (7) is a correlation measure is between the Laplacians of images X and Y , where • j and • denote the gradient (a) Phantom (b) Corrupted, 4 -looks (c) Lee filter (d) Kullback-Leibler filter Fig. 1 . Lee’ s Protocol phantom, speckled data and filtered images. v alues of the j th pixel and mean of the images ∇ 2 X and ∇ 2 Y , respecti vely . The range of β ρ is [ − 1 , 1] , being 1 perfect correlation. 5. RESUL TS AND ANAL YSIS The proposal was compared with the Lee filter [ 8 ] which is considered a standard. The tests were performed at the 95% le vel of significance. The results obtained are summarized by means of boxplots (see T able 1). Each boxplot describes the results of one filter, generating 100 independent L = { 1 , 4 } looks images, mean background λ = 30 and mean lines λ = 120 . Figure 2 sho ws the boxplots of the six metrics corresponding to four filters. V ertical ax es are coded by the filter (‘L ’ for Lee and ‘KL ’ for Kullback-Leibler) on looks images (‘ 1 -l’ for 1 -look and ‘ 4 -l’ for 4 -looks). The proposal outperforms the Lee filter with respect to equiv alent number of looks, line preservation, edge gradient, edge v ariance on 4 -looks and universal quality index, while the Lee filter presents better performance with respect to the edge variance on 1 -look and the β ρ factor . In all cases the differences are significati ve. 6. CONCLUSIONS This paper presented a ne w filter based on stochastic distances for speckle noise reduction. The proposal was compared with the classical Lee filter, using a protocol based on Monte Carlo experiences. Moreov er , the β ρ and Q index were used to assert the proposal. The proposed filters behav e alike, and they outperform the Lee filter in fi ve out of six quality measures. Other significance le vels will be tested, along with different points of the parameter space in order to hav e a more complete assessment of the proposal. 7. REFERENCES [1] J. W . Goodman, “Some fundamental properties of speckle, ” J ournal of the Optical Society of America , vol. 66, no. 11, pp. 1145–1150, 1976. [2] G. Gao, “Statistical modeling of SAR images: A Surve y, ” Sensors , v ol. 10, no. 1, pp. 775–795, 2010. [3] A. D. C. Nascimento, R. J. Cintra, and A. C. Frery , “Hypothesis testing in speckled data with stochastic distances, ” IEEE T ransactions on Geoscience and Remote Sensing , vol. 48, no. 1, pp. 373–385, 2010. [4] M. Nagao and T . Matsuyama, “Edge preserving smo- othing, ” Computer Graphics and Imag e Pr ocessing , vol. 9, no. 4, pp. 394–407, 1979. [5] M. Salicr ´ u, D. Morales, M. L. Men ´ endez, and L. Pardo, “On the applications of di vergence type measures in testing statistical hypotheses, ” Journal of Multivariate Analysis , vol. 21, no. 2, pp. 372–391, 1994. [6] E. Moschetti, M. G. Palacio, M. Picco, O. H. Bus- tos, and A. C. Frery , “On the use of Lee’ s protocol for speckle-reducing techniques, ” Latin American Applied Resear ch , vol. 36, no. 2, pp. 115–121, 2006. [7] Z. W ang and A. C. Bovik, “ A universal image quality index, ” IEEE Signal Pr ocessing Letters , vol. 9, no. 3, pp. 81–84, 2002. worse → better 10 15 20 25 L 1−l KL 1−l L 4−l KL 4−l (a) Equi valent Number of Looks ● better ← worse 1.75 1.80 1.85 1.90 L 1−l KL 1−l L 4−l KL 4−l (b) Line Preserv ation ● ● better ← worse 40 50 60 70 80 90 100 L 1−l KL 1−l L 4−l KL 4−l (c) Edge Gradient ● ● better ← worse 0 2 4 6 8 10 L 1−l KL 1−l L 4−l KL 4−l (d) Edge V ariance worse → better 0.16 0.18 0.20 0.22 0.24 L 1−l KL 1−l L 4−l KL 4−l (e) V alues of Q ● ● ● ● worse → better 0.570 0.575 0.580 0.585 0.590 L 1−l KL 1−l L 4−l KL 4−l (f) V alues of β ρ Fig. 2 . Boxplots of six metrics applied to four filters. T able 1 . Statistics from image quality index es. SAR Measures Q index β ρ index Speckle NEL Line Edge Edge ¯ Q s Q ¯ β ρ s β ρ Filter Pres. Grad. V ar . 1 -look Lee 7.673 1.877 80.902 1.438 0.151 0.002 0.586 0.002 KL 9.305 1.831 69.447 4.690 0.206 0.002 0.578 0.003 4 -looks Lee 14.541 1.815 59.415 7.239 0.209 0.001 0.583 0.002 KL 24.442 1.758 47.114 6.83 0.243 0.001 0.575 0.001 [8] J.-S. Lee, “Speckle suppression and analysis for synthetic aperture radar images, ” Optical Enginee- ring , vol. 25, no. 5, pp. 636–645, 1986.
Original Paper
Loading high-quality paper...
Comments & Academic Discussion
Loading comments...
Leave a Comment