Respondent-Driven Sampling in Online Social Networks
Respondent-driven sampling (RDS) is a commonly used method for acquiring data on hidden communities, i.e., those that lack unbiased sampling frames or face social stigmas that make their mem- bers unwilling to identify themselves. Obtaining accurate …
Authors: Christopher M. Homan, Vincent Silenzio, R
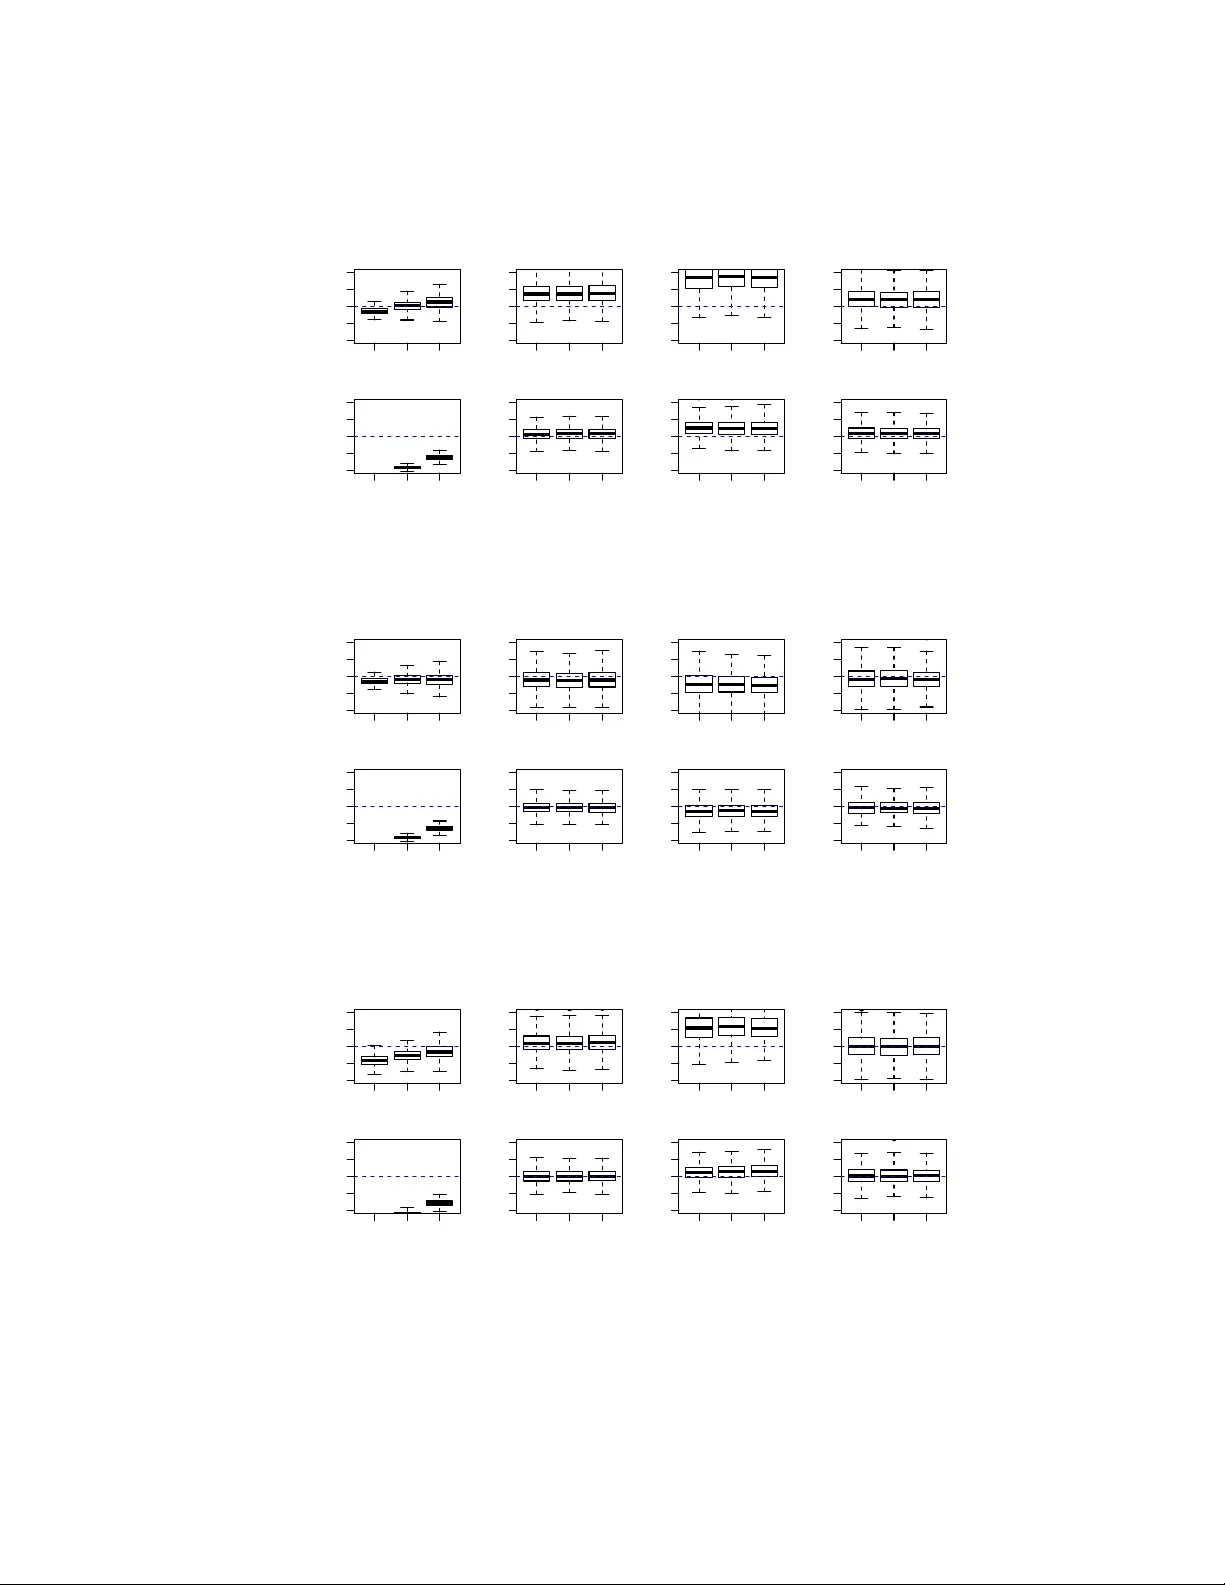
Resp onden t-Driv en Sampling in Online So cial Net w orks ? Christopher M. Homan 1 , Vincen t Silenzio 2 , and Randall Sell 3 1 Ro c hester I nstitute of T ec hnology , Ro chester, NY. Email: cmh@cs.rit.edu 2 Univ ersity of Ro c hester Medical Center, Rochester, NY. Email: vincent silenzio@URMC.Rochester.edu 3 Drexel Universit y , Philadelphia, P A. Email: rls82@drexel.edu Abstract. Resp onden t-driv en sampling (RDS) is a commonly used metho d for acquiring data on hidden communities, i.e., those that lack un biased sampling frames or face so cial stigmas that mak e their mem- b ers un willing to iden tify themselves. Obtaining accurate statistical data ab out such comm unities is imp ortan t b ecause, for instance, they often ha ve different health burdens from the greater population, and without go od statistics it is hard and expensive to effectiv ely reac h them for pre- v ention or treatmen t interv en tions. Online so cial netw orks (OSN) hav e the p oten tial to transform RDS for the b etter. W e present a new RDS recruitmen t proto col for (OSNs) and show via simulation that it out- p erforms the standard RDS proto col in terms of sampling accuracy and approac hes the accuracy of Marko v chain Mon te Carlo random walks. 1 In tro duction Resp onden t-driv en sampling (RDS) [Hec97,SH04,Hec07,VH08,WH08] is a com- monly used metho d to surv ey suc h communities as IV drug users, men who ha ve sex with men, and sex w orkers [MJK + 08]; jazz musicians [HJ01]; unregulated w orkers [BSPar]; native American subcommunities [WS02]; and other hidden comm unities. RDS is a v ariant of sno wball sampling [Tho92] that uses a clev er recruitmen t proto col that: (1) helps ensure the confidentialit y of respondents and the anon ymity of the target com m unit y and (2) generates a relatively large n umber of recruitmen t w av es, which hypothetically leads to unbiased sampling estimators. Unfortunately , in terms of sampling accuracy there is still a large gap b et w een theory and practice [W ej09,GH10,TG11,GS10]. A small bo dy of w ork [SH04,VH08,SH04,Hec07,VH08,WH08], most of which fo cuses on improv- ing the estimators on whic h RDS dep ends, deals with closing that gap. ? This material is based up on work supp orted by the National Science F oundation under Grant No. 1111016, and through Gran t No. K23MH079215 from the National Institute of Mental Health, National Institutes of Health. The final publication is a v ailable at link.springer.com. This pap er describ es a new approach: leveraging the features of online so cial net works (OSNs) to impro v e the sampling design. W e b eliev e OSNs hav e the po- ten tial to dramatically transform RDS b y enabling b etter neighborho o d recall, randomized and confidential recruitment, and other improv ements that allow it to b etter meet the assumptions on which the estimators rest. Here we fo cus on one particular mo dification, which is based on the netw ork that a recruitment proto col generates, i.e., the net work consisting of all resp onden ts as actors and ha ving directed ties b et w een each resp onden t and those whom the resp onden t recruits. The estimators for RDS typically assume that these so-called r e cruit- ment networks are arbitrary , although in practice they are essentially trees. Gile and Handcock sho w [GH10] in simulation that this discrepancy is a ma jor source of the p oor p erformance they observe in established RDS estimators. Our main contribution is a new proto col where the recruitment netw orks are directed acyclic graphs (D AGs). This proto col, while likely infeasible in man y other settings, seems w ell suited for RDS o v er OSNs. Using the same sim ulation- based exp erimen tal framework that Gile and Handco c k [GH10] and T omas and Handco c k [TG11] developed in their rather comprehensiv e assessments of RDS, w e show that this new proto col dramatically outperforms the standard RDS proto col and approaches the sampling accuracy of a Mark ov chain Monte Carlo (MCMC) random w alk (a pro cess that typically satisfies standard RDS sampling assumptions). It ev en outp erforms a recruitment protocol that, sup erficially at least, more closely resem bles MCMC walks than do es ours. Our work is related to that of Gjok a et al. [GKBM11], who use the estab- lished RDS estimators to compare the p erformance of several different metho ds for passiv ely—without the active participation of its users—crawling F aceb ook, including MCMC random walks and breadth-first search. By con trast, we are concerned primarily with metho ds that, due to confidentially concerns, require the active participation of those sampled, and this leads different sampling dy- namics. In another closely related study , W ejnert and Hec k athorn develop a to ol for conducting RDS ov er the W orld-Wide W eb they call W ebRDS [WH08]. Their system explicitly fixes the recruitment graph to be a tree. W e, on the other hand, study what happ ens precisely when we relax this constraint. 2 A Brief Overview of Resp onden t-Driv en Sampling Hec k athorn in tro duced RDS as a sampling protocol paired with an estima- tor [Hec97]. The proto col b egins with a small n umber of seed resp onden ts from the target communit y , who may b e recruited in any fashion. Eac h resp ondent tak es a survey , and is then given a small num ber of recruitment coupons (e.g., three) to distribute among other members of the target comm unit y , each of whic h allo ws whomev er redeems it to take the survey (assuming that he or she meets the inclusion criteria). Each resp onden t is paid for taking the surv ey and for eac h of the redeemed coup ons he or she distributed. The pro cess contin ues until a target num b er of either recruitment wa ves or samples is reached. Thus, RDS uses the so cial netw ork of the hidden p opulation itself to do the work of sub ject iden tification, and in this regard it has b een very successful in finding hidden comm unities. Coup oning ensures the confidentialit y of all those survey ed, whic h is often a crucial concern for the commun ities RDS is designed to reach. Though the recruitment proto col has remained stable, the estimators hav e ev olved significan tly ov er time as questions are raised ab out eac h successive gen- eration of estimators. W e present here what is known as the V olz-Hec k athorn (VH) estimator [VH08]. Although probably not as widely used as an earlier estimator due to Salganik and Hec k athorn [SH04], it is new er and has b een the sub ject of recen t pap ers [GH10,TG11,GKBM11] that exp erimen tally test its p erformance. In particular, Handco c k and Gile show that the VH estimator frequen tly outp erforms the Salganik-Heck athorn estimator [GH10]. The assump- tions underlying the VH estimator are: 1. The net work is connected and ap erio dic. 2. Eac h resp onden t recruits exactly one p erson in to the survey . 3. Eac h resp onden t c ho oses whom to recruit uniformly at random from all net work relationships. 4. All relationships are recipro cal. 5. Resp onden ts are sampled with replacemen t (i.e., may be rerecruited into the surv ey). 6. Resp onden ts can accurately recall the num ber of people in the target com- m unity that they know. It is fairly clear that in practice these assumptions, except p ossibly the first one, never hold. In this pap er, we are particularly interested in assumption 5. In t ypical RDS settings most p eople lac k the time to respond more than once, since doing so often in v olves tra vel, so this assumption fails. Consequen tly , recruitment net works tend to lo ok like trees. It is w orth noting that prior estimators rested on ev en stronger assump- tions [Hec97,SH04]. More recently , Handco c k and Gile [HG10] prop osed newer estimators that dep end on few er assumptions and that seem in their experi- men ts to outp erform earlier estimators [GH11] (see also [Gil11,TG11,GJS12]). Though their approach seems very promising, it is mo del based, and such ap- proac hes themselves dep end on assumptions that can b e difficult or imp ossible to v alidate. Let { y 1 , . . . y n } b e samples of some scalar prop ert y of a netw orked p opula- tion. Let each d i ∈ { d 1 , . . . , d n } b e the degree (n umber of netw ork ties) of the p erson asso ciated with eac h sample. When the VH assumptions do hold, Mark ov c hain Mon te Carlo (MCMC) theory suggests ˆ y = ( P n i =1 y i /d i ) / ( P n i =1 1 /d i ) as an asymptotically un biased estimator for the mean of { y 1 , . . . , y n } . 3 Sim ulation-based exp erimen ts for assessing RDS Gile and Handco c k [GH10] and T omas and Gile [TG11] provide a pair of thor- ough critiques of the VH estimator. W e adopted their metho ds to test our new recruitmen t proto col, so w e present them here in detail. They sim ulate RDS ov er graphs dra wn randomly from an exponential random graph model (ER GM). In eac h experiment, 20% of the net work no des are labeled “infected” and the remaining are “uninfected.” The goal in these exp erimen ts is to estimate the prop ortion of infected no des in the p opulation. Each experiment fixes the ERGM and recruitment parameters, then rep eats the following steps 1000 times: 1. Generate a test graph from the ER GM. 2. Run an RDS simulation on the test graph; stop when 500 samples are made. 3. Estimate the prop ortion of infected no des using VH. The ERGM parameters Gile and Handco c k use are based on a CDC study [A QHM + 06]. Net work size ranges from 525 to 1000. They fix the exp ected degree at sev en. Exp ected activity r atio is the mean degree of the infected no des divided by the mean degree of the uninfected nodes. This ranges from one to three. Exp ected homophily is defined here as the exp ected num be r of relationship b et w een infected actors divided the exp ected num b er of relationships b et ween infected and uninfected actors. This ranges from t wo to thirteen. Seed no des are drawn at random in prop ortion to their neighborho od size, either from all no des, just the infected nodes, or just the non-infected nodes. The n umber of seeds ranges from 4 to 10. F or the recruitmen t parameters, eac h chosen no de recruits exactly t wo new no des uniformly at random from its “eligible” net work neighbors, where “eli- gible” is either all neighbors (for sampling with replacement) or all neighbors who hav e not yet b een sampled (for sampling without replacement). W e call the without-replacement proto col “RDS” and the with-replacement one “REP .” Note that RDS pro duces trees as recruitment netw orks and REP pro duces arbi- trary graphs. 4 A new DA G-based recruitmen t proto col As Gile and Hanco ck show (see also Fig. 1 – 5, whic h repro duce in part their results), the RDS proto col, ev en with p erfect randomness and resp onse in the recruitmen t pro cess, results in significantly degraded p erformance under the VH estimator. But what if sampling with replacement were feasible? It seems plau- sible do to so in an online setting, i.e., where the survey is administered via the W eb: if a resp onden t is recruited a second time, all the resp onden t needs to do is log in to the website where the surv ey is administered and the system can auto- matically count the respondent’s survey a second time (and send the resp onden t additional electronic recruiting coup ons) without requiring the resp onden t to return to a ph ysical p olling site. The trickier part is in the recruitment dynamics. If w e let respondents rere- cruit freely , as in the REP proto col, then, in order to gain more money from surv ey incentiv es, they could collude to rerecruit eac h other many more times than chance would predict, th us sk ewing the results. W e prop ose to discourage this b eha vior by allowing resp onden ts to b e rerecruited only if doing so does not result in the recruitment graph containing a directed cycle. The resulting recruitmen t graph is th us a directed acyclic graph. W e call this protocol “DA G.” 5 Exp erimen ts and Results W e use the same methods as Gile and Handcock, as we describ ed in section 3. The ma jor difference is that we consider t wo additional v arian ts of the RDS proto col: “MCMC,” in which each resp onden t recruits only one p erson (with replacemen t), chosen from that p erson’s friend list uniformly at random, i.e., it is a Mark ov chain Monte Carlo random walk and serv es as a con trol case; and “D AG,” as describ ed in Sect. 4. Figures 1 – 5 sho w some of our results. Here w e run a series of tests, analogous to those Gile and Handco c k [GH10]. All tests shown used a seed size of six. The first three figures sho w the effects of drawing seeds from the entire p opulation, just the infected p opulation, and just the uninfected p opulation, resp ectiv ely . T ogether, they sho w the effects of recruitment bias on the p erformance of the estimators. Additionally , we consider burn-in , a feature of most MCMC-based sampling in which a fraction of the earliest samples are dropp ed, because they more hea vily dep end on the seeds—and are thus more biased—than the later samples, whic h are ideally indep enden t of the seeds. The last tw o figures show the effects of recruitmen t bias after a burn-in of the first 100 samples. The parameters considered within each figure are the netw ork sizes 1000, 715, and 525 and the activit y ratios (lab eled “w”) 1.1 and 3. ● ● ● ● ● ● ● ● ● ● ● ● ● ● ● ● ● 525 715 1000 0.10 0.20 0.30 w = 1.1 RDS ● ● ● ● ● ● ● ● ● ● ● ● ● ● ● ● ● ● ● 525 715 1000 0.10 0.20 0.30 w = 3 ● ● ● ● ● ● ● ● ● ● ● ● ● ● ● ● ● ● ● ● ● ● ● ● ● ● ● 525 715 1000 0.10 0.20 0.30 D AG ● ● ● ● ● ● ● ● ● ● ● ● ● ● ● ● ● ● ● ● ● ● ● ● ● ● ● ● ● ● ● ● ● ● ● ● 525 715 1000 0.10 0.20 0.30 ● ● ● ● ● ● ● ● ● ● ● ● ● ● ● ● ● ● ● ● ● ● ● ● ● ● ● 525 715 1000 0.10 0.20 0.30 REP ● ● ● ● ● ● ● ● ● ● ● ● ● ● ● ● ● ● ● ● ● ● ● ● ● ● ● ● ● ● ● ● ● ● 525 715 1000 0.10 0.20 0.30 ● ● ● ● ● ● ● ● ● ● ● ● ● ● 525 715 1000 0.10 0.20 0.30 MCMC ● ● ● ● ● ● ● ● ● ● ● ● ● ● ● ● ● ● ● ● ● 525 715 1000 0.10 0.20 0.30 Fig. 1. Estimated size of infected population where seeds are dra wn from the entire p opulation with no burn-in. ● ● ● ● ● ● ● ● ● ● ● ● ● ● ● ● ● ● ● ● 525 715 1000 0.10 0.20 0.30 w = 1.1 RDS ● ● ● ● ● ● ● ● ● ● ● ● ● ● ● ● ● ● ● ● ● ● 525 715 1000 0.10 0.20 0.30 w = 3 ● ● ● ● ● ● ● ● ● ● ● ● ● ● ● ● ● ● ● ● ● ● ● ● ● ● ● ● ● ● ● ● 525 715 1000 0.10 0.20 0.30 D AG ● ● ● ● ● ● ● ● ● ● ● ● ● ● ● ● ● ● ● ● ● 525 715 1000 0.10 0.20 0.30 ● 525 715 1000 0.10 0.20 0.30 REP ● ● ● ● ● ● ● ● ● ● ● ● ● ● ● ● ● ● ● ● ● 525 715 1000 0.10 0.20 0.30 ● ● ● ● ● ● ● ● ● ● ● ● ● ● ● ● ● ● ● ● ● ● ● ● ● ● ● 525 715 1000 0.10 0.20 0.30 MCMC ● ● ● ● ● ● ● ● ● ● ● ● ● ● ● ● ● ● ● ● ● ● ● ● ● ● ● ● 525 715 1000 0.10 0.20 0.30 Fig. 2. Estimated size of infected p opulation where seeds are dra wn from the infected p opulation only with no burn-in. ● ● ● ● ● ● ● ● ● ● ● ● ● ● ● ● ● ● ● ● ● ● ● 525 715 1000 0.10 0.20 0.30 w = 1.1 RDS ● ● ● ● ● ● ● ● ● ● ● ● ● ● ● ● ● ● ● ● ● ● ● ● ● ● 525 715 1000 0.10 0.20 0.30 w = 3 ● ● ● ● ● ● ● ● ● ● ● ● ● ● ● ● ● ● ● 525 715 1000 0.10 0.20 0.30 D AG ● ● ● ● ● ● ● ● ● ● ● ● ● ● ● ● ● ● ● ● ● ● ● ● ● ● ● ● ● ● ● ● ● ● ● ● ● ● ● ● ● 525 715 1000 0.10 0.20 0.30 ● ● ● ● ● ● ● ● ● ● ● ● ● ● ● ● ● ● ● ● ● ● ● ● ● ● ● ● ● ● ● 525 715 1000 0.10 0.20 0.30 REP ● ● ● ● ● ● ● ● ● ● ● ● ● ● ● ● ● ● ● ● ● ● ● ● ● ● ● ● ● ● ● ● ● ● ● ● ● ● ● ● ● ● ● 525 715 1000 0.10 0.20 0.30 ● ● ● ● ● ● ● ● ● ● ● ● ● ● ● ● ● ● ● ● ● ● ● ● ● 525 715 1000 0.10 0.20 0.30 MCMC ● ● ● ● ● ● ● ● ● ● ● ● ● ● ● ● ● ● ● ● ● ● ● ● ● ● ● ● ● ● ● ● ● ● ● ● 525 715 1000 0.10 0.20 0.30 Fig. 3. Estimated size of infected p opulation where seeds are drawn from the nonin- fected p opulation only with no burn-in. ● ● ● ● ● ● ● ● ● ● ● ● ● 525 715 1000 0.10 0.20 0.30 w = 1.1 RDS ● ● ● ● ● ● ● ● ● ● ● ● ● ● ● ● ● ● 525 715 1000 0.10 0.20 0.30 w = 3 ● ● ● ● ● ● ● ● ● ● ● ● ● ● ● ● ● ● ● ● ● ● ● ● ● ● ● ● ● ● ● ● ● ● 525 715 1000 0.10 0.20 0.30 D AG ● ● ● ● ● ● ● ● ● ● ● ● ● ● ● ● ● ● ● ● ● 525 715 1000 0.10 0.20 0.30 ● ● ● ● ● ● ● ● ● ● ● ● ● ● ● ● ● ● ● ● ● 525 715 1000 0.10 0.20 0.30 REP ● ● ● ● ● ● ● ● ● ● ● ● ● ● ● ● ● 525 715 1000 0.10 0.20 0.30 ● ● ● ● ● ● ● ● ● ● ● ● ● ● ● ● ● 525 715 1000 0.10 0.20 0.30 MCMC ● ● ● ● ● ● ● ● ● ● ● ● ● ● ● ● ● ● ● ● ● ● ● ● ● ● ● ● ● 525 715 1000 0.10 0.20 0.30 Fig. 4. Estimated size of infected p opulation where seeds are dra wn from the infected p opulation only with the first 100 no des of eac h sample are discarded as “burn-in.” ● ● ● ● ● ● ● ● ● ● ● ● 525 715 1000 0.10 0.20 0.30 w = 1.1 RDS ● ● ● ● ● ● ● ● ● ● ● ● ● ● ● ● ● ● ● ● ● ● ● 525 715 1000 0.10 0.20 0.30 w = 3 ● ● ● ● ● ● ● ● ● ● ● ● ● ● ● ● ● ● ● ● ● 525 715 1000 0.10 0.20 0.30 D AG ● ● ● ● ● ● ● ● ● ● ● ● ● ● ● ● ● ● ● ● ● ● ● 525 715 1000 0.10 0.20 0.30 ● ● ● ● ● ● ● ● ● ● ● ● ● ● ● ● ● ● ● ● ● ● ● ● ● ● ● ● ● ● ● ● ● ● 525 715 1000 0.10 0.20 0.30 REP ● ● ● ● ● ● ● ● ● ● ● ● ● ● ● ● ● ● ● ● ● ● ● 525 715 1000 0.10 0.20 0.30 ● ● ● ● ● ● ● ● ● ● ● ● ● ● ● ● ● ● ● ● ● ● ● ● ● ● 525 715 1000 0.10 0.20 0.30 MCMC ● ● ● ● ● ● ● ● ● ● ● ● ● ● ● ● ● ● ● ● ● ● ● ● ● 525 715 1000 0.10 0.20 0.30 Fig. 5. Estimated size of infected p opulation where seeds are drawn from the non- infected population only with the first 100 no des of eac h sample are discarded as “burn-in.” 6 Discussion and Conclusion The results for RDS and REP essentially replicate for comparison purposes those of Gile and Handco ck. One reason RDS p erformance degrades so dramatically as netw ork size decreases is that the probability that any node is sampled ap- proac hes one as the netw ork size decreases, but the VH estimator still weighs eac h sample as if it had b een chosen in prop ortion to its netw ork neighborho od. Of all the proto cols we test, MCMC p erforms b est, which is what we would exp ect as it represen ts RDS in the impractical case when all the VH assumptions hold. Surprisingly to us, D AG was clearly second best, outp erforming ev en REP , the protocol whic h seemed to us to be the most lik e MCMC (note that b oth REP and MCMC pro duce arbitrary recruitment netw orks). The only test in whic h D AG did not p erform at a level comparable to MCMC was when all seed no des w ere dra wn from the infected p opulation and the activit y ratio was low, though a 100 no de burn-in almost corrects this. W e are inv estigating wh y D A G performs as well as it has. Space preven ts us from giving details, but we ha ve seen that the recruitment graphs created by DA G hav e clustering co efficien ts and av erage path lengths that are closer than the other proto cols to MCMC. W e hop e that this study shows that creative thinking ab out ho w RDS is implemen ted in OSNs may lead to significan t im pro v ements in its sampling ac- curacy . W e hav e ideas ab out ho w h uman-computer inferace metho ds on OSNs can improv e neighborho od size recall and the randomness of the recruitment pro cess, neither of which w e ha ve space to discuss here. Additional open issues remain, such as the inheren t biases of OSNs and the degree of realism that the ER GM mo dels used here and in related w ork provide. In future work w e plan to conduct field studies of these issues and others, using an actual implementation of RDS o ver F aceb ook. References A QHM + 06. A.S. Ab dul-Quader, D.D. Heck athorn, C. McKnight, H. Bramson, C. Nemeth, K. Sabin, K. Gallagher, and D.C. Des Jarlais. Effectiv eness of resp onden t-driv en sampling for recruiting drug users in New York Cit y: findings from a pilot study . Journal of Urb an He alth , 83(3):459–476, 2006. BSP ar. A. Bernhardt, M. Spiller, and D. Polson. All work and no pay: Violations of employmen t and lab or laws in Chicago, Los Angeles and New York Cit y . So cial F or c es , to app ear. GH10. K. Gile and M. Handco c k. Respondent-driv en sampling: an assessment of curren t metho dology . So ciolo gic al Metho dolo gy , 40(1):285–327, August 2010. GH11. K.J. Gile and M.S. Handco ck. Net work mo del-assisted inference from resp onden t-driv en sampling data. arXiv pr eprint arXiv:1108.0298 , 2011. Gil11. K.J. Gile. Impro ved inference for resp onden t-driven sampling data with application to HIV prev alence estimation. Journal of the A meric an Sta- tistic al Association , 106(493):135–146, 2011. GJS12. K.J. Gile, L.G. Johnston, and M.J. Salganik. Diagnostics for resp onden t- driv en sampling. arXiv pr eprint arXiv:1209.6254 , 2012. GKBM11. M. Gjok a, M. Kuran t, C. Butts, and A. Mark op oulou. A walk in facebo ok: Uniform sampling of users in online so cial netw orks. T echnical Rep ort 0906.0060v4, arXiv, F ebruary 2011. GS10. Sharad Go el and Matthew J Salganik. Assessing resp onden t-driven sam- pling. Pr o c e edings of the National A c ademy of Scienc es of the Unite d States of Americ a , 107(1515):6743–6747, 2010. Hec97. D. Hec k athorn. Resp onden t-driven sampling: A new approac h to the study of hidden p opulations. So cial Pr oblems , 44(2):174–199, May 1997. Hec07. D. Hec k athorn. Extensions of resp onden t-driven sampling: Analyzing con- tin uous v ariables and controlling for differential recruitment. So ciolo gic al Metho dolo gy , 37(1):151–207, December 2007. in press. HG10. M.S. Handco ck and K.J. Gile. Mo deling so cial netw orks from sampled data. The Annals of Applie d Statistics , 4(1):5–25, 2010. HJ01. D. Heck athorn and J. Jeffri. Finding the b eat: Using resp onden t-driven sampling to study jazz musicians. Po etics , 28(4):307–329, 2001. MJK + 08. M. Malekinejad, L.G. Johnston, C. Kendall, L.R.F.S. Kerr, M.R. Rifkin, and G.W. Rutherford. Using resp onden t-driven sampling metho dology for HIV biological and b eha vioral surveillance in international settings: a systematic review. AIDS and Behavior , 12:105–130, 2008. SH04. M.J. Salganik and D.D. Heck athorn. Sampling and estimation in hidden p opulations using resp onden t-driven sampling. So ciolo gic al metho dolo gy , 34(1):193–240, 2004. TG11. A. T omas and K.J. Gile. The effect of differential recruitment, non- resp onse and non-recruitmen t on estimators for resp onden t-driven sam- pling. Ele ctr onic Journal of Statistics , 5:899–934, 2011. Tho92. S. Thompson. Sampling . John Wiley & Sons, New Y ork NY, 1992. VH08. E. V olz and D. Heck athorn. Probabilit y based estimation theory for resp onden t driven sampling. Journal of Official Statistics , 24(1):79–97, 2008. W ej09. C W ejnert. An empirical test of respondent-driv en sampling: Poin t esti- mates, v ariance, degree measures, and out-of-equilibrium data. So ciolo gi- c al Methodolo gy , 39(1):73–116, August 2009. WH08. C. W ejnert and D. Heck athorn. W eb-based net work sampling: Efficiency and efficacy of resp onden t-driven sampling for online research. So ciolo gic al Metho ds & R ese ar ch , 37(1):105–134, June 2008. WS02. K. W alters and J. Simoni. Health surv ey of tw o-spirited nativ e americans, 2002.
Original Paper
Loading high-quality paper...
Comments & Academic Discussion
Loading comments...
Leave a Comment