Sliced Inverse Moment Regression Using Weighted Chi-Squared Tests for Dimension Reduction
We propose a new method for dimension reduction in regression using the first two inverse moments. We develop corresponding weighted chi-squared tests for the dimension of the regression. The proposed method considers linear combinations of Sliced In…
Authors: Zhishen Ye, Jie Yang
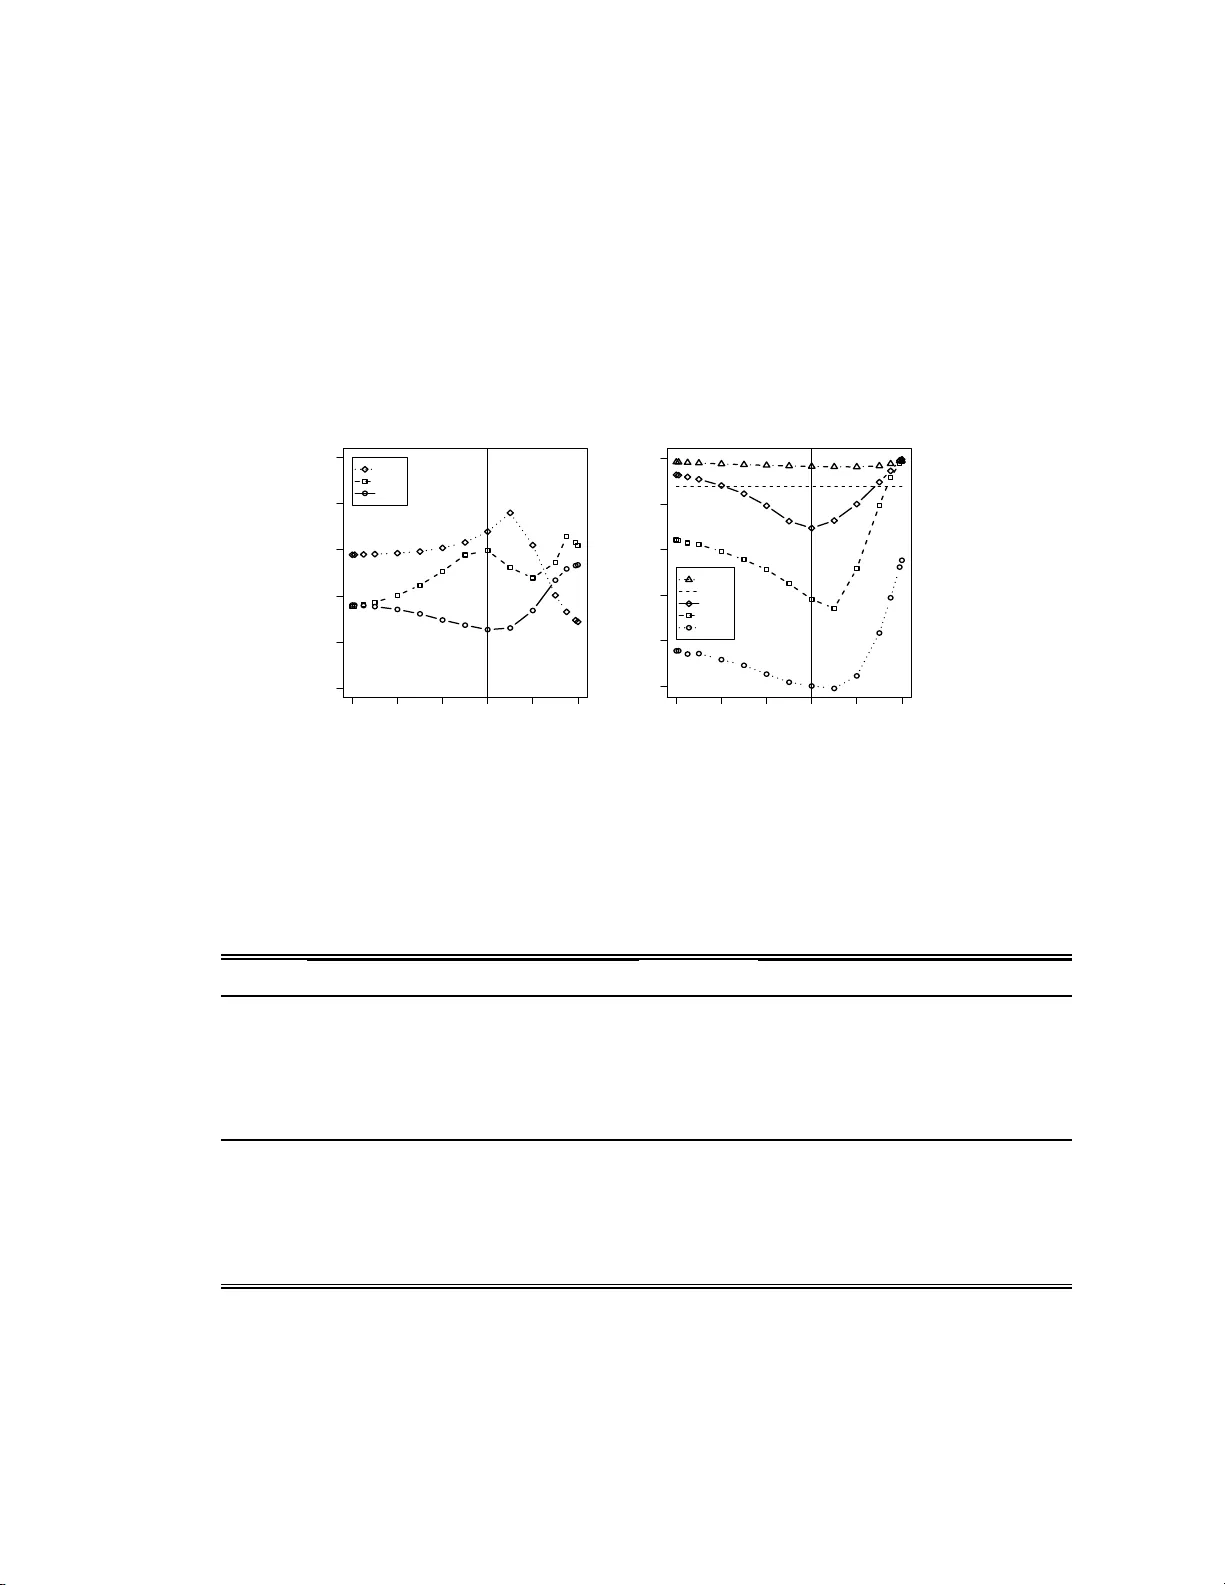
Sliced In v erse Momen t Regress ion Using W eigh ted Chi-Squared T ests for Dimension Reduction Zhishen Y e a , Jie Y ang b,1, ∗ a Amgen Inc., Thousand Oaks, CA 91320-1799 , U SA b Dep artment of Mathematics, S tatistics, and Computer Scienc e, University of Il linois at Chic ago , Chic ago , IL 60607-704 5, USA Abstract W e prop ose a new m etho d for d imension reduction in regression using the first t w o in v erse moments. W e dev elop corresp onding w eighted c hi-squared tests for the dimension of the regression. The prop osed metho d considers linear combinations of Sliced In v erse Regression (SIR) and the metho d using a new candidate matrix whic h is designed to recov er the en tire inv erse second momen t subspace. The optimal combination ma y b e selected ba sed on the p- v alues de rived from the dimension tests. Theoretically , the prop o sed method, as we ll as Sliced Av erage V ariance Estimate (SA VE), are more capable of reco v ering the complete cen tra l dimension reduction subspace than SIR and Principle Hessian Directions (pHd). Therefore it can subs titute for SIR, pHd, SA VE, or any linear com bination of them at a theoretical lev el. Sim ulation study indicates that the prop osed metho d ma y ha v e consisten tly greater ∗ Corresp o nding author at: Department of Mathematics, Statistics, and Co mputer Sci- ence (MC 2 4 9), University of Illinois at Chicago , 851 So uth Morg an Street, SEO 322, Chicago, Illino is 606 07, USA. T el.:+131241 3 3748 ; fax:+13129 9614 9 1. E - mail addre s s: jyang06@math.uic.edu (J. Y ang). 1 The authors thank Robert W eiss for commen ts on an earlier draft. They ar e also very grateful to Bing Li and Shaoli W ang for sharing their co mputer progra m. Pr eprint submitte d to Elsevier August 26, 2021 p o wer than SIR, pHd, and SA VE. Keywor ds: Dimension reduction in regression, pHd, SA VE, SIMR, SIR, W eighted chi-squared test 1. Introduction The purp ose of the regress ion of a univ a r ia te resp onse y on a p - dimensional predictor v ector x is to mak e inference on the conditio nal distribution o f y | x . F ollo wing Co ok (1998b), x can b e replaced b y its standardized v ersion z = [Σ x ] − 1 / 2 ( x − µ x ) , (1) where µ x and Σ x denote the mean and co v ariance matrix of x respectiv ely assuming non-singularit y of Σ x . The goal of dim ension r e duction in r e gr ession is to find out a p × d mat rix γ suc h that y z | γ ′ z , (2) where “ ” indicates indep endence. Then the p -dimensional z can b e re- placed b y the d -dimensional v ector γ ′ z without sp ecifying any pa rametric mo del and without losing an y informat ion on predicting y . The column space Span { γ } is called a dimension r e duction subsp ac e . The smallest applicable d is called the dimensio n of the r e gr ession . Based on the inv erse mean E( z | y ), Li (19 91a) pro p osed Sliced Inv erse Re- gression (SIR) f o r dimension reduction in regression. It is realized tha t SIR can not reco ver the symmetric dep endency (Li, 1991b; Coo k and W eisb erg, 1991). Aft er SIR, man y dimension reduction metho ds ha v e b een intro duced. 2 Sliced Average V ariance Estimate (SA VE) prop osed b y Co ok and W eisberg (1991) and Principle Hessian Directions (pHd) prop osed b y Li (1 992) are another tw o p o pular ones. Both pHd and SA VE refer to the second in- v erse momen t, cen tered or non-cente red. Compared with SA VE, pHd can not detect certain dep endency hidden in the second moment (Yin and Co ok , 2002; Y e and W eiss, 2003) a nd the linear dep endency (Li, 1992; Co ok, 199 8 a). Among those dimension reduction methods using only the fir st t w o inv erse momen ts, SA VE seems to b e the preferred one. Nev ertheless, SA VE is not alw ay s the winner. F or example, Y e and W eiss (2003) implied that a lin- ear com binatio n of SIR and pHd ma y p erfo rm b etter than SA VE in some cases. It is not surprising since Li (1991b) already suggested that a suitable com bination o f t w o different metho ds migh t sharpen the dimension reduc- tion results. Y e and W eiss (2003) further prop osed that a b o ot stra p metho d could b e used to pic k up the “b est” linear com bination of tw o known meth- o ds, as w ell as the dimension of the regression, in the sense of the v ariabilit y of the estimators, although lo w er v ariabilit y under the b o otstrap pro cedure do es not necessarily lead to a b etter estimator. Li and W ang (200 7) p ointed out tha t linear combinations o f tw o known metho ds selected by the b o otstrap criterion ma y not p erform as w ell as a single new metho d, their Directional Regression metho d (D R), ev en tho ug h the b o otstrap one is computationally in tensiv e. This article aims to dev elop a new class of, instead of a single one, di- mension reduction metho ds using only the first t w o in ve rse moments , as w ell as the cor r espo nding large sample tests for t he dimension of the regress ion and an efficien t criterion for selecting a suitable candidate from the class. 3 Theoretically , it can co v er SIR, pHd, SA VE and their linear com binations. Practically , it can ac hieve higher p o we r in reco v ering the dimension reduction subspace. In Section 2, w e review the necessary dimension reduction con text. In Section 3, w e introduce a simple candidate matrix M zz ′ | y whic h targets the en tire in v erse second momen t subspace. It is indeed the candidate matrix o f an in termediate metho d b et w een pHd a nd SA VE. In Section 4, w e prop ose a new class of dimension r eduction metho ds called Sliced In v erse Moment Regression (SIMR), along with w eigh ted c hi-squared tests for the dimension of the regress ion. In Section 5, we use SIMR to analyze a sim ulated exam- ple and illustrate ho w to select a g o o d candidate of SIMR. Sim ulation study sho ws that SIMR may ha ve consisten tly greater p o w er than SIR, pHd, and SA VE, as well as DR and another new metho d In v erse Regression Estimator (Co ok and Ni, 2005). In Section 6, a real example is used to illustrate how the prop o sed metho d works . It is implied that a class of dimension reduc- tion metho ds, along with a suitable criterion for c ho osing a g o o d one among them, may b e preferable in practice to any single metho d. W e conclude this article with discussion and pro ofs of the results presen ted. 2. Dimension Reduction Con text 2.1. Centr al Dimens i o n R e duction Subsp ac e (CDRS) Co ok (1994b, 1996) in tro duced the notion of c entr al dimensio n r e duction subsp ac e (CDRS), denoted by S y | z , whic h is the in tersection of all dimension reduction subspace s. Under fairly w eak restrictions, t he CDRS S y | z is still a dimension reduction subspace. 4 In this article, w e alwa ys assume that S y | z is a dimension reduction sub- space and that the columns of γ is a n orthonormal basis of S y | z . In practice, w e usually first transform the orig inal data { x i } in to their standardized v er- sion { z i } b y replacing Σ x and µ x in (1) with their usual sample estimates ˆ Σ x and ˆ µ x . Then we can estimate S y | x b y ˆ S y | x = [ ˆ Σ x ] − 1 / 2 ˆ S y | z , where ˆ S y | z is an estimate of S y | z . Therefore, the goal of dimension reduction in regression is to find out the dimension of the regress io n d and t he CDRS S y | z = Span { γ } . F ollo wing Li (1991a) and Co ok (19 9 8b), w e also assume: (1) E ( z | γ ′ z ) = P γ z , where P γ = γ γ ′ , kno wn as the line arity c ondition ; ( 2) V ar( z | γ ′ z ) = Q γ , where Q γ = I − P γ , kno wn as the c onstant c ovaria nc e c ondition . These tw o conditions hold if z is normally distributed, although the nor ma lity is not necessary . 2.2. Candidate Matrix Y e and W eiss (2003) intro duced the concept of c andidate matrix , whic h is a p × p matrix A satisfying A = P γ AP γ . They show ed that any eigen vec to r corresp onding to an y nonzero eigenv alue of A b elongs to the CDRS Span { γ } . Besides, the set of all candidate matrices, denoted b y M , is closed under scalar m ultiplication, transp ose, addition, multiplic at ion, and th us under linear com bination and exp ectation. They also sho w ed that the matrices [ µ 1 ( y ) µ 1 ( y ) ′ ] and [ µ 2 ( y ) − I] b elong to M fo r all y , where µ 1 ( y ) = E( z | y ) and µ 2 ( y ) = E( zz ′ | y ). They pro ve d that the symme tr ic matrices that SIR, SA VE, and y -pHd estimate all b elong 5 to M : M SIR = V ar ( E( z | y )) = E[ µ 1 ( y ) µ 1 ( y ) ′ ] , M SA VE = E[( I − V ar( z | y )) 2 ] = E([ µ 1 ( y ) µ 1 ( y ) ′ ] 2 + [ µ 2 ( y ) − I] 2 − [ µ 1 ( y ) µ 1 ( y ) ′ ][ µ 2 ( y ) − I] − [ µ 2 ( y ) − I][ µ 1 ( y ) µ 1 ( y ) ′ ]) , M y − pHd = E[( y − E( y )) zz ′ ] = E[ y ( µ 2 ( y ) − I)] . 3. Candidate Matr ix M zz ′ | y 3.1. A Si m ple Candi d a te Matrix The matrices [ µ 1 ( y ) µ 1 ( y ) ′ ] and [ µ 2 ( y ) − I] are actually t w o fundamen tal comp onen ts of M SIR , M SA VE , and M y − pHd (see Section 2.2). M SIR only in- v olv es the first comp onent [ µ 1 ( y ) µ 1 ( y ) ′ ], while b oth M SA VE and M y − pHd share the second comp onen t [ µ 2 ( y ) − I]. Realizing tha t this common f eat ur e ma y lead to the connection b et we en SA VE and pHd, we inv estigate the b eha vior of t he mat rix [ µ 2 ( y ) − I]. T o av o id the incon v enience due to E([ µ 2 ( y ) − I]) = 0, w e define M zz ′ | y = E([E( zz ′ − I | y )] 2 ) = E([ µ 2 ( y ) − I] 2 ) . Note that M zz ′ | y tak es a simpler form than the rescaled v ersion of sirII (Li, 1991b, Remark R .3 ) while still k eeping the t heoretical comprehensiv eness. It also app ears as a comp o nen t in one expression of the dir e ctiona l r e gr ession matrix G (Li a nd W ang, 2007, eq.(4)). W e choose its for m as simple as p ossible for less complicated large sample test and potentially greater test p o wer. T o establish the relationship b et wee n M y − pHd and M zz ′ | y , we need: 6 Lemma 1. L et M b e a p × q r andom matrix define d on a pr ob ability sp ac e (Ω , F , P ) , then ther e exists an event Ω 0 ∈ F with pr ob ability 1 , such that, Span { E ( M M ′ ) } = Span { M ( ω ) , ω ∈ Ω 0 } . A similar result can also b e found in Yin and Co ok ( 2 003, Prop osition 2 ( i)). The lemma here is more general. By the definition o f M zz ′ | y , Corollary 1. Span { M zz ′ | y } = Span { [ µ 2 ( y ) − I] , y ∈ Ω( y ) } , wher e Ω( y ) is the supp ort of y . Based on Corollary 1, Y e and W eiss (2003, Lemma 3 ), and the fact that [ µ 2 ( y ) − I] ∈ M for all y , matrix M zz ′ | y is in fact a candidate matrix to o. Corollary 1 a lso implies a strong connection b et w een M y − pHd and M zz ′ | y : Corollary 2. Span { M y − pHd } ⊆ Span { M zz ′ | y } . T o further understand the r elat io nship b et w een M y − pHd and M zz ′ | y , recall the c entr al k -th mome nt dimensio n r e duction subsp ac e (Yin and Co ok, 200 3), S ( k ) y | z = Span { η ( k ) } . The cor r espo nding random v ector ( η ( k ) ) ′ z con tains all the a v ailable information ab out y fr o m t he first k conditional moments of y | z . In other w or ds, y { E( y | z ) , . . . , E( y k | z ) } ( η ( k ) ) ′ z . Similar to Span { E( y z ) , . . . , E( y k z ) } = Span { E( y µ 1 ( y )) , . . . , E( y k µ 1 ( y )) } ⊆ S ( k ) y | z ⊆ S y | z , the subspace Span { E( y [ µ 2 ( y ) − I]) , . . . , E( y k [ µ 2 ( y ) − I]) } is also contained in S ( k ) y | z . P arallel t o Yin and Co ok (2002, Prop osition 4), the result on M zz ′ | y is: 7 Prop osition 1. (a) If y has finite supp ort Ω( y ) = { a 0 , . . . , a k } , then Span { M zz ′ | y } = Span { E[ y i ( µ 2 ( y ) − I)] , i = 1 , . . . , k } . (b) If y is c o n tinuous and µ 2 ( y ) is c on tinuous on y ’s supp ort Ω( y ) , then Span { M zz ′ | y } = Span { E[ y i ( µ 2 ( y ) − I)] , i = 1 , 2 , . . . } . According to Prop osition 1 and Yin and Co ok (200 2, Prop o sition 4), the relationship b et w een E[ y ( µ 2 ( y ) − I)] = M y − pHd and M zz ′ | y is fairly comparable with the relationship b et w een E( y µ 1 ( y )) = E( y z ) and M SIR . Bot h E( y z ) and M y − pHd actually target the central mean (first moment) dimension reduction subspace (Co o k and Li, 2002), while M SIR and M zz ′ | y target the cen tral k - th momen t dimension reduction subspace giv en any k , or equiv alently the CDRS S y | z as k g o es to infinite. In order to understand the similarity from another p ersp ectiv e, recall the inverse me an subsp ac e of S y | z (Yin and Co o k , 2002): S E( z | y ) = Span { E( z | y ) , y ∈ Ω( y ) } . Similarly , w e define the inverse se c ond moment subsp ac e of S y | z : Span { E( zz ′ | y ) − I , y ∈ Ω( y ) } . By definition, matrices M SIR and M zz ′ | y are designed to reco v er t he en tire in v erse mean subspace and the entire in v erse second momen t subspace re- sp ectiv ely , while E( y z ) and M y − pHd are only able to reco v er p ortions of those subspaces. W e are therefore in terested in combining matrices M SIR and M zz ′ | y b ecause they a r e b o th comprehensiv e. 8 3.2. SA VE versus SIR and pHd Y e and W eiss (2003) show ed that Span { M SIR } ⊆ Span { M SA VE } , (3) W e then pro ve further the followin g pro p osition: Prop osition 2. Span { M SA VE } = Span { M SIR } + Span { M zz ′ | y } . A straightforw ard result follow ing Prop osition 2 and Corollary 2 is: Corollary 3. Span { M y − pHd } , Span { M SIR } , Span { M zz ′ | y } ⊆ Span { M SA VE } . Corollary 3 explains wh y SA VE is able to provide b etter estimates of the CDRS tha n SIR and y -pHd in many cases. 4. Sliced In verse Moment Regression Using W eighted Chi-Squared T ests 4.1. Slic e d Inverse Moment R e gr ession In order to simplify the candidate matrices using the first t wo in v erse momen ts and still k eep the comprehensiv eness of SA VE, a natural idea is to com bine M zz ′ | y with M SIR as follo ws: αM SIR + ( 1 − α ) M zz ′ | y = E( α [ µ 1 ( y ) µ 1 ( y ) ′ ] + (1 − α )[ µ 2 ( y ) − I] 2 ) , where α ∈ (0 , 1). W e call this matrix M ( α ) SIMR and the corresp onding dimen- sion reduction metho d Slic e d Inverse Moment R e gr ession (SIMR or SIMR α ). Note that the com bination here is simpler than the SIR α metho d (Li, 1 9 91b; Gannoun and Sa racco, 2003) while retaining the least requiremen t on com- prehensiv eness . Actually , for an y α ∈ (0 , 1), SIMR α is as comprehensiv e as SA VE at a theoretical leve l based on the follow ing prop osition: 9 Prop osition 3. Span { M ( α ) SIMR } = Span { M SA VE } , ∀ α ∈ (0 , 1) . Com bined with Corollary 3, w e kno w that any linear com bination of SIR, pHd and SA VE can b e co v ered b y SIMR α : Corollary 4. Span { aM SIR + bM y − pHd + cM SA VE } ⊆ Span { M ( α ) SIMR } , whe r e a, b , and c ar e a rbitr ary r e al numb ers. Note that the w ay o f constructing SIMR α mak es it easier to dev elop a corre- sp onding la rge sample test fo r the dimension of t he regression ( Section 4.3). F rom no w on, we assume that the data { ( y i , x i ) } i =1 ,...,n are i.i.d. from a p opulation whic h has finite first four moments and conditional momen t s. 4.2. Algorithm for SI MR α Giv en i.i.d. sample ( y 1 , x 1 ),...,( y n , x n ), first standardize x i in to ˆ z i , sort the data b y y , and divide the data in to H slices with in traslice sample sizes n h , h = 1 , . . . , H . Secondly construct the intraslice sample means ( zz ′ ) h and ¯ z h : ( zz ′ ) h = 1 n h n h X i =1 ˆ z ih ˆ z ′ ih , ¯ z h = 1 n h n h X i =1 ˆ z ih , where ˆ z ih ’s are predictors f a lling into slice h . Thirdly calculate ˆ M ( α ) SIMR = H X h =1 ˆ f h (1 − α )[ ( zz ′ ) h − I p ][( zz ′ ) h − I p ] ′ + α [ ¯ z h ][ ¯ z h ] ′ = ˆ U n ˆ U ′ n , where ˆ f h = n h /n and ˆ U n = . . . , √ 1 − α [( z z ′ ) h − I p ] q ˆ f h , . . . , . . . , √ α ¯ z h q ˆ f h , . . . p × ( pH + H ) . 10 Finally calculate the eigenv alues ˆ λ 1 ≥ · · · ≥ ˆ λ p of ˆ M ( α ) SIMR and the corre- sp onding eigen v ectors ˆ γ 1 , . . . , ˆ γ p . Then Span { ˆ γ 1 , . . . , ˆ γ d } is an estimate of the CDRS Span { γ } , where d is determined by the w eighted c hi- squared test described in the next section. 4.3. A Weigh te d Chi-Squar e d T est f o r SIMR α Define the p opulation v ersion of ˆ U n : B = . . . , √ 1 − α [E( zz ′ | ˜ y = h ) − I p ] p f h , . . . , √ α E( z | ˜ y = h ) p f h , . . . = (Γ 11 ) p × d , (Γ 12 ) p × ( p − d ) D d × d 0 0 0 (Γ ′ 21 ) d × ( pH + H ) (Γ ′ 22 ) ( pH + H − d ) × ( pH + H ) (4) where ˜ y is a slice indicator with ˜ y ≡ h for all o bserv ations falling in to slice h , f h = P ( ˜ y = h ) is the p opulation v ersion of ˆ f h , and (4) is the singular value de c o mp osition of B . Denote ˜ U n = √ n ( ˆ U n − B ). By the multiv ariate cen tra l limit theorem and the multiv ariate version of Slutsky’s theorem, ˜ U n con v erges in distri- bution to a certain random p × ( pH + H ) matrix U as n go es to infin- it y (Gannoun and Saracco, 2 0 03). Note tha t the singular v alues are in- v a rian t under right and left multiplic at ion b y orthogonal matrices. Based on Eaton and T yler (1994, Theorem 4.1 and 4.2), the asymptotic distribu- tion of the smallest ( p − d ) singular v alues of √ n ˆ U n is the same as the asymptotic distribution of the corr esp o nding singular v alues o f the follo wing ( p − d ) × ( pH + H − d ) matrix: √ n Γ ′ 12 ˆ U n Γ 22 . (5) 11 Construct statistic ˆ Λ d = n p X h = d +1 ˆ λ h , whic h is the sum of the squared smallest ( p − d ) singular v alues of √ n ˆ U n . Then the a symptotic distribution o f ˆ Λ d is the same as that of the sum of the squared singular v alues of (5). That is n T race( [Γ ′ 12 ˆ U n Γ 22 ][Γ ′ 12 ˆ U n Γ 22 ] ′ ) = n [V ec (Γ ′ 12 ˆ U n Γ 22 )] ′ [V ec( Γ ′ 12 ˆ U n Γ 22 )] , where V ec( A r × c ) denotes ( a 1 ′ , . . . , a c ′ ) ′ r c × 1 for an y mat r ix A = ( a 1 , . . . , a c ). By cen tral limit theorem and Slutsky’s theorem aga in, V ec( ˜ U n ) L → N ( p 2 H + pH ) (0 , V ) for some nonrandom ( p 2 H + pH ) × ( p 2 H + pH ) matrix V . Th us, √ n [V ec(Γ ′ 12 ˆ U n Γ 22 )] L → N ( p − d )( pH + H − d ) (0 , W ) , where W = [Γ ′ 22 ⊗ Γ ′ 12 ] V [Γ ′ 22 ⊗ Γ ′ 12 ] ′ is a ( p − d )( pH + H − d ) × ( p − d ) ( p H + H − d ) matrix. Com bined with Slutsky’s theorem, it yields the f o llo wing theorem: Theorem 1. The asymptotic distribution of ˆ Λ d is the same as that of ( p − d )( pH + H − d ) X i =1 α i K i wher e the K i ’s ar e indep endent χ 2 1 r andom variables, and α i ’s ar e the eige n- values of the matrix W . Clearly , a consisten t estimate of W is needed fo r testing t he dimension of the regression based on Theorem 1. The w ay w e define M ( α ) SIMR allo ws us to 12 partition ˆ U n in to ˆ U n, 1 = . . . , √ 1 − α [( zz ′ ) h − I p ] q ˆ f h , . . . , p × pH , ˆ U n, 2 = . . . , √ α ¯ z h q ˆ f h , . . . p × H . The asymptotic distribution of the matrix ˆ U n, 2 has b een fully explored b y Bura a nd Co o k (2001), resulting in a weigh ted c hi-squared test for SIR. The similar tec hniques can also b e applied on the matrix ˆ U n, 1 , and therefore the matrix ˆ U n as a whole, although the details are m uc h more complicated. Define the p opulation v ersions of ˆ U n, 1 and ˆ U n, 2 , B 1 = . . . , √ 1 − α [E( zz ′ | ˜ y = h ) − I p ] p f h , . . . p × pH , B 2 = . . . , √ α E( z | ˜ y = h ) p f h , . . . p × H . Then ˆ U n = ˆ U n, 1 , ˆ U n, 2 , and B = ( B 1 , B 2 ). Let f , ˆ f and 1 H b e H × 1 v ectors with elemen ts f h , ˆ f h and 1 resp ectiv ely; let G a nd ˆ G b e H × H diagonal matrices with diagonal entries √ f h and q ˆ f h resp ectiv ely; a nd let ˆ F = (I H − ˆ f 1 ′ H ) , F = (I H − f 1 ′ H ) , (Γ ′ 21 ) (Γ ′ 22 ) = (Γ ′ 211 ) d × pH (Γ ′ 212 ) d × H (Γ ′ 221 ) ( pH + H − d ) × pH (Γ ′ 222 ) ( pH + H − d ) × H . Finally , define four matrices M = ( . . . , E( x | ˜ y = h ) , . . . ) p × H , N = ( . . . , E( x ′ | ˜ y = h ) , . . . ) 1 × pH = V ec( M ) ′ , O = ( . . . , E( xx ′ | ˜ y = h ) , . . . ) p × pH , C = [ O − M (I H ⊗ µ ′ x ) − µ x N ] p × pH , 13 and their corresp onding sample ve r sions M n , N n , O n , and C n . By the cen tral limit theorem, √ n V ec([( C n , M n ) − ( C, M )]) L → N ( p 2 H + pH ) (0 , ∆) for a nonrandom ( p 2 H + pH ) × ( p 2 H + pH ) matrix ∆. As a result, Theorem 2. The c ovarianc e matrix in The or em 1 i s W = ( K Γ 22 ) ′ ⊗ (Γ ′ 12 Σ − 1 / 2 x )∆( K Γ 22 ) ⊗ (Γ ′ 12 Σ − 1 / 2 x ) ′ , wher e K = √ 1 − α ( F G ) ⊗ Σ − 1 / 2 x 0 0 √ α F G The only difficult y left no w is to obtain a consisten t estimate of ∆. By the cen tral limit theorem, √ n V ec([( O n , M n , ˆ µ x ) − ( O , M , µ x )]) L → N ( p 2 H + pH + p ) (0 , ∆ 0 ) where ∆ 0 is a nonrandom ( p 2 H + pH + p ) × ( p 2 H + pH + p ) matrix, with details sho wn in the App endix. On the other hand, V ec( C n , M n ) = I p 2 H − I H ⊗ ˆ µ x ⊗ I p − I pH ⊗ ˆ µ x 0 0 I pH 0 V ec( O n , M n , ˆ µ x ) = g ( [V ec( O n , M n , ˆ µ x )]) for a certain mapping g : R ( p 2 H + pH + p ) → R ( p 2 H + pH ) suc h that V ec( C , M ) = g ([V ec( O , M , µ x )]) . 14 Th us the close form of ∆ can b e obtained by Cram ´ er’s t heorem (Cram´ er , 1946): ∆ = [ ˙ g ( [V ec( O , M , µ x )])]∆ 0 [ ˙ g ([V ec( O , M , µ x )])] ′ , (6) where the ( p 2 H + pH ) × ( p 2 H + pH + p ) deriv ativ e matrix ˙ g [V ec( O , M , µ x )] = I p 2 H − I H ⊗ µ x ⊗ I p − I pH ⊗ µ x ˙ g 13 0 I pH 0 (7) with ˙ g 13 = − ( . . . , I p ⊗ E( x ′ | ˜ y = h ) , . . . ) ′ − V ec( M ) ⊗ I p . In summary , to compose a consisten t estimate of matrix W , one can (i) substitute the usual sample momen ts to get the sample estimate of ∆ 0 ; (ii) estimate ∆ b y substituting the usual sample estimates fo r E( x ′ | ˜ y = h ), µ x and M in (6) and (7); (iii) obtain the usual sample estimates of Γ 12 and Γ 22 from the singular v alue decomp o sition o f ˆ U n ; (iv) substitute the usual sample estimates for F , G , Σ x , Γ 12 and Γ 22 in Theorem 2 to form an estimate of W . Note that b oth ∆ and ∆ 0 do not rely on α . This fact can sa v e a lot of computational time when m ultiple α ’s need to b e ch eck ed. T o a ppro ximate a linear combination of c hi-squared random v ariables, one ma y use the statistic prop osed b y Satterthw a ite (1941), W o o d (1989), Satorra and Bentle r (1994), or Ben tler and Xie (2000). In the next applica- tions, w e will presen t t ests based on Satterth waite’s statistic for illustration purp ose. 4.4. Cho osing Optimal α Y e and W eiss (2003) prop osed a b o otstrap metho d to pick up the “b est” linear combination of t wo know n methods in terms of v ariabilit y of the esti- mated CDR S ˆ S y | z . The b o o tstrap metho d works reasonably w ell with kno wn 15 dimension d of the regression, although less v ariabilit y may o ccur with a wrong d (see Section 5 for an example). Anot her dra wbac k is its computa- tional in tensit y ( L i and W ang, 2007). Alternativ e criterion for “o ptimal” α is based on the w eighted c hi-squared tests dev elop ed for SIMR. When m ultiple tests with different α rep ort the same dimension d , w e simply pic k up the α with the smallest p -v a lue. Giv en that the true dimension d is detected, the last eigen vec to r ˆ γ d added into the estimated CDRS with suc h an α is the most significan t one among the candidates based on differen t α . I n the mean time, the other eigenv ectors ˆ γ 1 , . . . , ˆ γ d − 1 with selected α t end to b e more significant than other candidates to o. Based on sim ulat io n studies (Section 5), the p erfo rmance of the p -v alue criterion is comparable with the b o otstrap one with kno wn d . The adv an tages of the former include that it is compatible with the w eighte d c hi-squared tests and it requires m uch less computation. When a mo del or an algorithm is specified for the dat a analysis, cross- v a lidation could b e used for c ho osing optimal α to o, j ust lik e how p eople did for mo del selection. F or example, see Hastie et al. (2 001, c hap. 7). It will not b e cov ered in this pap er since w e aim at mo del-free dimension reduction. 5. Sim ulation Study 5.1. A Si m ulate d Example Let the resp onse y = 2 z 1 ǫ + z 2 2 + z 3 , where ( z ′ , ǫ ) ′ = ( z 1 , z 2 , z 3 , z 4 , ǫ ) ′ are i.i.d sample from the N 5 (0 , I 5 ) distribution. Then the true dimension of the regression is 3 and the true CDRS is spanned b y (1 , 0 , 0 , 0) ′ , (0 , 1 , 0 , 0) ′ , and (0 , 0 , 1 , 0 ) ′ , that is, z 1 , z 2 and z 3 . 16 Theoretically , M SIR = Diag { 0 , 0 , V ar(E( z 3 | y )) , 0 } , M y − pHd = Diag { 0 , 2 , 0 , 0 } , and M r − pHd = Dia g { 0 , 2 , 0 , 0 } ha v e rank one and therefore are only able to find a one-dimensional prop er subspace of the CDR S. The linear com bination of an y t w o of them suggested b y Y e and W eiss (20 03) can a t most find a t wo-dimensional pro p er subspace o f the CDRS. On the con tr a ry , b oth SA VE and SIMR a re able to reco ve r the complete CDR S at a theoretical lev el. 5.2. A Si n gle Simulation W e b egin with a single simulation with sample size n = 4 00. SIR, r -pHd, SA VE a nd SIMR a re applied to the data. Num b er of slices H = 10 are used for SIR, SA VE, and SIMR. The R pack age dr (W eisb erg, 20 02, 2 0 09, v ersion 3.0.3 ) is used for SIR, r - pHd, SA VE, as w ell as their corresp onding marginal dimension t ests. SIMR α with α = 0 , 0 . 01 , 0 . 05 , 0 . 1 ∼ 0 . 9 paced by 0 . 1, 0 . 95 , 0 . 99 , 1 are applied. F or this t ypical sim ulation, SIR identifie s only the direction ( . 018 , . 000 , − . 999 , − . 035) ′ . It is roughly z 3 , the linear trend. r -pHd iden tifies only the direction ( . 011 , . 999 , − . 038 , − . 020 ) ′ , whic h is roughly z 2 , the quadratic com- p onen t. As expected, SA VE w orks b etter. It identifie s z 2 and z 1 . How ever, the marginal dimension tests for SA VE (Shao et al., 2007) fail to detect the third predictor, z 3 . The p - v alue of the corresp o nding test is 0 . 331. Roughly sp eaking, SA VE with it s marginal dimension test is comparable with SIMR 0 . 1 in this case. The comparison betw een SA VE and SIMR α sug- gests that the failure o f SA VE migh t due to its w eigh ts com bining the first and second in v erse momen ts. As α increases, SIMR α with α b etw een 0 . 3 and 0 . 8 all succeed in detecting all the three effectiv e predictors z 1 , z 2 and z 3 . 17 The CDR S estimated b y those candidate matrices a re similar to each other, whic h implies that the results with differen t α are fair ly consisten t. The ma jor difference among SIMR α is that the order of the detected predictors c hanges ro ughly from { z 2 , z 1 , z 3 } to { z 3 , z 2 , z 1 } as α increases from 0 . 3 to 0 . 8 . As exp ected, SIMR α is comparable with SIR if α is close to 1. F or this particular sim ulat io n, SIMR α with α b et w een 0 . 3 and 0 . 8 are first selected. If w e kno w the true CD R S, the optimal α is the one minimizing the distance b etw een the estimated CDRS and the true CD RS. F ollowing Y e and W eiss (2003, p. 974), the three distance measures arccos( q ) , 1 − q , 1 − r b eha v e similarly and imply the same α = 0 . 6 for this particular sim ulation. Since the true CDRS is unkno wn, b o o tstrap criterion and p - v a lue criterion (Section 4.4) are applied instead. The left panel of F igure 1 show s the v ariabilit y of b o o t stra pp ed estimated CDRS. D istance 1 − r is used b ecause it is comparable across different di- mensions. The minim um v ariabilit y is attained at d = 3 and α = 0 . 6, whic h happ ens to the optimal one based on the truth. Another 200 sim ulations rev eal that ab out 75% “optimal” α based on b o otstrap fall in 0 . 5 ∼ 0 . 6. SIMR with α chosen b y b o otstrap criterion attains 1 − r = 0 . 0086 aw ay from the true CDRS on a verage. Note that lo w v ariability not necessarily implies that the estimated CDRS is accurate. F or example, SIMR 1 or SIR can only detect one direction z 3 . How ev er the estimated one-dimensional CDRS is fairly stable under b o otstrapping (see F igure 1). The righ t panel in Fig ure 1 show s that the p -v alue criterion also pic ks up α = 0 . 6 for this single simulation (c hec k the line d = 3, whic h is the highest one that still go es b elo w the significance lev el 0 . 05 ). Based on t he same 18 200 sim ulat ions, ab out 80% of the “b est” α selecte d b y p -v a lue criterion fa ll b et we en 0 . 4 and 0 . 7. On av erage, SIMR with α selected by p -v alues attains 1 − r = 0 . 0 082, whic h is comparable with the b o otstrap ones. 5.3. Power Analysis W e conduct 1000 indep enden t simulations and summarize in T a ble 1 the empirical p o we rs and sizes of the ma r g inal dimension tests with significance lev el 0.05 for SIR, SA VE, r -pHd, and SIMR α with α c hosen b y the p -v alue criterion. F or illustration purp ose, we omit the sim ulation results of y -pHd b ecause there is little difference b et we en y -pHd and r -pHd in this case. The empirical p ow ers and sizes with significance lev el 0.01 are omitted to o since their pattern is similar to T able 1. In T able 1, the row s d ≤ 0, d ≤ 1, d ≤ 2 a nd d ≤ 3 indicate differen t n ull h ypo theses. F ollowing Bura and Co o k (2 001), the n umerical entrie s in the ro ws d ≤ 0, d ≤ 1, and d ≤ 2 are empirical estimates of the p ow ers of the corresponding tests, while the en t r ies in the ro w d ≤ 3 ar e empirical estimates of the sizes of the tests. As expected, SIR claims d = 1 in most cases. r - pHd w orks a little b etter. A t the significance lev el 0.05 , r -pHd ha s ab out 30 % c hance to find out d ≥ 2 (T able 1). A t lev el 0.01, the c hance shrinks to ab o ut 15 %. Both SA VE and SIMR p erform m uc h b etter than SIR and pHd. Compared with SA VE, SIMR has consis tently g r eat er p ow ers for the null h yp otheses d ≤ 0, d ≤ 1 a nd d ≤ 2 across differen t c hoices of sample size, n umber of slices and significan t lev el. F or example, under the nu ll hy p othesis d ≤ 2 with sample size 400, the empirical p ow ers o f SIMR at lev el 0.05 are 0 . 939 under 5 slices and 0 . 9 43 under 10 slices, while the corresp onding p o w ers of SA VE are o nly 19 0 . 399 and 0 . 2 13 resp ectiv ely (T able 1). Those differences b ecome ev en bigger at lev el 0 .0 1. T he empirical sizes of SIMR are roughly under the nominal size 0.05 a lthough t hey tend to b e larger than the others. F or comparison purpo se, the methods i n verse r e gr ession estima tor (IRE) (Co ok and Ni, 2005; W en and Co ok, 200 7; W eisb erg, 20 09)) and dir e ctional r e gr ession (DR) (Li and W ang, 2007) a re also applied. Roughly speaking, IRE p erforms similar to SIR in this example. Given that the truth dimension d = 3 is kno wn, b oth DR and SIMR are amo ng the b est in terms of mean(1 − r ). F or example, a t n = 600, DR ac hieve s mean(1 − r ) = 0 . 0050 with H = 5, 0 . 0053 with H = 10 and 0 . 0 059 with H = 1 5 , while SIMR’s are 0 . 0048 , 0 . 0046, and 0 . 0053. Nev ertheless, the p ow ers of the marginal tests fo r DR are b etw een SA VE and SIMR in this case. Roughly speaking, DR’s p ow er tests are comparable with SIMR α ’s with α b et w een 0 . 2 and 0 . 3. F or example, at H = 10 and leve l 0 . 05, the empirical p o w ers of DR against d ≤ 2 are 0 . 247 with n = 2 0 0, 0 . 8 00 with n = 400, and 0 . 974 with n = 600. Among the six dimension reduction methods applied, SIMR is the most reliable one. Besides, the c hi-squared tests for SIMR do not seem to b e ve r y sensitiv e to the n um b ers of slices. Nev ertheless , w e suggest that the n umber of slice s should not b e greater than 3%-5% of the sample size based on the sim ulation results. 6. A R eal Example: Ozone Data T o examine ho w SIMR w orks in pra ctice, w e consider a data set taken from Breiman and F riedman (1985). The resp onse Ozone is the daily ozone concen tration in parts per million, measured in Los Angeles basin, fo r 330 20 da ys in 1976. F or illustration purp ose, the dep endence of Ozone on the follo wing f o ur predictors is studied next: Height , V andenburg 500 millibar heigh t in meters; Humidity in p ercen ts; ITemp , In v erse base temp erature in degrees F ahrenheit; and STemp , Sandburg Air F orce Base temp erature in degrees F ahrenheit. T o meet b oth the linearit y condition and the constant co v ariance condi- tion, simultaneous ly p o w er t r a nsformations o n the predictors a r e estimated to impro v e the normalit y of their join t distribution. After replacing Humidity , ITemp , and STemp with Humidity 1 . 68 , ITem p 1 . 25 , and STemp 1 . 11 resp ectiv ely , SIR, r - pHd, SA VE and SIMR are applied to the dat a . F or SIR, SA VE, and SIMR, v arious n um b ers of slices are applied, and t he results are fa irly consisten t. Here w e only presen t the outputs based on H = 8 . A t significance lev el 0 . 05, SIR suggests the dimension of the regression d = 1, while r - pHd claims d = 2. Using the visualization to ols described b y Co ok a nd W eisb erg (1994) and Co ok (1998b), the first pHd predictor a pp ears to b e somewhat symmetric ab out the resp o nse O z one , and the second pHd predictor seems to b e similar to the first SIR predictor, whic h are not shown in this article. The symmetric dep endency ex plains wh y SIR is not able to find the first pHd predictor. The resulting inference based on pHd is t herefore more reliable tha n the inference based on SIR. When c hec king the predictors o f SA VE, visual to ols sho w a clear quadratic or ev en higher order p olynomial dep endency betw een the resp onse and the first SA VE predictor. The second SA VE predictor is similar to the second pHd predictor, and the third SA VE predictor is similar to the first pHd predictor. Both SIR’s and pHd’s tests miss the first SA VE predictor. 21 No w apply SIMR to the ozone data. Bo otstrap criterion pick s up α = 0 . 2 while p -v alue criterion suggests α = 0. Nev ertheless, b oth SIMR 0 . 2 and SIMR 0 lead to v ery similar estimated CDRS in this case (see T able 2). As exp ected , they recov ers all the three SA VE predictors. Actually , those three estimated CDRS app ear to b e almost identical. 7. Discussion SIMR α and SA VE are theoretically equiv alen t sinc e that the subspaces spanned b y their underlying matrices are iden tical. Nev ertheless, sim ulation study sho ws that SIMR α with some c hosen α ma y p erform b etter than SA VE. The main reason is t ha t SA VE is only a fixed combination of the first tw o in v erse momen ts. The sim ulation example in Section 5 implies that any fixed combin a tion can not alw a ys b e the winner. Apparently , SIMR 0 . 6 can not alw a ys be the winner either. F or example, if the sim ulation example is c hanged to y = 2 z 1 ε + z 2 2 + 0 . 1 z 3 , SIMR α with α closer to 1 will p erform b etter. F or practical use , m ultiple metho ds, as w ell as their com binations, should b e tried and unified. SIMR α with α ∈ (0 , 1) prov ide a simple solution to it . As a conclusion, w e prop ose SIMR using w eigh ted c hi-squared tests as an imp ortant class of dimension reduction metho ds, which should b e routinely considered during the searc h for the cen tr a l dimension reduction subs pace and its dimension. App endix Pro of of Lemma 1: By definition, Span { E( M M ′ ) } ⊆ Span { M ( ω ) , ω ∈ 22 Ω 0 } , if P ( Ω 0 ) = 1. On the o ther hand, for an y v p × 1 6 = 0, v ′ E( M ( ω ) M ′ ( ω ) ) = 0 ⇒ v ′ E( M ( ω ) M ′ ( ω ) ) v = 0 ⇒ E([ v ′ M ( ω )][ v ′ M ( ω )] ′ ) = 0 ⇒ [ v ′ M ( ω )] ≡ 0 , with probability 1 Since { v : v ′ E( M M ′ ) = 0 } only has finite dimension, there exists an Ω 0 with probabilit y 1, suc h that, dim(Span { E( M ( ω ) M ′ ( ω ) ) } ) ≥ dim(Span { M ( ω ) , ω ∈ Ω 0 } ) . Th us, Span { E( M ( ω ) M ′ ( ω ) ) } = Span { M ( ω ) , ω ∈ Ω 0 } Pro of of Corollary 2: Span { M y − pHd = E[ y ( µ 2 ( y ) − I)] } ⊆ Span { [ µ 2 ( y ) − I] , ∀ y } = Span { M zz ′ | y } . Pro of P rop osition 1: Define µ i = E[( zz ′ − I) | y = a i ] = E( zz ′ | y = a i ) − I and f i = Pr( y = a i ) for i = 0 , ...k , then Σ k i =0 f i = 1 and Σ k i =0 f i µ i = E(( zz ′ − I)) = 0 . The rest of the steps follow the exactly same pro of as in Yin and Co ok (200 2, A.3. Prop o sition 4). Pro of of Prop osition 2: By Lemma 1, Span { M SA VE } = Spa n { [ µ 1 ( y ) µ 1 ( y ) ′ + ( µ 2 ( y ) − I)] , ∀ y } ⊆ Span { µ 1 ( y ) , ∀ y } + Span { ( µ 2 ( y ) − I) , ∀ y } = Span { M SIR } + Span { M zz ′ | y } ⊆ Span { M SIR } + [Span { µ 1 ( y ) µ 1 ( y ) ′ + ( µ 2 ( y ) − I) , ∀ y } +Span { µ 1 ( y ) , ∀ y } ] ⊆ Span { M SIR } + Span { M SA VE } + Span { M SIR } = Span { M SA VE } . 23 Pro of of Prop osition 3: By Lemma 1, Span { M ( α ) SIMR } = Span { ( µ 1 ( y ) , [ µ 2 ( y ) − I]) , ∀ y } = Span { µ 1 ( y ) , ∀ y } + Span { [ µ 2 ( y ) − I] , ∀ y } = Span { M SIR } + Span { M zz ′ | y } = Span { M SA VE } . Pro of of Theorem 2: Actually , B = Σ − 1 / 2 x ( C , M ) K , ˆ U n = ˆ Σ − 1 / 2 x ( C n , M n ) √ 1 − α ( ˆ F ˆ G ) ⊗ ˆ Σ − 1 / 2 x 0 0 √ α ˆ F ˆ G . Note that (Γ ′ 12 B 1 , Γ ′ 12 B 2 ) = 0 ( p − d ) × ( pH + H ) , B 1 Γ 221 + B 2 Γ 222 = 0 p × ( pH + H − d ) , Span { C ′ Σ − 1 / 2 x Γ 12 } ⊆ Span { 1 H ⊗ I p } , Span { M ′ Σ − 1 / 2 x Γ 12 } ⊆ Span { 1 H } , 1 ′ H ˆ F = 0 , 1 ′ H F = 0. W riting ˆ I p = ˆ Σ − 1 / 2 x Σ 1 / 2 x , √ n Γ ′ 12 ˆ U n Γ 22 = √ n Γ ′ 12 ˆ U n, 1 Γ 221 + √ n Γ ′ 12 ˆ U n, 2 Γ 222 = √ 1 − α √ n Γ ′ 12 ( ˆ I p − I p + I p )Σ − 1 / 2 x ( C n − C + C )[( ˆ F ˆ G − F G + F G ) ⊗ I p ] (I H ⊗ Σ − 1 / 2 x )[I H ⊗ ( ˆ I ′ p − I p + I p )]Γ 221 + √ α √ n Γ ′ 12 ( ˆ I p − I p + I p ) Σ − 1 / 2 x ( M n − M + M )( ˆ F ˆ G − F G + F G )Γ 222 = √ 1 − α √ n Γ ′ 12 Σ − 1 / 2 x ( C n − C )[ F G ⊗ I p ](I H ⊗ Σ − 1 / 2 x )Γ 221 + √ α √ n Γ ′ 12 Σ − 1 / 2 x ( M n − M ) F G Γ 222 + O p ( n − 1 / 2 ) = √ n Γ ′ 12 Σ − 1 / 2 x [( C n , M n ) − ( C, M )] K Γ 22 + O p ( n − 1 / 2 ) . Therefore, the asymptotic distribution of Γ ′ 12 ˆ U n Γ 22 is determined only b y the asymptotic distribution o f ( C n , M n ). 24 The detail of ∆ 0 , ( p 2 H + pH + p ) × ( p 2 H + pH + p ) : ∆ 0 = ∆ 1 , 1 0 ∆ 1 , 2 0 ∆ 1 , 3 0 ∆ 2 , 1 0 ∆ 2 , 2 0 ∆ 2 , 3 0 ∆ 3 , 1 0 ∆ 3 , 2 0 ∆ 3 , 3 0 , where ∆ 1 , 1 0 = diag { . . . , Co v (V ec( xx ′ ) | ˜ y = h ) /f h , . . . } , p 2 H × p 2 H ; ∆ 2 , 1 0 = diag { . . . , Co v ( x , V ec( xx ′ ) | ˜ y = h ) / f h , . . . } , pH × p 2 H ; ∆ 2 , 2 0 = diag { . . . , Co v ( x | ˜ y = h ) /f h , . . . } , pH × pH ; ∆ 3 , 1 0 = [ . . . , Co v ( x , V ec( xx ′ ) | ˜ y = h ) , . . . ] , p × p 2 H ; ∆ 3 , 2 0 = [ . . . , Co v ( x | ˜ y = h ) , . . . ] , p × pH ; ∆ 3 , 3 0 = Σ x , p × p ; ∆ 1 , 2 0 = ∆ 2 , 1 0 ′ ; ∆ 1 , 3 0 = ∆ 3 , 1 0 ′ ; ∆ 2 , 3 0 = ∆ 3 , 2 0 ′ . References Ben tler, P .M., Xie, J., 2000. Corrections to test statistics in principal Hessian directions. Statistics and Probabilit y Letters. 47, 381-389. Breiman, L., F riedman, J., 1985. Estimating optimal transformations for m ultiple regression and correlation. J. Amer. Statist. Assoc. 80, 580- 597. Bura, E., Co ok, R .D., 2001. Extending sliced inv erse regression: the w eigh ted c hi-squared test. J. Amer. Statist. Assoc. 9 6, 9 96-1003 . Co ok, R.D., 1994a. On the in terpretatio n of regression plots. J. Amer. Statist. Asso c. 89, 177-189. Co ok, R .D., 1994 b. Using dimension-reduction subspace s to iden tify imp or - tan t inputs in mo dels of phys ical systems. Pro ceedings of the Section on Ph ysical a nd Engineering Sciences . Alexandria, V A: American Statistical Asso ciation. 18-2 5. 25 Co ok, R .D., 1996 . Graphics for regressions with a binary resp onse. J. Amer. Statist. Assoc. 91, 983- 992. Co ok, R.D., 1998a . Principal Hes sian directions revis ited (with discussion). J. Amer. Stat ist. Asso c. 93 , 84-1 0 0. Co ok, R.D., 1998b. Regression Gra phics, Ideas for Studying R egressions through Graphics. Wiley , New Y o r k. Co ok, R .D., Critc hley , F., 2000. Iden tifying regression outliers and mixtures graphically . J. Amer. Statist. Asso c. 95, 7 81-794. Co ok, R.D., Li, B., 2002. Dimension reduction for conditional mean in re- gression. Annals of Statistics. 30, 45 5 -474. Co ok, R.D., Lee, H., 199 9. Dimension-reduction in binary response regres- sion. J. Amer. St a tist. Assoc. 94, 1187-1 2 00. Co ok, R.D ., Ni, L., 2005. Sufficien t dimension reduction via inv erse regres- sion: A minimum discrepancy approac h. J. Amer. Statist. Asso c. 100, 410-428 . Co ok, R.D., W eisb erg, S., 1991. Discuss io n of ‘sliced in v erse regress io n for dimension reduction’. J. Amer. Statist. Asso c. 86 , 328 -332. Co ok, R.D ., W eisb erg, S., 1994. An In tro duction to Regression G raphics. Wiley , New Y ork. Co ok, R.D ., Yin, X., 20 01. Dimension reduction and visualization in dis- criminan t ana lysis (with discussion). Australian & New Zealand Journal of Statistics. 43, 147 -199. 26 Cram ´ er, H., 1946. Mathematical Metho ds of Sta tistics. Princeton Univ ersit y Press, Princeton. Eaton, M.L., T yler, D.E., 19 94. The asymptotic distributions of singular v al- ues with a pplications to canonical corr elat io ns a nd correspo ndence analy- sis. Journal of Multiv ariate Analysis. 50, 2 38-264. Gannoun, A., Sara cco, J., 20 03. Asymptotic theory for SIR α metho d. Statis- tica Sinica. 13, 297-310. Hastie, T., Tibshirani, R., F riedman, J., 2001. The Elemen ts of Sta tistical Learning: Data Mining, Inference, and Prediction. Springer. Li, B., W a ng, S., 2007. O n directional regression fo r dimension reduction. J. Amer. Statist. Asso c. 102, 99 7-1008. Li, K.-C., 19 91a. Sliced inv erse regression for dimension reduction (with dis- cussion). J. Amer. Statist. Asso c. 86, 316-3 27. Li, K.-C., 19 91b. Rejoinder to ‘sliced in v erse regression for dimension reduc- tion’. J. Amer. Stat ist. Asso c. 86 , 337- 3 42. Li, K.-C., 1992. On principal Hessian directions for da t a visualization and di- mension reduction: another application of Stein’s lemma. J. Amer. Statist. Asso c. 87, 1025-1039 . Satorra, A., Ben tler, P .M., 19 9 4. Corrections to t est statistics and standard errors in co v ariance structure analysis. In: v on Ey e, A., Clogg C.C. (Eds.), Laten t V ariables Analysis: Applications for Dev elopmen tal Researc h, 399- 419, Sage, Newbury Park, CA. 27 Satterth waite, F. E. (1941). Syn thesis o f v ariance. Psyc hometrik a. 6, 309-316 . Shao, Y., Co o k, R.D., W eisberg, S., 2007 . Marginal tests with sliced av erage v a riance estimation. Biometrik a. 94 ,285-296 . W eisb erg, S., 2002. Dimension reduction regression in R. Journal of Statisti- cal Soft w a r e. 7. Av ailable from h ttp://www.jstatsoft.org . W eisb erg, S., 2009. The dr pa ck age. Av a ila ble from h ttp://www.r-pro ject.org . W en, X., Co ok, R.D ., 200 7. O ptima l sufficien t dimension reduction in re- gressions with cat ego rical predictors. Journal of Statistical Inferenc e and Planning. 137, 1961-79 . W o o d, A., 1989. An F-approx imat io n to the distribution of a linear com bi- nation of c hi- squared random v ariables. Comm unication in Statistics, Part B - Simulation and Computation. 18, 143 9-1456. Yin, X., Co ok, R.D ., 20 0 2. D imension reduction for the conditional k th mo- men t in r egr ession. Journal of the Roy al Statistical So ciet y , Ser. B. 64, 159-175 . Yin, X., Co ok, R.D., 20 03. Estimating cen tral subspaces via inv erse third momen ts. Bio metrik a. 90, 113-125. Y e, Z ., W eiss, R.E., 2003. Using the b o otstrap to select one of a new class of dimension reduction metho ds. J. Amer. Statist. Asso c. 98, 968-979 . 28 T able 1: Empirica l Pow er and Size of Margina l Dimension T ests for SIR, SA VE, SIMR α with α Chosen by p -V alue Cr iterion, and r -pHd, a s W ell as Mean of 1 − r Distances b etw een Estimated 3 -Dim CDRS and T rue CDRS, B ased o n 100 0 Simulations (Significance Level: 0.05; Sample Size: 20 0, 40 0, 6 00; Number of Slices: 5, 10 , 15 ) n=200 SIR SA VE SIMR α r -pHd Slice 5 10 15 5 10 15 5 10 15 - d ≤ 0 0.996 0.9 67 0.933 1.000 0 .9 94 0.885 1 .0 00 0.999 0.98 5 1.00 0 d ≤ 1 0.050 0.0 53 0.102 0.561 0 .3 79 0.152 0 .8 92 0.855 0.76 0 0.27 7 d ≤ 2 0.004 0.0 03 0.003 0.061 0 .0 25 0.007 0 .4 89 0.441 0.35 4 0.02 7 d ≤ 3 0.001 0.0 00 0.000 0.003 0 .0 01 0.000 0 .0 32 0.022 0.02 6 0.00 5 mean(1 − r ) 0.124 0.1 27 0.119 0.045 0 .0 60 0.077 0 .0 33 0.033 0.03 9 0.11 1 n=400 SIR SA VE SIMR α r -pHd Slice 5 10 15 5 1 0 15 5 1 0 15 - d ≤ 0 1.000 1.0 00 1.000 1.000 1 .0 00 1.000 1 .0 00 1.000 1.00 0 1.00 0 d ≤ 1 0.039 0.0 50 0.108 0.983 0 .9 74 0.888 1 .0 00 1.000 0.99 3 0.29 3 d ≤ 2 0.003 0.0 01 0.012 0.399 0 .2 13 0.091 0 .9 39 0.943 0.86 0 0.02 6 d ≤ 3 0.001 0.0 00 0.000 0.015 0 .0 13 0.010 0 .0 52 0.040 0.03 3 0.00 2 mean(1 − r ) 0.127 0.1 29 0.120 0.016 0 .0 25 0.038 0 .0 09 0.009 0.01 1 0.10 9 n=600 SIR SA VE SIMR α r -pHd Slice 5 10 15 5 1 0 15 5 1 0 15 - d ≤ 0 1.000 1.0 00 1.000 1.000 1 .0 00 1.000 1 .0 00 1.000 1.00 0 1.00 0 d ≤ 1 0.054 0.0 62 0.053 1.000 1 .0 00 0.998 1 .0 00 1.000 1.00 0 0.32 8 d ≤ 2 0.001 0.0 00 0.002 0.841 0 .6 01 0.371 0 .9 96 1.000 0.99 2 0.04 0 d ≤ 3 0.001 0.0 00 0.000 0.021 0 .0 19 0.013 0 .0 48 0.034 0.03 1 0.00 6 mean(1 − r ) 0.123 0.1 23 0.125 0.008 0 .0 10 0.016 0 .0 05 0.005 0.00 5 0.10 8 29 Figure 1: Optimal α acco r ding to v ariability of 20 0 bo otstrapp ed estimated CDRS (left panel, d = 3 indica tes the first 3 eig e n vectors considered, and so on) or p -v alues of weigh ted chi-squared tests (right panel, d = 3 indicates the test d ≤ 2 versus d ≥ 3, and so on) 0.0 0.2 0.4 0.6 0.8 1.0 −5 −4 −3 −2 −1 0 α log mean of (1−r) d=1 d=2 d=3 0.0 0.2 0.4 0.6 0.8 1.0 −25 −20 −15 −10 −5 0 α log p−value d=4 0.05 d=3 d=2 d=1 T able 2: Ozone Da ta : Estimated CDRS b y r -pHd, SA VE, SIMR 0 , and SIMR 0 . 2 ( H = 10 for SA VE and SIMR) First Seco nd Third F ourth First Seco nd Third F ourth r − pHd -.113 0.333 ( 0.183 ) (-.194) SA VE 0 .635 0.126 0.096 (-.124) -.049 0.084 ( -.018 ) (-.012) -.026 -.031 0.015 (-.026) 0.826 0.939 ( -.642 ) (-.030) -.665 -.621 -.664 (-.143) -.551 -.031 ( 0.7 45) (0.981) -.392 -.773 0.741 (0.981 ) SIMR 0 0.652 0.169 0.092 (0.12 5) SIMR 0 . 2 0.685 0.204 0.092 (-.125) -.025 -.032 0.015 (0.0 26) -.02 4 -.031 0.0 15 (-.026) -.662 -.803 -.645 (0.13 7) -.653 -.708 -.653 (-.141) -.369 -.571 0.758 (-.982 ) -.322 -.676 0.75 1 (0.982 ) Note: “( · )” indicates nonsignifica nt direction at level 0 . 0 5. 30
Original Paper
Loading high-quality paper...
Comments & Academic Discussion
Loading comments...
Leave a Comment