Contextualizing the global relevance of local land change observations
To understand global changes in the Earth system, scientists must generalize globally from observations made locally and regionally. In land change science (LCS), local field-based observations are costly and time consuming, and generally obtained by…
Authors: N. R. Magliocca (1), E. C. Ellis (1), T. Oates (2)
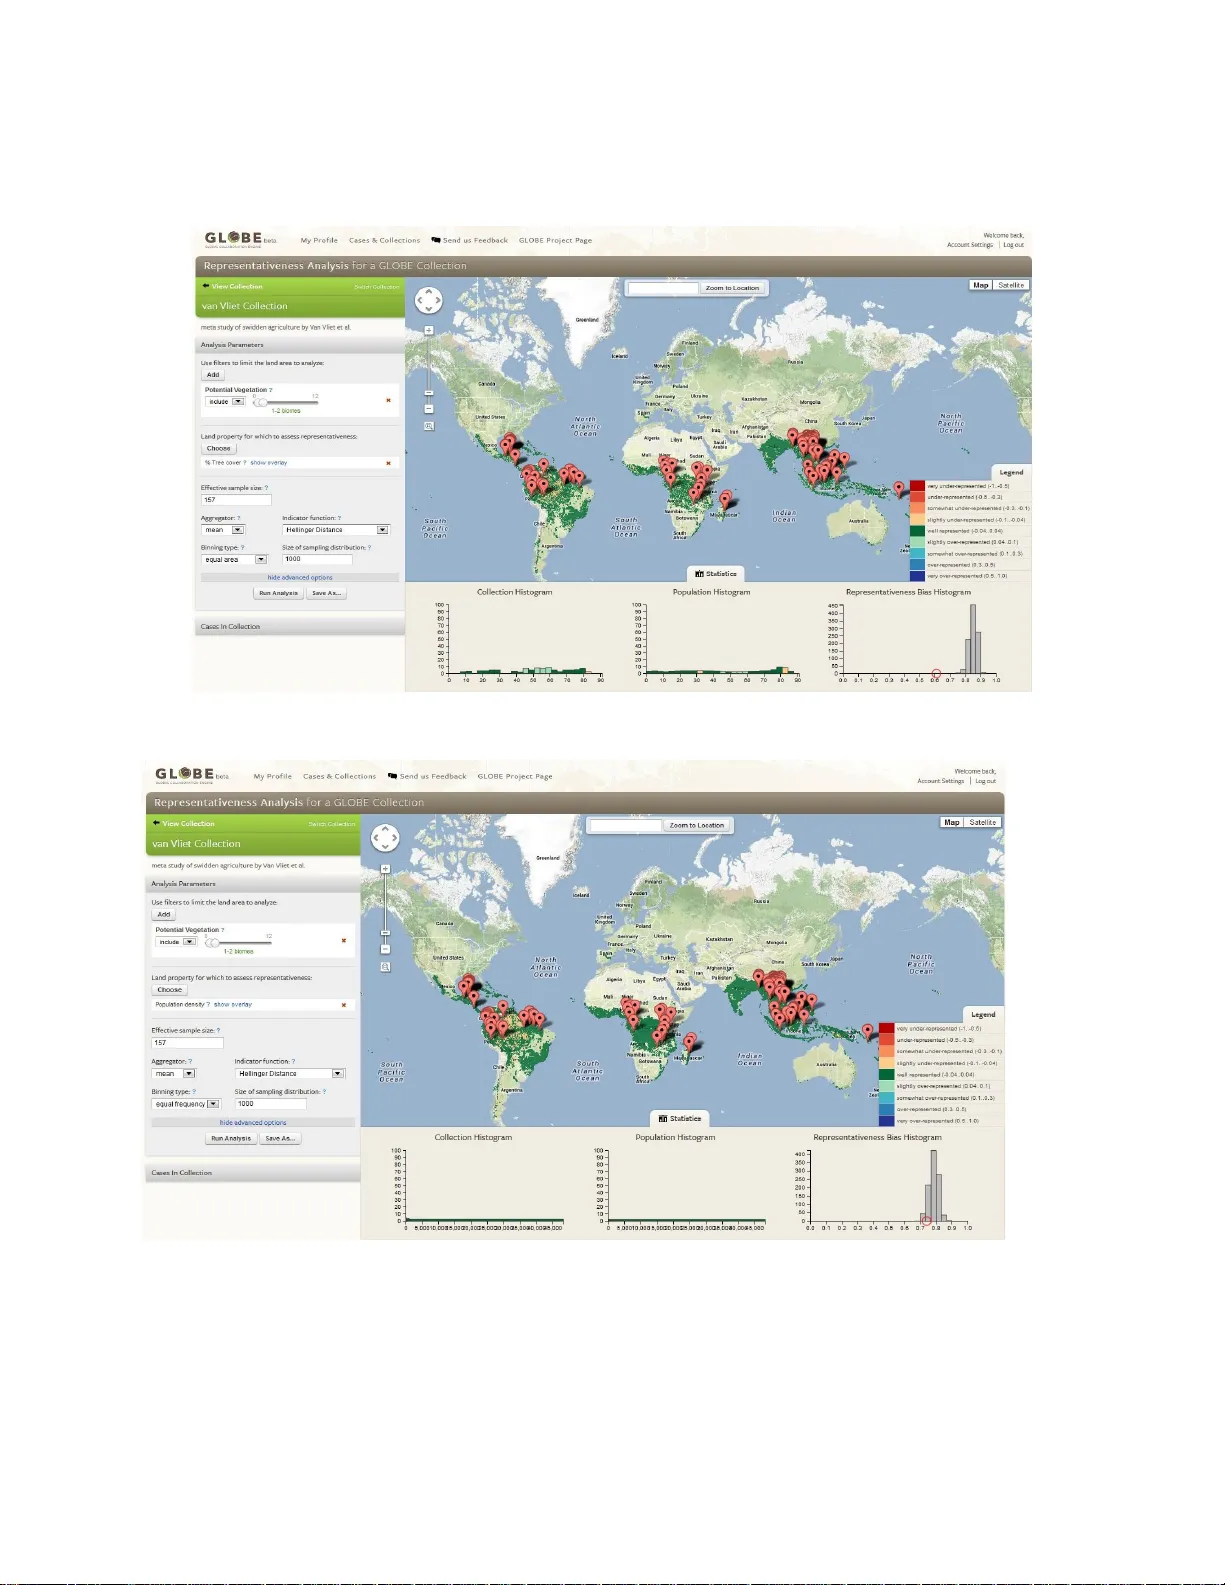
Contextuali zing the global releva nce of local land change observations N. R. Magliocca (1 ), E. C. Ellis (1), T. Oates (2) and M. Schmi ll (2) (1) Departm ent of Geograp hy and Env ironmental System s, University of Ma ryland, B altimore Coun ty, Baltimore, Mary land, USA (2) Departm ent of Computer Scienc e and Electr ical Eng ineering, University of Mary land, Baltim ore County, Baltim ore, Maryland, U SA Email: nm ag1@um bc.edu Abstract To understand global changes in the Earth system, scie ntists must generalize globally fro m observations made locally and regionally. In land cha nge science (LCS), local f ield -based o bservations are costly and ti me consuming, and generally obtained b y researchers working at disparate local and regional case -study sites chosen for different reasons. As a result, gl obal synthesi s efforts in LCS tend to be based o n non-statist ical inferences subj ect to geographic biases stem ming from data limita tions and fragmentation. T hus, a fundamental challenge is the production of generalized knowledge that links e vidence of the causes and consequences o f local land change to global patterns and vice versa. T he GLOBE system was designed to meet this challenge. G LOBE aims to trans form global change science b y enabling new scientific workflo ws based on statisticall y robust, globally relevant integration of local and r egional observations using an online social -computational and geovisualizatio n system. Consistent with the goals o f Digital Eart h, GLOBE has the cap ability to assess the global r elevance of local case - study findings within t he context of over 50 global bioph ysical, land- use, climate, and soc io-econo mic datasets. We demonstrate the imple mentation of one such a ssessment - a representativeness ana lysis - with a recentl y published meta-study of change s in swidden agricu lture i n tropical forests. The anal ysis provides a st andardized indicato r to judge the global representati veness of the trends rep orted in the m eta-stud y, and a geovisualizatio n is presented that highlights areas for which sampling efforts can be r educed and tho se in need of further st udy. GLOBE will e nable researchers and institutio ns to rapid ly share, compare, and synthesize loca l and regional stu dies within the global context, as well as contrib uting to the larger goal of creating a Digital Earth. 1. Introduction Much of our k nowledge of g lobal environm ental change, and in particula r its connect ion to land use, h as been synthesiz ed from loca l observations. These lo cal observ ations, in th e form of case studies, are considered to be the g old standard fo r investigating the causes and con sequences o f local land-use chang e [1 ]. For thi s reason, land chang e scientists m ust generalize globa lly from case-study observations m ade locally and regiona lly to unders tand land use as a global ch ange process. Meta- studies ac ross se ts of local case studies have em erged as one of the prim ary m ethods used in land chang e science to rese arch regional to global pattern s in the causes a nd consequence s of local land change [2 ]. However, the c ase-studies u pon which meta- studies rely a re not conduc ted at random locations ac ross Earth’s lan d. As a resu lt, a sam ple of existing case s tudies can be highly biased, ov er-representing or unde r-representing more accessib le areas, wealthy areas, high popula tion areas, th e temperate zone, etc., which can com promise the bro ader- scale inferences o f the meta- study [3]. The GLOBE pro ject was de veloped in part to address t his issue. The GLOBE p roject aims to tran sform land change scien ce by enabling new s cientif ic workflow s built on statis tically ro bu st global integ ration of local and regional observations us ing a social- computational system available free ly online. The computational sy stem of G LOBE can assess the deg ree to wh ich a given col lection of case stud ies is an unbiased sam ple across an exten t of Earth’s land bas ed on one o r several glob al variable s of interest, and to potentially remediate bias in case- study samples by identifying underrepresen ted areas. This is done through represen tativeness and re presentedness analy ses designed p rimarily to assist researche rs conducting m eta-studies of existing local or region al case s tudies by detecting under- and over- studied areas. We first discuss th e related concepts of representat iveness and represen tedness, and descri be the algorithm implem ented in the GLOBE sy stem to carry out the analy ses. Both analyses ar e then demonstrat ed with a recently published m eta-study of global changes i n swidden cultiv ation by v an Vliet and co lleagues [4 ]. A set of experim ents assess how well the collection o f case studies used in t he meta-study repres ents global patterns in percen t tree cover an d population den sity, as well as com paring analy ses over two differen t spatial extents that more or less precisely encompass the g lobal area of inte rest. Findings from these analyses are presen ted in a ser ies of screen s hots from the GLO BE online sy stem. Limitations of the current system are discusse d, followed by a desc ription of futu re capabili ties desig ned to further adv ance synthesis in land ch ange sci ence. 2. Methods 2.1. Representati veness and representedness Representativen ess analysis assesse s the degree to wh ich a giv en collection (i.e. sam ple) of study sites represents an unbia sed sam ple of a specified glob al extent (i.e. popu lation) with re spect to a set of g lobal variabl es selec ted by the us er. Representativ eness can be assessed in two w ays: distribu tional or variational rep resentativ eness. Distributiona l represent ativeness is a m easure of h ow well the frequen cy distribution of the sample (i.e. co llection of c ase-study sites) alig ns with that of the population (i.e. specified global exte nt) wit h respect to a pa rticular var iable. Variationa l represent ativeness is an assessment of how well the v ariability within the sample covers th e range of var iability observ ed across the population. S ince the ob jective of m ost meta-studies in land ch ange science is to capture the central tendencies of land c hange trends [2], we will conside r distribution al represent ativeness fo r these analy ses. Representativ eness analysis is based on the princip le that unbiased sam ples of stud y sites would characterize the distribution of variation observed in a global variabl e(s) to the sa me deg ree as a random sample of the sam e size. The deg ree to which a sample collection is repre sentative of a specified global extent is quantif ied by how sim ilar its frequency distributio n(s) are to that of the en tire specified g lobal extent (one of s everal f -divergence indicators can be u sed, [5]). The rep resentativeness of the sam ple (measured as a sing le indicator value from 0 to 1) is th en compared to the frequency distribution o f representativene ss indicator v alues for a large set of aut omatically g enerated random samples. From this, the probability of attaining a given level of representati veness by random sampling ca n be com pared against the repre sentativene ss of the colle ction; sample s with represen tativeness le vels similar to the central 50% of ran dom sam ples are not signi ficantly biased, and those wit h lower l evels show bia s. Representedness is a related conc ept that assess how well locat ions within a spe cified globa l extent are represented by the collection of s tudy sites with re spect to a set of global v ariables. Again, the frequency distributions of the sample and population fo r a given variable are com pared. If the frequency of data values of the sam ple - obtained from the specified g lobal data set at each ca se-study site location - is greater than that of the pop ulation at any value, then case-study sites w ith that v alue are over- represented in the sam ple, and vice ver sa. Differences in frequency distributions a t each variable v alue are normalized between values of - 1 and 1 for per fectly under- and over-represented, r espectively , with a value of 0 implying a well-represented v ariable value. The representedness of areas w ithin th e specified g lobal extent are color-coded as a heat m ap for quick g eovisualizatio n, and the global e xtents of w ell -represented, under-represented and over- represented areas are c alculated a s a total area (k m 2 ) and as a percentage of the specified global e xtent. 2.2. Data Structu re The global analy tic capabili ties of GLOBE a re achieved by stratify ing Earth’s lan d surface into a se t of equal-area hexag on tiles deriv ed using the geode sic discrete g lobal grid (DG G) sys tem of Sahr [4], [5 ]. The full set of roughly 1.44 million 96 km 2 hexagonal ISEA A3H Lev el 12 DGG tiles covering Earth’s land surface serv e as the foundat ional units for globa l analysis in G LOBE (GLOB E Land Units; G LU). In the GLOBE system , global v ariable values a re recorded for each GLU , thereby enabling rapid calcula tion of area-weig hted statistics acros s the entirety of Earth ’s land surfac e. A growing set of publically available glob al datasets are integrat ed into the GLO BE system . The full set and descriptions of each variable can b e found at h ttp://globe.um bc.edu/docum entation/global-v ariables/. Various geoproces sing m ethods are used in ArcGI S 10.0 (ESRI , Redlands, CA) to conv ert global variab le datasets from their native form ats to the GLUs used in GLOBE. First, ea ch global v ariable is converted to 30 arcsec raster wi th an ext ent equal to LandSc an 2007 [8 ], wh ich is used as the ba se layer. Global variables that hav e smaller exten ts than LandS can 2007 are first ex trapolated in th eir native resolu tions using the ‘Focal S tatistics’ func tion before be ing converted t o 30 arcsec resolution. Once co nverted to 30 ar csec resolu tion, all datase ts a re processed wi th the DGG raster (30 arcsec resolution) us ing the ‘Z onal Statistics’ tool t o obtain v alues for each GLU. 2.3. Experiments Three experim ents are conducted w ith a recently published m eta-study of changes in swidden ag riculture from van Vliet et al. [3] to test the representat iveness and represent edness algori thms. The first analy sis i s performed with the v an Vliet coll ection based on glob al percent t ree cover from MO DIS 2003 data [9 ] . Since the van V liet meta-study investigates swidden ag riculture, which is typic ally found in tropical forests, we expec t that the c ollection will no t be represe ntative of percent tree cover over th e enti re global extent. We then repeat this analysis with a m ore precis e spatial constra int by filter ing the global ex tent to include just the trop ical woodland biom es based o n global potent ial vegetation c lasses [10]. Lim iting the extent of the an alysis to tro pical woodlands is m ore consisten t with the intended study area of the van Vliet et al. [4 ] meta- study, which should be reflected b y a bias indica tor value clos er to that of a rand om sample. Howev er, because swidden agricul ture often entails def orestation, we expect that the v an Vliet collection is stil l biased to wards less tree cover than t hat observ ed across all trop ical forests. Thus, we repeat the repres entativenes s analysis, lim ited to tropic al forests, bu t based on glo bal population d ensity, to assess whether the co llection is m ore representa tive of population densit ies observed ac ross tropica l forest locations. Screen shots of the representativ eness analyses p erform ed in GLOBE are prov ided below. The input parameters of th e analysis a re seen on the left sid e of the screens. Effec tive sam ple size is set to equal the number of cases in the van Vlie t collection (n=157), w hich also speci fies the size of each of th e 1000 random sam ples taken from the wi thin the area of analy sis (i.e. populati on). Histograms of the v an Vliet collection and popu lation a re shown at the bottom of the sc reens and illustrate the percentag e of GLUs with the specified g lobal va riable value (fig. 1). The third histogram displays the b ias indicato r value of the collection ( red circle) c ompared to the d istribution of bias ind icator values g enerated from the random samples of the popu lation (fig. 1). The map is colo r coded by rep resentedness v alues, with d ark red as 'very under-represented', g reen as 'well represent ed', and dark blue as 'very ov er-represented'. Figure 1: Histogra ms of the (a) co llection, (b) population of GLUs in the a nalysis extent, and ( c) bias indicator values from random samples (gra y bars) and collectio n (red circle). 3. Results The first represen tativeness analysi s of the van Vli et collect ion was conduct ed over th e entire global ex tent and based on percen t tree c over (fig. 2). The colle ction was highly biased (represe ntativeness bias = 0.4) in comparison to a ran dom sam ple (mean = 0.75), as low percent tree c over areas (e. g. desert and arc tic regions) were under- represented (red) and some forested areas were slightly over -represented (light green). Figure 3 shows a revised represent ativeness ana lysis that was limited to tropical fores t s, taking into account the tendency for sw idden agriculture to be lim ited to tropic al areas. As a res ult, the collection appeared less b iased (0.62) in com parison to a random sample (m ean = 0.85). Are as of moderate tree cover were slightly over-represented, while areas with high percentages of tree cover (e.g. central Amazon) were under-represen ted. Th e final represen tativeness a nalysis used the same spa tial extent as the pr evious analysis, but was instead based on p opulation d ensity (fig. 4). With r espect to pop ulation density , the van Vliet collection w as roughl y as unbiased (0.75) as a ra ndom sam ple (mean = 0.8). Most tropical fo rest areas were well represented by the collect ion, with the excep tion of parts o f the Am azonian region w hich were slightly under-represented. Figure 2: A screen s hot from a GLOBE repr esentativeness analysis o f the collection of site s contained in van Vlie t et al. [4 ] based on global p ercent tree cover. Dar k red is 'very under -repr esented', green is 'we ll represented', and d ark blue is 'very over -represented'. Figure 3: Representative ness anal ysis of the van Vliet collect ion based on global p ercent tree cover li mited to the spatial extent of tropical b iomes. Figure 4: Representative ness anal ysis of the van Vliet collect ion based on global p opulat ion d ensity limited to the spatial extent of tropical b iomes. 4. Discussion and co nclusions The results of the three represen tativeness ana lyses illustrate d the import ance of quantify ing and bounding the areas of the Ear th's surface to which meta- study fi ndings app ly. The van V liet collectio n was found to be a slightly biased representa tion of tropical forest are as based on percen t tree cov er. Howev er, this was to be expected g iven that sw idden agriculture takes pl ace in close prox imity to po pulated areas and implies a degree of defo restation. I n fact, the col lection was fo und to be a nea rly unbiased sam ple of tropic al forest si tes based on pop ulation d ensity, and thus the m eta-study finding s are statistical ly represent ative of othe r tropical forest sites with sim ilar population den sities bey ond the collecti on of case s analyz ed. The GLOBE sy stem advances curr ent global ass essment and sy nthesis efforts by providing a spatially explicit, quanti tative assessm ent of the representativ eness of g eoreferenced lo cal observations in the context of globa l biophysical and soc io-econom ic variables. This enabl es statistic ally robust g lobal inferences to be m ade from local observation s, which is nec essary to char acterize the generalizability of meta-study find ings. The represent ativeness ana lyses in GLOBE are s till being dev eloped, and are currently limited to a single variable. Futur e versions wil l include functionality fo r multivariate representativene ss analysis. Additional futu re capabilities will prov ide users with tools to im prove the representativene ss of existing collections. This can be done by ei ther calculating a set of we ights to compensate for ov er- and under- represented case st udies, and/or searching for cas e studies speci fically within underreprese nted are as to add to a collect ion. More broad ly, GLOB E will enable research ers and institutions to rap idly share, com pare, and sy nthesize local and regional stud ies within the global con text, as well as contr ibuting to th e larger goal o f creating a Digital Earth. Ac knowledgements The GLOBE pro ject is supported by the US Nationa l Science Fou ndation unde r g rant NSF # 1125210. Any opinions, findi ngs, and conc lusions or recom m endations expressed in th is material are those of th e authors and do not n ecessarily reflect the views of the National S cience Founda tion. References [1] Keys E and McConnell WJ 2005 Glob Environ Change 15 320- 337 [2] Rudel TK 20 08 Glob Environ Chang e 18 18 - 25 [3] Martin LJ, Blo ssey B, Ellis EC 2012 Fron t Ecol Environ 10 (4) 195 - 201 [4] van Vliet N et al 2012 Glob E nv iron Ch ange 22 418 -429 [5] Ali SM and Silvey SD 19 66 J Royal Stat Soc Series B 28 1 131 – 142 [6] Sahr K 2001 User Documentation for Discrete Global Grid Generation So ftware (DGGRID version 3.1 b). [7] Sahr K, White D, and Ki merling AJ 2003 Cart Geograph ic Inform Sci 30 12 1 114 [8] Dobson JE et al 2000 Ph otogramm Eng R em S 66 849 – 57 [9] Hansen M et al 2003 Vegetation Continuous Fields MOD44 B, 2 001 Percent Tree Cover, Collection 3. University of Maryland, Colle ge Park, Maryland, 2 001. [online] URL: http://glcf.umiacs.umd.edu/data/vc f/ [10] Ramankutty N and Fole y JA 1999 Glob Bio geochem Cycl 13 997 -1027. [online] URL: http://www.sage. wisc.edu/download /potveg/global_po tveg.html
Original Paper
Loading high-quality paper...
Comments & Academic Discussion
Loading comments...
Leave a Comment