The Application of a Data Mining Framework to Energy Usage Profiling in Domestic Residences using UK data
This paper describes a method for defining representative load profiles for domestic electricity users in the UK. It considers bottom up and clustering methods and then details the research plans for implementing and improving existing framework appr…
Authors: Ian Dent, Uwe Aickelin, Tom Rodden
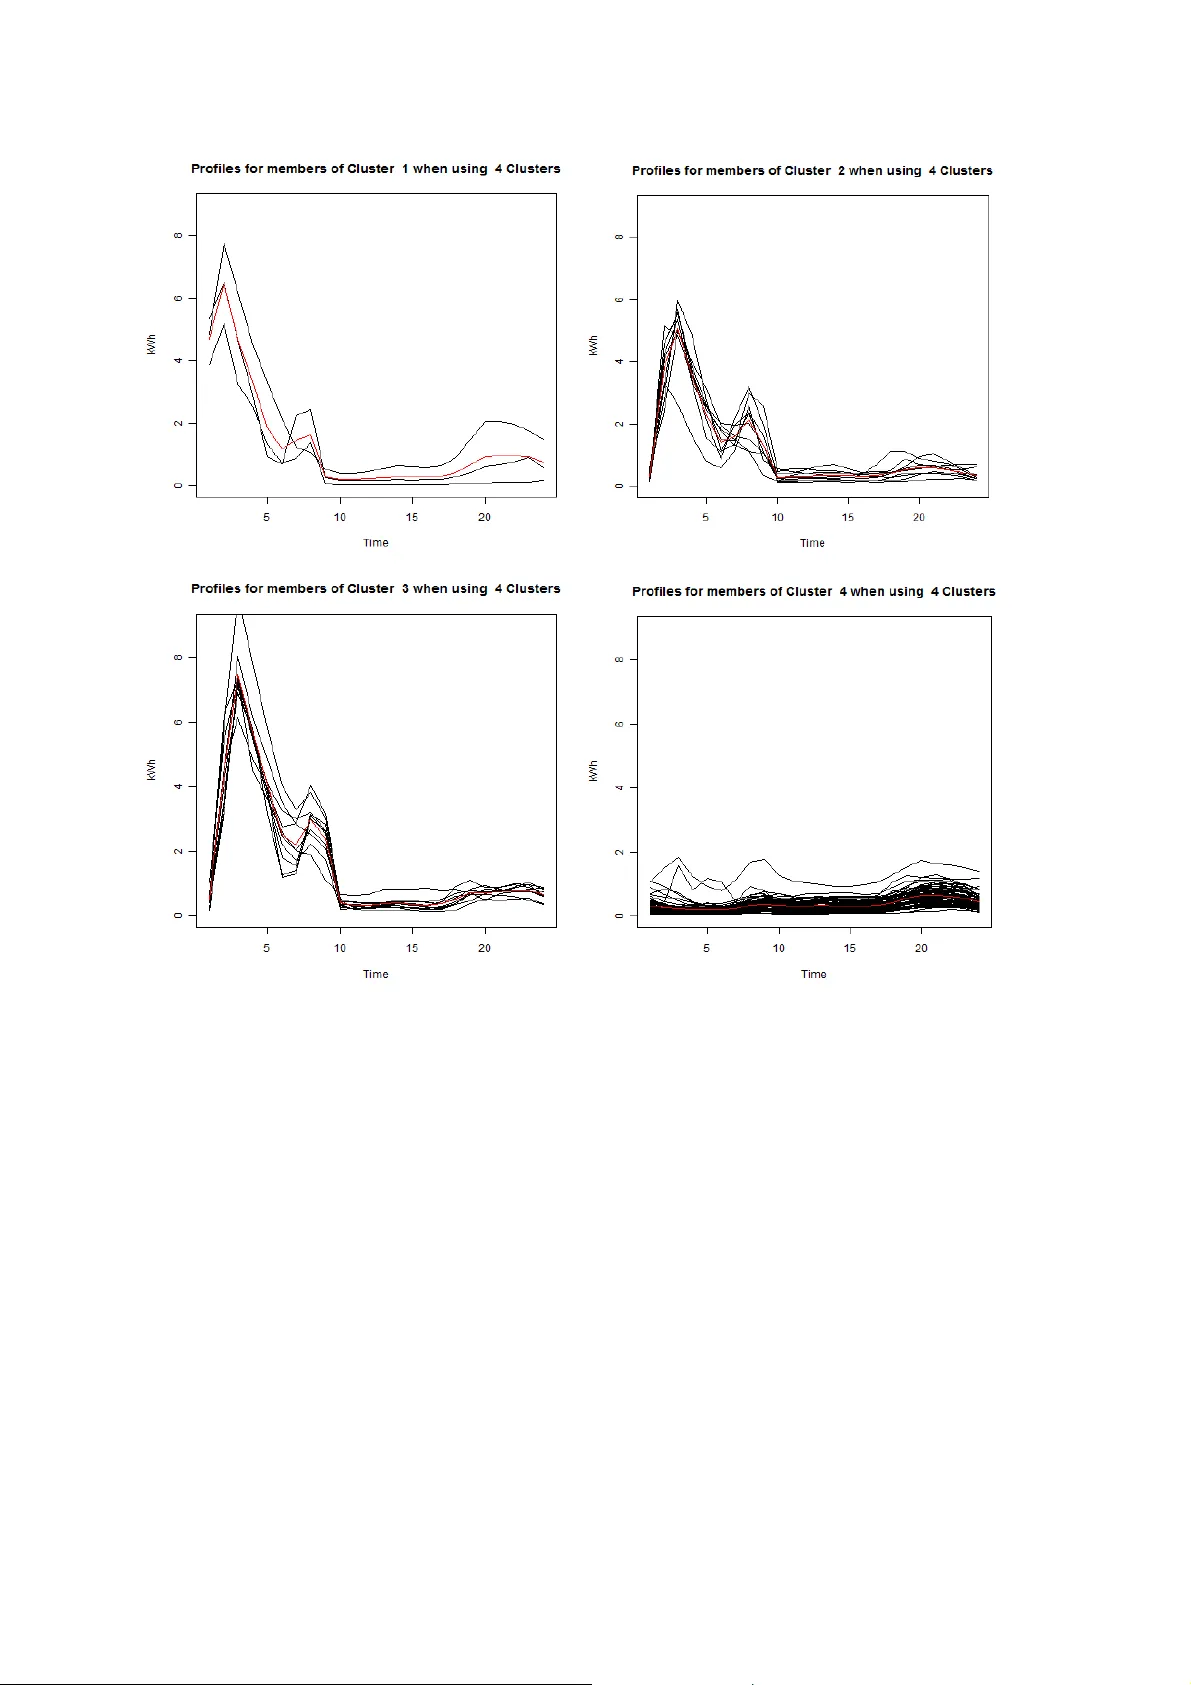
1 Proceedings of the Research Stude nts’ Conference on “Buildings Don’t Use Energy, Peo ple Do?” – Do mestic Energy Use and CO 2 Emissions in Ex isting Dw ellings 28 June 2011, Ba th, UK THE APPLICATION OF A DATA MINING FRAMEWORK T O ENERGY USAG E PROFILING IN DOMESTIC RES IDENCES USING UK DATA Ian Dent 1 , Uwe A ickelin 2 , Tom Rodd en 3 1,2 Intelligent Modelling and Analysis Group, University of Nottingham 1,3 Horizon Digital Economy Research Institute, University of Nottingham A bstract: This paper describes a method for defining representative load profiles for domestic electricity users in the UK. It considers bottom up and clustering method s and then details the research plans for implementing and improving existing framework approaches based on the overall usage profile. The work focuse s on adapting and applying analysis framework approaches to UK energy data in order to determine the effectiveness of creating a few (single figures) arche typical users with the intention of improving on the current methods of determining usage profiles. The work is currently in progress and the paper details initial results using data collected in Milton Keynes around 1990. Various possible enhancements to the work are considered including a split based on temperature to reflect the varying UK weather conditions. Keywords: Load profiles, clustering, data mining, electricity markets, demand-side 1 Introduction The UK electricity market is moving towards having the ability to provide more targeted and more complicated tariff offers for custome rs in order to provide many benefits including maximising the efficiency of the supply process. (DECC, 2009) shows that the provision of Smart Meters will allow greatly increased analysis of a customer's electricity usage and provide the ability to make customised offers on pricing and availability in order to change customer behaviour (for example, to minimise usage during pea k periods) or to incr ease efficiencies in the electricity supply chain in meeting the predicted demand. (Ofgem, 2010 ). The identification of typical electrical usage pattern s within households is necessary as a starting point for: 1 Ian Dent, ird@c s.nott.ac.uk (corresponding author) 2 Professor Uwe A ickelin, uwe.a ickelin@nottingham .ac.uk 3 Professor T om Rodden, tar @cs.nott.ac.uk 2 • Assessing the impact of any initiatives to reduce overall energy usage in order to discover the amount of overall reduction which occurs du ring different times of the day. • Allowing accurate aggregation to provide a pattern of total demand to be met by supply side generation and transmission. The work in progress forms part of a “demand side maximisation” project and will focus on identifying typical usage profiles for households and then clustering them into a few archetypical profiles with similar kinds of customers grouped together. Differences between an individual household profile and that of others within the same group can be used to suggest energy usage behaviour chan ges to reduce overall electricity usage or to improve electrical eff iciencies possibly by time shifting particular appliance usage. In addition, particular groups (for e xample, large users during peak times) can be identified for targeting for reduction initiatives. The work focuses on the daily variances of a household’s electricity usage averaged over appropriate weekly, monthly or seasonal periods. Investigation of consumers' usage of electricity in order to determine similarities between types of consumers requires that the day's usage pattern is summarised in some way such that it can be compared with others. The "shape" of the usage pattern (e.g. little night usage, peak around breakfast, little usage during the day and then a peak during the evening period) needs to be determined. The main purpose of the work is to investigate whether it is possible, using a clustering approach, to find representative daily usage prof iles for a population of domestic residences in the UK and to investigate separation between the discovered typical profiles. 2 Profiling Approaches A “bottom-up” approach can be taken to generating a rep resentative load profile where the load generated by individual appliances is aggregated to give the overall household usage pattern. This is explored by (Capasso et al., 1994) and (Paatero & Lund, 2006) with more recent work done in the UK by (Richardson et al., 2010). W ith a bottom up model, each electrical load within the household can be documented and new, possible households with varying mixes of appliances can be cre ated. An overall view of total load can then be ca lculated by aggr egating the individual appliances and electrical loads over the household and then over many households. This approach is suitable for investigation using a simulation approach as the numbers and usage of each type of appliance and household t ype can be modified and then run in a simulation in order to determine the overall elect ricity usage under a given set of input parameters describing the app liance types and usage times. A “top-down” approach can be taken by analysing the overall electricity usage of the household without regard to usage of particular app liances or electrical circuits. The overall shape of the daily usage pattern can be analysed using data mining tools and measures of similarity to other households o r other times (previous or future days) for the same household can be calculated. 3 (Ramos & Vale, 2008) present a methodology to characterise new electricity customers into similar groups based on their load profiles (daily usage patterns). In order to reduce the amount of data, the load profiles for a given custome r for a given type of day (weekend, weekday, or holiday) are combined to give a few representative profiles for that customer. For their case study in the paper, two types of day were considered (weekend and weekday) so that each of the 208 consumers are allocated 2 representative load profiles.. (Electricity Association, 1997) identifies a process for defining the details of 8 different standard usage profiles for the UK which are listed in Table 1. Table 1: Profile Classes Profile class Description Class 1 Domestic Unrestricted Customers Class 2 Domestic Economy 7 Customers Class 3 Non-Domestic Unrestricted Customers Class 4 Non-Domestic Economy 7 Customers Class 5 Non-Domestic Maximum Demand (MD) Customers with a Peak Load Factor (LF) of less than 20% Class 6 Non-Domestic Maximum Demand Customers with a Peak Load Factor between 20% and 30% Class 7 Non-Domestic Maximum Demand Customers with a Peak Load Factor between 30% and 40% Class 8 Non-Domestic Maximum Demand Customers with a Peak Load Factor over 40% Of these eight, only two refer to domestic properties although the profiles take into account the season and the day of the week. As an example of the standard profiles, Figure 1 shows the profiles for autumn for weekdays, Saturday and Sundays both for Economy 7 customers and non-Economy 7 customers plotted as 48 half hou rly readings over the day. 4 Figure 1: Economy 7 and non Economy 7 households in autumn (Figueiredo et al., 2005) details the usage of Self organising maps and k-means clustering to define nine typical load profiles where the data is considered separately for weekdays and weekends and for each season. These clusters are then used as to classify, using C5.0 (Quinlan, 1993), data from the Portugue se electricity market consisting of 165 consume rs in order to demonstrate the effectiveness of the clustering technique. Various differing approaches have been taken to the def inition of profiles in countries in Europe. As an example, in Croatia, (Marijanic & Karavidovic, 2007) deta il a top down and a bottom up approa ch and after listing some of the issues conclude that a top down approach with each domestic customer having the same profile (scaled to total annual load) is the only practical short term solution. The bottom up approach provides for a detailed build up of an overall prof ile and also provides insight into the reasons for the profile shape but does require a h igh level of monitoring within households so that each appliance and electrical circuit can be identified and aggregated. The deta il available wi th this approach suggests it is preferable but the necessarily complex monitoring is likely to lead to a small sample population for analysis and hence over reliance on a few monitored households. It may not be possible to sample a sufficiently diverse popu lation in order to gain a representative profile of the geographic area and hence aggregation may lead to errors. The analysis of the overall electricity usage (as measu red at the meter or at a single monitor) provides for a much simpler data collection method and is likely to lead to much higher numbers of households within the sample population due to the ease of collection. For this reason, the analysis of the overall electricity usage profile has been chosen as the focus of this work. 3 Methodology This paper describes work in progress to apply the top-down framework approach detailed in (Figueiredo et al., 2005) to UK data and to extend and adapt the framework for UK specific conditions. The Figueiredo approach includes the following stages: Cleaning of the data in order to cope with missing data and outliers in the data. Normalisation of the data to make differing readings compa rable. Splitting of the data into typical types of day such a s w eekday, weekend, holiday, hot day, etc. The Figueiredo work concentrates on weekend and weekday split and seasonal split only. Creation of representative daily load profiles. Various app roaches can be taken at this stage and Figueiredo uses averaging across all available days within the day type and season. 5 Application of a number of clustering techniques in order to group the data into a pre-defined number of clusters and then the defin ition of a representative load profile for each cluster. The planned research on the UK data will review each of these steps and explore differing modifications that may be possible to impro ve the framework and its applicability to the UK electricity market. The data used in this study is from an area of Milton Keynes, UK which was created in order to demonstrate various energy saving initiatives. The data was originally collected in 1988-91 by (Edwards, 1990) but was then stored on floppy disks which deteriorated physically and some of the original data has been lo st. The original data disks were rescued and, where possible, regenerated by Steve Pretlove of UCL and, more recently, by Alex Summerfield with the work detailed in (Summerfield et al., 2007). The datasets have been made available in the UKERC data store. The data is provided by the UKERC in the forma t of comma separated files with each dwelling having its own file of data. The energy data for the dwelling has been stored with some environmental data (e.g. rainfall, wind speed) for each hour that the energy data has been collected. All environmental data was loaded into a separate table as the data is dependent on the geograph ic location (i.e. Milton Keynes) rather than each individual house. The original data was stored with a record for every hourly reading per property but it is more useful to store all the readings for a given day/property together in order that a profile of the usage over the day can be examined. MySQL was used to reshape the data with all the data for timed electricity meter readings bein g stored in a single table. Some of the data readings are missing either due to the way in which the data was recovered from floppy disks or be cause of issues with the original collection of the data. For an initial view of the data, it was decided to omit all the days which contained a missing reading. However a method of replacing the missing values will be examined in future work based on the a lg orithm of: Calculate the average reading for a given property and given hour in the day from all the data with good readings. For each day with missing data, examine the data that is pre sent and, by comparing with the overall average, calculate a measure of the day bein g considered as a fraction of the average day. Create missing data using the calculated fraction of the a verage day by multiplying the calculated fraction by the overall average for that hour of the day. The extension of this method by calculating averages fo r di fferent kinds of da ys (e.g. weekend and weekday, hot day) and replacing the data using the appropriate day type will also be researched. Investigation is planned into various def initions of similarity between load profiles. The definition of “similar” is very dependent on the u se being made of the results and 6 various approaches will be investigated. For example, two households may have a similar shape of daily usage (e.g. high in morning, low during day, high late in the evening) but with very different total u sage figures (i.e. the amplitude of the two household profiles varies). The shape of the pattern is often the ke y information as, for example, two consumers could have a similar usa ge pattern but one prefers a much warmer house and thus their actual energy readings are higher. If the analysis is to identify households using electricity at similar times across the day then the two households could be assessed as “similar”. However, if the intention is to identify households using significantly more electricity than their neighbours then these two households should be seen as dissimilar. The splitting of the data into differing “types” of day (e.g. weekend, holiday) will be extended by making use of the environmental data to allow differentiation based on wind speed (i.e. windy days versus calm da ys) or on temperature (i.e. hot versus cool days) rather on the blunter approa ch of splitting by season. With the variability of the UK weather this may provide more accurate clusters than splitting purely by season. 4 Initial Results Initial investigation of the framework approach has been done u sing the Milton Keynes data which consists of 56601 fully populated rows and 7420 rows with errors representing data from 93 properties. Each row represents 24 hourly read ings across the day for a given household. Table 2 shows the variability in valid days of readin gs for the properti es: Table 2: Analysis of readings Minimum number of readings per property Maximum number of readings per property Mean number of readings per property Valid readings 199 700 608.3 All readings 281 819 688.4 This shows that numbers of readings vary from 199 days to 700 da ys - a large difference which means that averaging over all the properties should be done carefully. In a lot of households, there will be no data for particular dates and thus the averages for some dates may be based just on those properties with long collection periods and many valid readings. The average hourly readings for each property were calculated over all valid data and then clustering (using k-means) was used in o rder to identify clusters of properties with a similar usage profile. The k-means clustering method relies on a random starting situation and requires the numbe r of clusters as an input. In order to minimise the effects of the random starting point, the clu stering algorithm w as run 1000 times with differing random starting points and the best so lutions taken. 7 Examination of the results shows that the large number of runs allows the same optimum solution to be found regardless of the initial random seed. In order to find the best number of clusters to input to the algorithm, a series of clustering runs were done with cluster numbers from 2 to 10. The results of this can be seen at Figure 2. Figure 2: Analysis of Cluster Counts The within cluster sum of squares was calculated for e ach of the input numbers of clusters. As the number of clusters increases, the total sum of squares will decrease (with the extreme example of each instance being in its o wn cluster w ith a tota l “within cluster sum of squares” being 0) and the graph at Figure 2 should be examined to find an obvious "elbow" that denotes an app ropriate number of clusters. W hilst n ot strongly obvious, the elbow in the graph can be seen to be at number of clusters=4 and this was taken as the optimum number of clusters for further analysis. The results of the clustering exercise on the Milton Keynes data are displayed at Figure 3 with the representative profile fo r the given cluster plotted in red and the average (over all valid days) profile for each of the households allocated to that cluster in black. The representative profile is that of the centro id calculated by the k- means clustering technique and is the profile that minimises the sum of squares between the centroid and the members of that cluster. 8 Figure 3: Profiles of members of each cluster 5 Analy sis The numbers of households in each cluster show a large number within cluster4 which appears to be the cluster of households not using Economy7. The other 3 clusters have much fewer households and refle ct differing Economy7 users and the differing clusters may be indicative of u sing d ifferent appliances with high loads (for example, hot water heating with an immersion heater). The graphs show that the clustering approach has led to grouping of households with similar shape profiles but with varying total amounts of electricity usage. For example, cluster1 shows similar shapes but a fairly wide spread of kW h readings. The industry standard load profiles (see Figure 1) are significantly different f rom the typical load profiles identified but further investigation is needed in order to split the data by day type and season in order to allow more valid comparisons. The industry load profiles suggest a lower overall usage of elect ricity than that found in Milton Keynes in 1990 and may be a result of changes in domestic appliance 9 efficiencies and how household behaviours have changed over time. In particular, storage heaters are much less popular than they were in the early 1990s. 6 Conclusions and Further Work The differing approaches to building a household load profile have be en considered with a “bottom-up” approach considered to be more explanatory of the makeup of the overall profile and providing more variability for “what-if” analyses but with a much higher effort requirement during data collection. For this reason, an approach focusing on the overall electricity usage of a househo ld (as measured at a single meter and requiring no labelling of the usage by the householders or others) is preferred due to the much higher numbe r of households that can be monitored. A framework approach to determining clusters of similar electricity usage patterns has been laid out together with initial simple results of the clustering. Enhan cement of the framework will be undertaken in future work with emphasis on m issing v alues, the differentiation of recorded days into different types of day, and the differing definitions of similarity that could be used when assessing how to group households. Comparison of the clustering approaches and mea surement of the suitability of each clustering algorithm will be unde rtaken. The same approach will be applied on mo re recent UK data which is likely to have less usage of Economy7 (night time) electricity usage due to changing tariffs since 1990 and the much reduced usage of storage heate rs. The variable climate within the UK suggests that introducing temperature into the way in which the types of days are def ined is w orthy of investigation. Other countries may have very predictable daily temperatures (and hen ce heating usage) based on the seasons whilst the UK weather may require heatin g usage during the summer and also sometimes provide very warm days during winter. The differing ways of defining day types will be investigated and analysis done on how differing splits lead s to differing or similar membership of the resulting clusters. 7 A cknowl edgements This data was accessed through the UK Energy Research Centre Energy Data Centre (UKERC-EDC). Our acknowledgments to the Building Research Establishment, which provided access to the original 1990 da ta set from Milton Keynes Energy Park, and to Bartlett School of Graduate Studies, Universi ty College London for processing and cleaning the raw data. This work is possible thanks to EPSRC grant reference EP/I000496/1. 8 References C APASSO , A., G RATTIERI , W ., L AMEDICA , R., & P RUDENZI , A. 1994. A bottom-up approach to residential load modeling. Power Systems, IEEE Transactions on , 9 (2), 957–964. DECC. 2009. TOWARDS A SMARTER FUTURE: GOVERNMENT RESPONSE TO THE CONSULTATION ON ELECTRICITY AND GAS SMART METERING. 10 E DWARDS , J. 1990. Low energy dwellings in the Milton Keynes Energy Park. Energy Management , 26 , 32–33. E LECTRICITY A SSOCIATION . 1 997. Load profiles and their use in electricity settlement. UKERC . F IGUEIREDO , V., R O DRIGUES , F., V ALE , Z., & G OUVEIA , J.B. 2005. An electric energy consumer characterization framework based on data m ining techniques. Power Systems, IEEE Transactions on , 20 (2), 596–602. M ARIJANIC , T., & K ARAV IDOVIC , D. 2007. Load profiling in an opening electricity market. Pages 1–5 of: AFRICON 2007 . IEEE. O FGEM . 2010. Project Discovery - Options for delivering secure and sustainable energy supplies . P AATERO , J.V., & L UND , P.D. 2 006. A model for g enerating household electricity load profiles. International journal of energy research , 30 (5), 273–290. Q UINLAN , J. R OSS . 1993. C4.5: programs for machine learning . San Francisco, CA, USA: Morgan Kaufmann Publishers Inc. R AMOS , S., & V AL E , Z. 2008. Data Mining techniques to support the classification of MV electricity customers. Pages 1–7 of: Power and Energy Society General Meeting-Conversion and Delivery of Electrical Energy in the 21st Century, 2008 IEEE . IEEE. R ICHARDSON , I., T HOMSON , M., I NFIELD , D., & C LIFFORD , C. 2 010. Domestic electricity use: A high-resolution energy demand model. Energy and Buildings , 42 (10 ), 1878–1887. S UMMERFIELD , AJ, L O W E , RJ, B RUHNS , HR, C AEIRO , JA, S TEADMAN , JP, & O RESZCZYN , T. 2007. Milton Keynes Energy Park revisited: Chan ges in internal temperatures and energy usage. Energy and Buildings , 39 (7), 783–791.
Original Paper
Loading high-quality paper...
Comments & Academic Discussion
Loading comments...
Leave a Comment