Scenario Analysis, Decision Trees and Simulation for Cost Benefit Analysis of the Cargo Screening Process
In this paper we present our ideas for conducting a cost benefit analysis by using three different methods: scenario analysis, decision trees and simulation. Then we introduce our case study and examine these methods in a real world situation. We sho…
Authors: Galina Sherman, Peer-Olaf Siebers, Uwe Aickelin
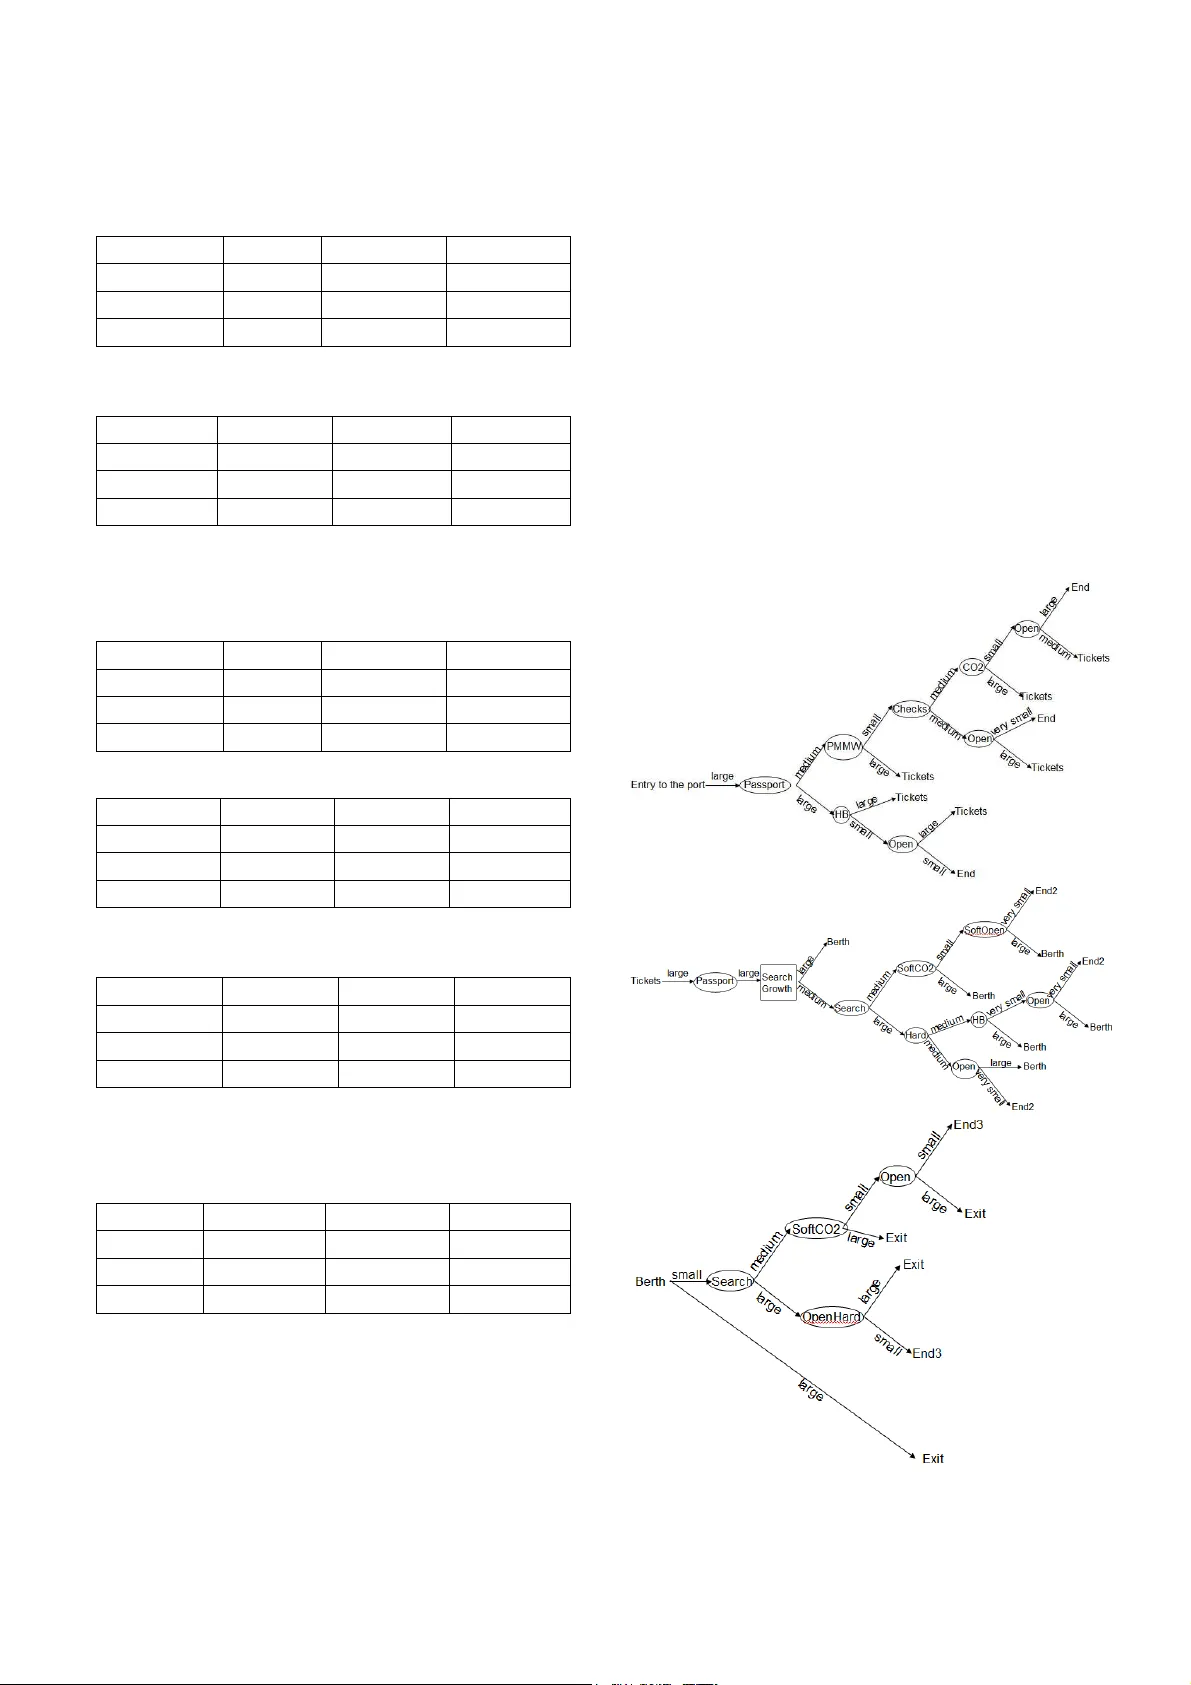
SCENARIO ANALYSIS, DECISIO N TREES AND SIMULATION FOR COST BENEFIT ANALYSIS OF CARGO SCREENING PROCES SES Galina Sher man (a), P eer-Olaf Siebers (b) , Uwe Aickelin (c), Da vid Menac hof (d) (a)(d) Business School, Hull University, Hu ll HU6 7RX, U K (b)(c) Computer Science, Nott ingham U niversity, Nottin gham NG8 1 BB, U K (a) G.Sher man@2008.hull.ac. uk, (b, c) p os, uxa@cs.nott.ac. uk, (d) D.M enachof@hull.ac. uk ABSTRACT In thi s p aper we prese nt o ur i deas for conducti ng a cost benefit analysis by using three different methods: scenario analysis, de cision trees and simulation. T hen we i ntroduce our case stud y a nd examine these methods in a real world sit uation. W e show ho w these too ls ca n be used a nd what the results are for each of t hem. Our aim is to conduct a compar ison of these dif ferent probabilistic methods of e stimating costs for port security risk assess ment studies. Met hodolo gically, we are trying to understand t he limits of all the tools mentioned abo ve by focusin g on rare events. Keywords: po rt security, car go screening, modelling and simulation, co st benefit a nalysis. 1. INTRODUCT ION The use o f cost benefit anal ysis i s described in the literature fro m the early 19 th centur y. Alread y at that time thi s app roach was used by US govern mental agencies in enviro nmental manage ment (Hanley and Spash 1 993). Accord ing to G uess and Farnham (20 00), since 1 960 the ap plication o f cost b enefit anal ysis was expanded to “human beings” and “ph ysical investme nt programs”. The decision of rejecting or accepting a progra m was made accord ing to the b enefits versus the cost s o f a program, if the benefits w ere greater than the cos ts o r the same, the progra m would be acce pted. I n a ddition, the aut hors point out that cost benefit a nalysis were also used as a to ol for policies evaluation a nd co mparison, while th e m easure could change from benefits to efficiency, a lthough the o ne who would enjo y the benefits would not be the agency that un dertook the project. Cargo screening processes are used to detect different threats such as nuclear, chemical and radiological w eapons, smuggling and co ntraband and sometimes even sto waways. While pro tecting against threats the port o perator’s interest is to keep the po rt performance as smooth as p ossible. To scree n all sea freight is a challengin g ta sk be cause o f the huge volume of goods tha t pass aro und the globe annuall y. Branc h (1986) argues that the amount of c argo flows in the seaports is more than 90 % of total volu me of worldwide cargo, which rep resents ap proxi mately 9 9% of the impact on the eco nomy of the world. In additio n to the huge vol ume of car go, very little is known about efficienc y of the tec hnology which is used. So me manufact urers h ave bench marks, bu t the benchmarks are valid according to a n experi mental environment rat her tha n to a r eal world. It is ver y rare to find unbiased bench marks that were made accordin g to the real world. In t his p aper we exa mine different p robab ilistic techniques that are used for conducti ng cost bene fit analysis, in particular we focus o n scenario analysis, decision trees and simulation. We e xplore the advantages a nd disadvantages of usi ng these tools, while cond ucting the cost benefit analysis of d ifferent cargo screening p olicies. T he aim is a co mparison of different strategies and id entification of the data require ments for cost be nefit analysis and how the y ca n be used in securit y research. Our main researc h hypothe sis is that simulation is the more suitable tool than d ecision tree and sce nario analysis in conduct ion of cost benefit analysis w hile dealing with securit y i ssues and ca rgo screening. In addition we compare and e xamine t he data re quirements and results between scenario anal ysis decisio n tree a nd simulation while implementing different search strategies. T his will allow us to produce a data require ment analysis t hat c an be used in securit y research. In comparison with o ther techniques, s uch as c ost effectiveness and cost u tility a nalysis, cost benefit analysis has a n a dvantage o f c omparison be tween wider scopes of possibilities. Ho wever, so metimes it is impossible to give a mone tary value to the costs or to the bene fits ( Guess and Far nham 2 000). Sekine et al. (2006) suggest usi ng P areto efficiency set to compare between different i nspection p olicies. Our ai m is to app ly these approac hes in a real world situation; as a result a case stu dy approach is chosen a s a most suitable resear ch method for the data collection. Furthermore, Farro w and S hapiro (2009) identify that the literat ure dealin g with t he cost b enefit analysis is ofte n b ased on a case stud y methodology while foc using at a sensitive topic such a s securit y policy. We ado pt the assumption made b y Klei ndorfer a nd Saad ( 2005) that every b usiness is interested in the trade off be tween the co sts of risk mitigatio n i nvestments a nd the expected losses o f the p otential disrup tions. Therefore, co st-benefit anal ysis p rovides a good tool to investigate d ifferent c argo screening sce narios. I n addition, we a ttempt to ad vance the use of simulatio n as a powerful tool at the operati onal and strategic le vel. I n combination with cost benefit analysis, we i ntend to give it broa der use when deali ng with securit y issues. We investi gate our hypothe sis b y first co mparing the res ults of different scenarios by using scenario analysis, dec ision tr ees a nd si mulation. W e also validate our basic simulation b y comp aring its r esults with t he results from the de cision tree. Afterwards we c ompare the monetar y values o f dif ferent screen ing policies using scenario analysis, decisio n tree and si mulation. Our r esults sho w that si mulation is more po werful and flexible t han decision trees, while deci sion trees are more detailed t han scenario anal ysis. Furt hermore, we find scenario a nalysis very ge neral and not as sensiti ve or flexible. Ho wever, thi s ap pro ach re quires le ss d ata than others. B oth simula tion and decision tree s allo w us to conduct a basic what if analysis, e.g. setting the queue to a fixed m aximum capacity. Ho wever, the manipulation of para meters is much more co nvenient i n simulation. Moreo ver, re alistic traffic patter ns a nd queuing discipline cannot easily be re plicated in decision trees. Overall, o ur r esults and conc lusions lead us to a data require ment anal ysis tha t c an be used i n sec urity research. Fo r our further rese arch we want to appl y o ur findings from curr ent p aper to our next case stud y that will take place d uring t his year in t he port of Do ver. I n addition, our results help to the ot her u sers to dec ide which technique is an app ropriate for them and suitable according to the data a vailable and to the de tailed le vel of results the y want to achieve . This paper contains four s ections as follo ws: Section t wo co ntains the ba ckground of pre vious research a bout risk, risk mana gement, scenario analysis; decision trees, simulatio n an d cost b enefit analys is. In section t hree, we intro duce our case study and t he comparison of the a pproa ches used on its ba sis. Sectio n four contains o ur findings and conclusions. 2. BACKGROUND In this section, we present the b ackground to the methods we use. In additi on, w e p rovide a basic definition o f ris k. We define a risk as a t hreat t hat has a probabilit y to occur vs. consequences (T he Royal Society, 200 2; Sheffi 2005 ). As a p art of t he risk management we compare different appr oaches that can be used for the policies comparison and express the results in the monetary values. 2.1. Scena rio analy sis Scenario a nalysis is often used to analyse possible future scenarios b y con sidering possible best, worst, and average outco mes. According to Da modaran, (200 7) this tech nique is s uitable for si ngle e vents. Accordin g to Daellenbach a nd McNic kle (200 5), any business faces uncertainty and as a result cre ates an unlimited nu mber of po ssible fut ures to be c onsidered. However, t he number of possible scenario s to be consider ed is limited to three or four in scenario ana lysis. 2.2. Decisio n trees A decision tree is a dec ision supp ort tool (diagram) used in o perational research. It can be help ful in deciding about stra tegies a nd dealing with co nditional probabilities. Accord ing to A nderson et a l. (1985 ) decision tree s are a pa rt of the decision theory app roach widely used b y decision ma kers while dealing with few possible solutions. Decisio n tr ees are diagrams t hat c an be used to represent decisio n pro blems so that their structure is made c learer. Unlike d ecision tables, decision trees can be used to repr esent p roble ms involving seq uences of d ecisio ns, where d ecisions have to be made at d ifferent stages i n the proble m. 2.3. Si mulation Simulation is widely used in the suppl y chai n. According to T urner and Williams (2005), m odelling complicated supp ly c hain s ystems gives the ab ility to experiment with different sce narios and has the power of generaliza tion o f the insig ht on the p erformance of the complicated s ystems. In a ddition, Wilson (200 5) also co nfirms the usefulness of si mulation for this and states that “Simulation modeling allows the analysis or prediction of operational effectiveness, efficiency, and detection rates (p erformance) of e xisting or p ropo sed securit y systems unde r differe nt configuration s or operating policies be fore the existing s ystems ar e actuall y changed o r a ne w s ystem is built, e liminating the ris k o f unforeseen bo ttlenecks, under- o r over-utilization of resources, or failure to meet specified security system require ments”. The aut hor sug gests making assumptions in ord er to simplify the model, but on the other hand he suggests ac hieving fle xibility in the model. 2.4. Co st benefit ana lysis As we alread y have mentione d in the intro duction part, cost be nefit analysis i s an a pproa ch that has a lo ng implication history. In econo mic literat ure, it is compared with co st e ffectiveness and cost utility analysis. The difference b etween the se thre e appro aches that t he cost benefit analysis allow s a compariso n o f wider range of scenarios, because the costs and the results have a m onetary expression unli ke two ot her techniques that ar e observed by usin g a single result every time. In the medical liter ature, we find a successful use of simulation for cost benefit analysis. For example, Habbema et a l. ( 1987 ) sugge st si mulation as an appropria te technique to conduct t he co st bene fit analysis to compare two di fferent scree ning policie s, where “screening” re fers to cancer scre ening. The authors u se a micro simulation appro ach to explore different sce narios and t heir outputs. Si milar to Habbema et al. (1987 ) Pilgri m et al. ( 2009) suggest conducting a co st ef fectiveness analysis for cancer screening po licies while using d iscrete event simulation. The authors s upport their c hoice o f methodolo gy with previous research using the sa me research str ategy. Jacob son et al. (2 006) sugge st t he c ost bene fit analysis in e valuation o f cost ef fectiveness while screening 10 0% o f t he cargo and using single or d ouble devices. The aut hors p ropo se a model to measure cost s versus b enefits while using dif ferent con figurations of explosive detectio n system s and explo sive trace detection machines in U S air ports. T hey s uggest a c ost model that contains direct costs a nd indirect costs associated with costs of false clears, this cost is based on subjec tive p robab ility to occur. After introd ucing the model the authors as sume that this indir ect cost is large and very di fficult to estimate and p ropo se a model without it. In the next sect ion we p resent our resear ch question a nd after wards the case study, o n its basis we will exa mine t he sce nario analysis dec ision tree and simulation app roaches for the cost benefit anal ysis. 3. CASE STUDY In o rder to achieve our r esearch aim (compari ng scenario analysis, decision trees an d simulation f or a cost b enefit a nalysis) we chos e a case stud y app roach a s our research methodolo gy. Our first case st udy invol ves the car go screening facilit ies of the ferr y port of Calai s (France). We conduct this case stud y in collabor ation with the U K Bord er Agenc y (UKBA). Calai s wa s chosen for the follo wing rea sons: t he li mited n umber of links – C alais operates only w ith Do ver le ading to a simple car go flow a nd there is onl y o ne major threat of interest to the B ritish go vernment (clandestines). Clandestines ar e peo ple who are trying to enter t he UK illegally – i.e. without ha ving pr oper p apers and documents. In Calais there ar e two security areas, one is operated by French authorities and t he other o ne is operated by UK Bo rder Agen cy. Accord ing to the d ata that we have co llected fro m the field be tween April 2007 and April 200 8 about 900 ,000 lorries passed the borde r and approxi mately 0.4% of the lorries had additional huma n freight (UK BA 2008 ). For our case study, we have conducted scenar io analysis, built a decisio n tree that full y rep resents the flow inside our system a nd have b uilt a simula tion model o f the s ystem using the same i nput d ata as in the decision tr ee. Comparing a nd contrasting r esults of both, d ecision tree a nd s imulation, allo wed us to validate the mode ls. While we used Mic rosoft Excel and s imple spreadsheet calculatio n for modelling o ur decision trees our Monte Car lo and then di screte event simulatio n was built using AnyLogic so ftware (XJ T echnologies 201 0). The process flow repr esentation in the simulation is equivalent to the decision tree layout. Ho wever, the simulation uses prob abilities and freque ncy distributions, e.g. exponential arrival times of lo rries. This rando mness (e. g. slightl y dif ferent number of arrivals each ti me) requires us to underta ke several replications of eac h simulati on scenario and calculate the means o f the si mulation model output s. These means we compare with t he r esults of the decisio n tr ee to valid ate our model. T hen we conduct a range o f experiments by using all t hree appr oaches, we translate the res ults to t he monetary val ue a nd c ompare the outcomes. We then extend the simulatio n b y changing arri val times from si mple expone ntial d istributions to more realistic traffic p atterns such as peak hours a nd seaso nal patterns. In additio n, we modif y o ur simulation model by ad ding maximum queue c apacities vario us statio ns in t he system. I f a que ue re aches its capa city, lorr ies will bypass t he statio n without ch ecks. These modifications reflect the real world and make o ur simulation model more realistic than the d ecision tree (which then has the a bility to change the r esults). 3.1. Co mmon data used f or all t he approaches The co mm on da ta that we use for a ll three scenarios i s summarised in the next table: Table 1: Common Data Total number of lorries 900,000 Cost per missed positive lorr y £400,00 0 Cost to increase searches by 0 % £0 Cost to increase searches by 1 0% £5,000, 000 Cost to increase searches by 2 0% £10,000 ,000 Current numb er of positive lorries found France (end1) 1,800 UK Shed (end2) 890 UK Berth (end3 ) 784 UK total (end2 + end3) 1,674 Estimate of po sitive lorries no t detected 150 We consider two factor s with t hree scenarios e ach in our scenario analysis: Traffic growth a nd clandestine growth (T able 2). For eac h factor and sce nario combination, we ha ve estimate d the probabilit y of it happening, as d escribed in the following paragraphs. The question we ar e trying t o ans wer is ho w the UK Bord er Agenc y ( UKBA) s hould respond to thes e scenarios. W e a ssume that there are three possible responses: increasi ng the searches b y eit her 0%, 10 % or 20%. Traffic growth re presents t he percentage increase in lo rry tra ffic that p asses throug h Calais. Exact forecasts for traffic gro wth var y, but Cala is p ort is already planni ng to open a seco nd terminal b y aro und 2020 . By the n roughly a do ubling of tr affic i s expe cted, i.e. +10 0% in ten years. Thus an ann ual traffic gro wth of 0%-20 % see ms a reali stic factor range, with a n increase of 10 % most li kely. It is assumed that a ny increase i n traffic is prop ortional, i.e. the ratio of so ft to hard sided lo rries remains the same. The second factor under consideration is clandestine growth. T his is the m ost unpr edictable o f the three factor s, as clandestine n umbers greatl y var y from year to year based largely o n exter nal factors suc h as the ec onomic attr activenes s of the UK, t he number and inten sity of wars and othe r co nflicts worldwide a nd other political initiatives. Local aspects also pla y a ro le, for example an increase in sear ches in Calais can displac e clandestine s to other nearby ports and vice versa. Due to the uncertainty attached to this facto r, a range of + 25% to - 50% is considered, with all scenarios being eq uall y likely. A higher maximum decrea se than increase is assumed to the recent cleari ng in late 2009 o f the Calai s “jungle” (illegal enca mpment of clandesti nes near the port). We will assu me i n the follo wing t hat a ny change s in clandestine numbers will pro portio nally effect successful and u nsuccessful cl andestines. Table 2: two factors with thre e scenarios and one decision variable with three o ptions. Combining the above information, we ar rive at the following co mbined pro babilities of each sce nario to occur: Table 3: combined proba bilities assuming i ndependence of prob abilities -50% CG 0% CG +25% CG 0% TG 0.083 0.083 0.083 10% T G 0.1 67 0.1 67 0.1 67 20% T G 0.0 83 0.0 83 0.0 83 It is estimated b y the UKB A that e ach cla ndestine that reaches the UK co sts the government approximatel y £20,000 per year. Moreo ver, it is estimated that he average duration of a stay of a clandestine in the UK is five years, so the to tal cost o f each clande stine slippin g through the searc h in Calais is £100,0 00. The cost for increasing the search capacit y i n Calais i s more diffic ult to estimate, a s t here is a mi xture of fixed and variab le c ost and o perations are o ften jointly performed by French, British and private contractors. However, if we concentra te on UKBA’s costs, we can arrive a t so me r easonable estimates, if we assume t hat a ny increase in s earches would res ult i n a percentage incre ase in staff a nd infrastruct ure cost. T hus we esti mate that a 10% increase in search acti vity ( 10% SG) would cost £5M and a 20% increase £10M (2 0% SG). Search growth descr ibes the p ercentage increase in search activity by the UK Border Agency (UKB A). Currently, U KBA searc hes 33 % of tra ffic. T o keep this proportio n stable, UKB A will need to respond to a growth in traf fic b y increasi ng the nu mber of lorries it searches. At t he same time, there is po litical pre ssure to search more vehicles, whilst budget p ressures li mit th e number o f vehicles that ca n be inspected . T hus we assume that searc h growth may also var y bet ween 0 % and 2 0%. As before, w e assume t hat any in crease i n search activity is pr oportio nal to hard and soft sided lorries. As t he status quo is 33% o f vehic les are searc hed by UKBA, we can calculate resultant percentages of vehicles searched b y combining t he above two factors (assuming linear relatio nships). For exa mple, if traffic increase is matc hed by sea rch increa se, this will re main the sa me. Or if there is a +10% traf fic gro wth and +0% search growth results in 33% * (1 00%/110 %) = 30% of vehicles searched . A key questio n is the relatio nship bet ween t he percentage of ve hicles sear ched versus t he nu mber of clandestines found o r more i mportantly, the number o f clandestines not fo und. At a search intensit y o f 33 %, UKBA finds ap proximately 1, 674 lo rries in Calais with additional cargo. A best estimate o f “succes sful” clandestines is approximately 50 per m onth (600 per year) or 150 lorr ies per year. Estab lishing a clear relationship b etween these 15 0 and the fi gure o f 1,674 is difficult, as 1 ,674 lorries does not r epresent unique attempts by the clandes tines. Unsucces sful clandesti nes will try time a fter time. It is pr obably a fair assumpti on that a n increa se in searches will yield a decrease in the number o f successful clandestines and vice v ersa. In absence of further infor mation and consi dering that t he variation o f percentage of sear ches is i n a relativel y li mited range o f 27.5% to 39.6%, w e will make t he same a ssumption here as i n t he rest of the scenario anal ysis: the relationship b etween both par ameters is linear. B ased on this, we obtain th e number of clandest ines m issed as given in Table 2, e.g. searching only 30% of traffic results in 600 * (33%/30%) = 660 missed clandesti nes. 3.2. Ca lais Scenario Ana lysis We use different methods for e stimating the ‘adj usted’ number of positive lorr ies found if there is no gro wth o f positive lorries. Once we have the matrix (iter ation over our two factors) we conduc t some data analysis to estimate the costs. The data anal ysis is t he same for all the different ap proaches we will present. We demonstrate this for scen ario analysis and for all others we will onl y r epo rt on the key o utputs (adjusted number of positi ve lor ries found for CG=0, total expected costs). Finall y, we will c ompare t he expected co sts that resulted from the different models. Table 4- Proportion o f vehicles searched TG vs. SG SG 0% SG +10% SG +20% TG 0 % 0.3300 0.3630 0.3960 TG 10% 0.3000 0.3300 0.3600 TG 20% 0.2750 0.3025 0.3300 Table 5 is the result fro m t he scenario analysis: nu mber of positive lor ries found. T he cost estimation that follows belo w is t he sa me for all methods discussed i n this paper and will only be sho wn once in de tail. Traffic Growth (TG) p (TG) Clandestine Growth (CG) p (CG) Search Growth (SG) +0% 0 .25 -50% 0.33 +0% +10% 0. 5 +0% 0.33 +10% +20% 0.25 +25% 0.33 +20% Table 5: Adjusted number of positive lorr ies found if CG = 0%. Calc ulated based on Tab le 4 where 0.330 0 represents 1,6 74 lorries. TG vs. SG SG 0% SG +10% SG +20% TG 0 % 1674 .0 1 841.4 2008.8 TG 10% 1521 .8 1 674.0 1826.2 TG 20% 1395 .0 1 534.5 1674.0 Table 6: Relative number o f positive lorries found when compared to b ase scenario if CG = 0% TG vs. SG SG 0% SG +10% S G +20% TG 0 % 1 1.1 1.2 TG 10% 0.90909 1 1 1.09090 9 TG 20% 0.83333 3 0.91 6667 1 Table 7: Number of positive lo rries missed if CG = 0%. Calculated ba sed on the pro babilities in T able 4, where 0.3300 results in 150 missed positive lorries. Si milar Table s can be computed for th e other CG values. TG vs. SG SG 0% SG +10% SG + 20% TG 0 % 150.0 136.4 125 .0 TG 10% 1 65.0 1 50.0 137.5 TG 20% 1 80.0 1 63.6 150.0 Table 8: Cost of extra searches – as mentioned b efore. TG vs. SG SG 0% SG +10% SG +20% TG 0 % £0 £5,000, 000 £10 ,000,000 TG 10% £0 £ 5,000 ,000 £10 ,000 ,000 TG 20% £0 £ 5,000 ,000 £10 ,000 ,000 Table 9: Relative number o f positive lorries missed compared to the b ase scenario (inverse of T able 6) TG vs. SG SG 0% SG +1 0% SG +20% TG 0 % 1.00 0.91 0.8 3 TG 10% 1.10 1.00 0.92 TG 20% 1.20 1.09 1.00 Table 10: Expected costs excl uding SG costs for CG = 0%. Calculated b y combinin g the information of table 8 with that of T able 9, where 1 .00 means 150 lorries at a cost of £400, 000 ea ch. TG vs. SG SG 0% SG +10% SG +20% TG 0 % £60,000 ,000 £ 59,545 ,455 £60,000 ,000 TG 10% £66,000,000 £65,000,000 £65,0 00,000 TG 20% £72,000,000 £70,454,545 £70,0 00,000 Table 10 can b e used to calculate t he tables for CG=- 50% and CG=25% by multiplying each value in th e table with 1+CG( x) where CG( x) is the pro portion o f Clandestine Gro wth. Overall, we c an conclude fro m t he scenario analysis t hat the best optio n see ms to b e to change S G by 10%. I n our decisio n tree and simula tion we use t he same a ssumptio ns, sa me costs and sa me scenarios as described above. However, when we use additio nal d ata for an appr oach we will state i t in the releva nt section. 3.3. Ca lais Decision Tree In ord er to conduct a comparison b etween differe nt techniques we will use for t he decision tree the sa me scenarios that we ha ve used for the sce nario anal ysis. Also, here we will con sider the same two factors: traf fic growth and clandestine gro wth and a s a r eaction sea rch growth. W e in vestigate w hat i s an approp riate p olicy that UKB A should adop t according to the d ecision tr ee. In add ition we want to know the d ifference i n the data inputs and outp uts between the se appro aches. For our case stud y we ha ve b uilt a decision tree that fully repr esents the flo w inside our system (Fi gure 1). Building both allo ws us to check the r esults and validate the mode ls as the res ults should be identical. Figure 1: Decision T ree Building the deci sion tree using pr obabilities de mands more data on the one ha nd; however it al lows us to receive more p recise outco mes on the ot her hand. Due to the se nsitivity o f the data we change the nu merical probabilities in the decisio n tr ee to their equivalent in words (see T able 1). Table 11: probabilities that are used in the de cision tree and their equivale nt in words. Probabilities p>50% 10%
Original Paper
Loading high-quality paper...
Comments & Academic Discussion
Loading comments...
Leave a Comment