Differential meta-analysis of RNA-seq data from multiple studies
High-throughput sequencing is now regularly used for studies of the transcriptome (RNA-seq), particularly for comparisons among experimental conditions. For the time being, a limited number of biological replicates are typically considered in such ex…
Authors: Andrea Rau (GABI), Guillemette Marot (INRIA Lille - Nord Europe, CERIM)
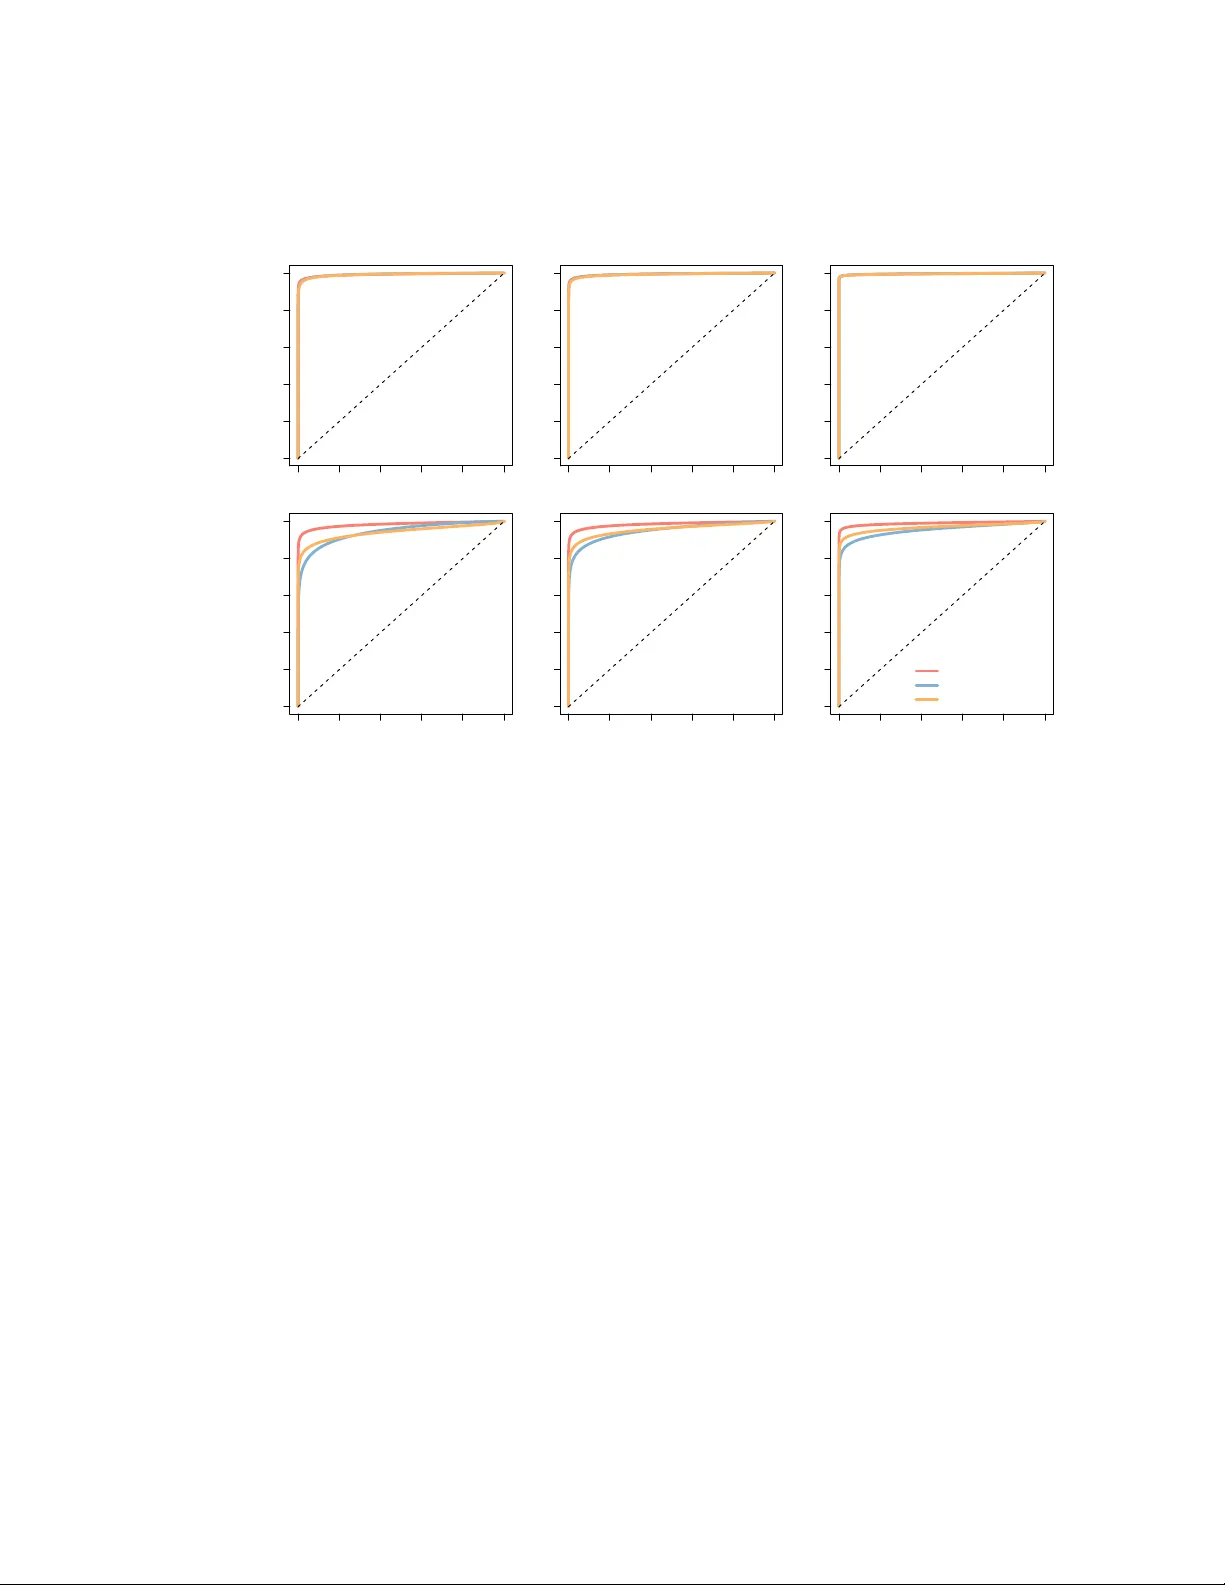
Differen tial meta-analysis of RNA-seq data from m ultiple studies Andrea Rau 1 , 2 Guillemette Marot 3 , 4 Florence Jaffr ´ ezic 1 , 2 June 13, 2013 1. INRA, UMR1313 G ´ en ´ etique animale et biologie in t ´ egrativ e, 78352 Jouy-enJosas, F rance 2. AgroP arisT ec h, UMR1313 G ´ en ´ etique animale et biologie int ´ egrativ e, 75231 P aris 05, F rance 3. Univ ersit´ e Lille Nord de F rance, UDSL, EA2694 Biostatistics 4. Inria Lille Nord Europ e, MOD AL ABSTRA CT Bac kground: High-throughput sequencing is now regularly used for studies of the transcrip- tome (RNA-seq), particularly for comparisons among exp erimental conditions. F or the time b eing, a limited n umber of biological replicates are typically considered in suc h exp erimen ts, leading to lo w detection p ow er for differential expression. As their cost contin ues to decrease, it is lik ely that additional follo w-up studies will b e conducted to re-address the same biological question. Results: W e demonstrate ho w p -v alue com bination techniques previously used for microarra y meta-analyses can b e used for the differen tial analysis of RNA-seq data from multiple related studies. These tec hniques are compared to a negative binomial generalized linear mo del (GLM) including a fixed study effect on sim ulated data and real data on human melanoma cell lines. The GLM with fixed study effect p erformed well for low inter-study v ariation and small num b ers of studies, but w as outpe rformed by the meta-analysis metho ds for moderate to large in ter-study v ariabilit y and larger num b ers of studies. Conclusions: The p -v alue combination techniques illustrated here are a v aluable to ol to p erform differen tial meta-analyses of RNA-seq data by appropriately accoun ting for biological and technical v ariabilit y within studies as well as additional study-sp ecific effects. An R pac k age metaRNASeq is a v ailable on the R F orge. Keyw ords : meta-analysis, RNA-seq, differential expression, p -v alue combination 1 1 Bac kground Studies of gene expression ha ve come to rely increasingly on the use of high-throughput sequencing (HTS) tec hniques to directly sequence libraries of reads (i.e., n ucleotide sequences) arising from the transcriptome (RNA-seq), yielding coun ts of the num b er of reads arising from eac h gene. Although the costs of HTS experiments contin ue to decrease, for the time b eing RNA-seq exp erimen ts are t ypically p erformed on v ery few biological replicates, and therefore analyses to detect differential expression b etw een tw o exp erimental conditions tend to lac k detection pow er. Ho wev er, as costs con tinue to decrease, it is lik ely that additional follow-up exp erimen ts will be conducted to re- address some biological questions, suggesting a future need for metho ds able to jointly analyze data from multiple studies. In particular, suc h metho ds must b e able to appropriately accoun t for the biological and tec hnical v ariabilit y among samples within a given study as w ell as for the additional v ariabilit y due to study-sp ecific effects. Such in ter-study v ariability ma y arise due to tec hnical differences among studies (e.g., sample preparation, library proto cols, batch effects) as w ell as additional biological v ariability . In recen t y ears, several methods ha ve been prop osed to analyze microarra y data arising from m ultiple indep endent but related studies; these meta-analysis techniques hav e the adv antage of in- creasing the a v ailable sample size b y in tegrating related datasets, subsequen tly increasing the pow er to detect differential expression. Suc h meta-analyses include, for example, metho ds to com bine p - v alues [14], estimate and combine effect sizes [6], and rank genes within each study [4]; see [10] and [9] for a review and comparison of such methods. In particular, [14] sho wed that the inv erse normal p -v alue combination tec hnique outp erformed effect size com bination metho ds or mo derated t -tests [18] obtained from a linear model with a fixed study effect on several criteria, including sensitivit y , area under the Receiver Op erating Characteristic (ROC) curve, and gene ranking. In man y cases the meta-analysis tec hniques previously used for microarra y data are not directly applicable for RNA-seq data. In particular, differen tial analyses of microarray data, whether for one or m ultiple studies, t ypically mak e use of a standard or mo derated t -test [11, 18], as suc h data are con tinuous and may be roughly approximated by a Gaussian distribution after log-transformation. On the other hand, the growing b o dy of work concerning the differen tial analysis of RNA-seq data has primarily fo cused on the use of ov erdisp ersed P ois son [2] or negative binomial models [1, 17] in order to account for their highly heterogeneous and discrete nature. Under these mo dels, the calculation and interpretation of effect sizes is not straigh tforw ard. [12] recen tly prop osed an effect size combination metho d for Poisson-distributed data, based on an Anscombe transformation, but this metho d is not w ell-adapted to RNA-seq data due to the presence of ov er-disp ersion among biological replicates as well as zero-inflation. T o our knowledge, no other transformation has b een prop osed to obtain effect sizes for o v er-disp ersed Poisson or negative binomial data. In this pap er, we consider sev eral metho ds for the integrated analysis of RNA-seq data arising from m ultiple related studies, including tw o p -v alue combination metho ds as well as a mo del fitted o ver the full data with a fixed study effect. W e first demonstrate how the inv erse normal and Fisher p -v alue combination metho ds can b e adapted to the differential meta-analysis of RNA-seq data. Then w e compare these tw o metho ds to the results of indep endent per-study analyses and a negativ e binomial generalized linear mo del (GLM) with a fixed study effect as implemented in the DESeq Bio conductor pack age [1]. All methods are compared on real data from t wo related studies on hu man melanoma cell lines, as well as in an extensive set of sim ulations v arying the in ter-study v ariabilit y , num b er of studies, and biological replicates p er study . 2 Finally , w e note that our fo cus is on RNA-seq data arising from t wo or more studies in whic h all exp erimen tal conditions under consideration are included in every study (with p otentially different n umbers of biological replicates); differential analyses among conditions that are not studied in the same exp eriment are t ypically limited, or ev en compromised, due to the confounding of condition and study effects. 2 Metho ds Let y g crs b e the observ ed count for gene g ( g = 1 , . . . , G ), condition c ( c = 1 , 2), biological replicate r ( r = 1 , . . . R cs ), and study s ( s = 1 , . . . , S ). Note that the num b er of biological replicates R cs ma y v ary b etw een conditions and among studies. Let µ g cs b e the mean expression level for gene g in condition c and study s . F or an integrated differen tial analysis of gene expression across all studies, t wo approaches can b e en visaged: the combination of p -v alues from p er-study differen tial analyses, and a global differenti al analysis. W e illustrate b oth using the default metho ds and parameters of the DESeq (v1.10.1) analysis pip eline [1], although other p opular metho ds, e.g., edgeR [17], could also b e used. 2.1 P -v alue com bination from indep enden t analyses F or the differential analysis of gene expression within a given study s , we assume that gene coun ts y g crs follo w a negativ e binomial distribution parameterized by its mean ` crs µ g cs and dispersion α g s , where ` crs is a normalization factor to correct for differences in library size. A comparison of differen t metho ds to estimate ` crs ma y b e found in [7]. W e are in terested in testing the p er-gene n ull hypothesis H 0 ,g s : µ g 1 s = µ g 2 s vs H 1 ,g s : µ g 1 s 6 = µ g 2 s . (1) After obtaining per-gene mean and dispersion parameter estimates, a parametric gamma regression is used to obtain fitted disp ersion e stimates by p o oling information from genes with similar expres- sion strengths. Ra w p er-gene p -v alues p g s are subsequen tly computed using a conditioned test analogous to Fisher’s exact test. Additional details may b e found in [1] and the DESeq pack age vi- gnette. Once these v ectors of ra w p -v alues ha v e been obtained, we consider tw o p ossible approac hes to com bine them across studies: the in verse normal and the Fisher com bination metho ds. W e note that b oth of these approac hes assume that under the n ull h yp othesis, each v ector of p -v alues is assumed to b e uniformly distributed. 2.1.1 In verse normal metho d F or eac h gene g , we define N g = S X s =1 w s Φ − 1 (1 − p g s ) (2) where p g s corresp onds to the ra w p -v alue obtained for gene g in a differential analysis for study s , Φ the cumulativ e distribution function of the standard normal distribution, and w s a set of 3 w eights [13]. W e prop ose here to define the study-sp ecific weigh ts w s as in [15]: w s = s P c R cs P ` P c R c` , where P c R cs is the total n um b er of biological replicates in study s . This allows studies with large n umbers of biological replicates to b e attributed a larger weigh t than smaller studies. W e note that other w eigh ts ma y also b e defined by the user depending on the quality of the data in each study , if this information is a v ailable. Under the n ull hypothesis, the test statistic N g in Equation (2) follows a N (0 , 1) distribution. A unilateral test on the right-hand tail of the distribution ma y then b e performed, and classical pro cedures for the correction of multiple testing suc h as [3] may subsequen tly b e applied to the obtained p -v alues to control the false discov ery rate at a desired level α . 2.1.2 Fisher com bination metho d F or the Fisher com bination metho d [8], the test statistic for each gene g may b e defined as F g = − 2 S X s =1 ln( p g s ) , (3) where as b efore p g s corresp onds to the raw p -v alue obtained for gene g in a differen tial analysis for study s . Under the n ull h yp othesis, the test statistic F g in Equation (3) follo ws a χ 2 distribution with 2 S degrees of freedom. As with the inv erse normal p -v alue combination metho d, classical pro cedures for the correction of multiple testing suc h as [3] may be applied to the obtained p -v alues to con trol the false disc o very rate at a desired level α . 2.1.3 Additional considerations for p -v alue com bination W e note that the implemen tation of the previously describ ed p -v alue combination tec hniques re- quires t wo additional considerations to b e taken into account. First, a crucial underlying assumption for the statistics defined in Equations (2) and (3) is that p -v alues for all genes arising from the p er-study differential analyses are uniformly distributed under the n ull h yp othesis H 0 ,g s defined in Equation (1). This assumption is, ho w ever, not alw ays satisfied for RNA-seq data; in particular, a p eak is often observ ed for p -v alues close to 1 due to the discretization of p -v alues for very low coun ts. T o circumv ent this first difficulty , w e prop ose to filter the weakly expressed genes in each study using the HTSFilter Bio conductor pack age [16], as describ ed in the Supplementary Materials. W e note that in so doing, it is p ossible for a gene to b e filtered from one study and not from another. As will b e seen in the follo wing, this approach app ears to effectiv ely filter those genes con tributing to a p eak of large p -v alues, resulting in p -v alues that app ear to b e roughly uniformly distributed under the n ull h yp othesis. Second, for the t wo p -v alue combination metho ds describ ed ab ov e, unlike microarray data, under- and o ver-expressed genes are analyzed together for RNA-seq data. As such, some care must b e tak en to identify genes exhibiting conflicting expression patterns (i.e., under-expression when comparing one condition to another in one study , and ov er-expression for the same comparison in another study). W e suggest that genes exhibiting differential expression conflicts among studies be 4 iden tified p ost ho c, and remo v ed from the list of differentially expressed genes; this step to remov e genes with conflicting differential expression from the final list of differen tially expressed genes ma y b e p erformed automatically within the asso ciated R pac k age metaRNASeq . 2.2 Global differential analysis F or a global analysis of RNA-seq data arising from multiple studies, w e assume that gene coun ts y g crs follo w a negative binomial distribution parameterized b y the mean ` crs µ g cs and disp ersion α g , where ` crs is the library size normalization factor. W e are now in terested in testing the global p er-gene n ull hypothesis H 0 ,g : µ g 1 = µ g 2 vs H 1 ,g : µ g 1 6 = µ g 2 . P er-gene mean and fitted disp ersion estimates are obtained as b efore. In order to estimate a p ossible effect due to study , a full and reduced model are fitted for each gene using negativ e binomial generalized linear mo dels (GLM); the full mo del regresses gene expression on the exp erimental condition and study , while the reduced mo del regresses gene expression only on the study . The t wo mo dels are compared using a χ 2 lik eliho o d ratio test to determine whether including the exp erimen tal condition significantly improv es the mo del fit. Note that for the global differen tial analysis w e use the HTSFilter Bio conductor pack age [16] to filter the full set of data across studies, resulting in a v ector of ra w filtered p er-gene p -v alues that ma y b e corrected for multiple testing using classical pro cedures [3] to control the false discov ery rate at a desired level α . Additional details ma y b e found in the DESeq pack age vignette. 3 Results and Discussion 3.1 Application to real data 3.1.1 Presen tation of the data The negative binomial GLM and p -v alue combination metho ds were applied to a pair of real RNA- seq studies p erformed to compare t wo human melanoma cell lines [19]. Eac h study compares gene expression in a melanoma cell line expressing the Microph talmia T ranscription F actor (MiTF) to one in which small interfering RNAs (siRNAs) w ere used to repress MiTF, with three biological replicates p er cell line in the first (hereafter referred to as Study A) and tw o p er cell line in the second (Study B). The ra w read coun ts and phenot yp e tables for Study A are av ailable in the Supplemen tary Materials of [7], and the data from Study B from [19]. The c haracteristics of the data from these tw o studies are summarized in Supplemen tary T able 2. In particular, w e note that the data from Study A tend to ha ve larger total library sizes and a smaller num b er of unique reads than those from Study B; in addition, Study A app ears to exhibit larger o verall p er-gene v ariability than do es Study B (Supplementary Figure 8). These tw o p oin ts indicate that in this pair of studies, a considerable amount of inter-study v ariabilit y app ears to b e presen t (Supplementary Figure 9). 5 3.1.2 Results After p erforming individual differen tial analysis for each study using the negativ e binomial mo del and exact test as describ ed ab o ve, we obtained p er-gene p -v alues for each study (Figure 1, his- tograms in background). As previously stated, an imp ortant underlying assumption of the p -v alue com bination metho ds is that the p -v alues are uniformly distributed under the n ull h yp othesis; w e note that this is not the case here, especially for the second study , due to a large p eak of v alues close to 1 resulting from the discretization of p -v alues. In order to remov e the w eakly e xpressed genes con tributing to this p eak in eac h study , w e filtered the data from eac h study as proposed in [16], resulting in a distribution of ra w p -v alues from eac h study that app ears to satisfy the uniformity assumption under the n ull hypothesis (Figure 1, histograms in foreground). 0 1000 2000 3000 0.0 0.5 1.0 P−value Count Study A 0 1000 2000 3000 4000 5000 0.0 0.5 1.0 P−value Count Study B Figure 1: Histograms of raw p -v alues obtained from per-study differential analyses in the real data: unfiltered (in grey) and filtered (in blue) using the metho d of [16]. Figure made using the ggplot2 pac k age [20]. The p er-study filtered p -v alues were combined using the test statistics defined in Equations (2) and (3), and the corresponding results w ere compared to those of the intersection of indep enden t p er-study analyses and the global analysis using a negative binomial GLM with a fixed study effect. W e note that for the indep endent p er-study differential analyses, a gene is declared to b e differen tially expressed if iden tified in b oth studies with no differential expression conflict (see Section 2.1.3). The V enn diagram presented in Figure 2 compares the lists of differentially expressed genes found for all metho ds considered. It ma y immediately b e noticed that the indep endent p er-study analysis approac h is very conserv ative, and b oth of the p -v alue combination approaches (Fisher and inv erse normal) considerably increas e the detection p ow er. In addition, a large num b er of genes are found in common among the p -v alue com bination metho ds and the global analysis (3578 compared to only 1583 from the in tersection of individual studies). In order to determine whether the genes uniquely identified by a particular metho d app ear to b e biologically pe rtinen t, an In- gen uity P athw ays Analysis (Ingenuit y R Systems, www.ingenuit y .com) was p erformed to identify functional annotation for the genes uniquely iden tified b y the Fisher p -v alue com bination method with respect to the global analysis, and vice versa. W e note that the sets of genes uniquely iden- tified by the Fisher metho d or the global analysis (Supplementary T ables 2 and 3), as well as the set of genes found in common (Supplementary T able 4), all app ear to include genes of p otential in terest related to cancer or melanoma, which was the main fo cus of this set of studies. As suc h, for this pair of studies it app ears that the union of genes identified b y the tw o approaches may b e 6 Figure 2: V enn diagram presen ting the results of the differential analysis for the real data for the tw o meta-analysis metho ds (Fisher and in verse normal), the global analysis (DESeq (study)), and the in tersection of individual per-study analyses (Individual). Figure made using the VennDiagrams pac k age [5]. of biological interest; to further study the effect of num b er of studies and inter-study v ariability on the p erformance of each metho d, we in vestigate an extensiv e set of simulated data in the following section. 3.2 Sim ulation study Data w ere simulated according to a negative binomial distribution, Y g crs ∼ N B ( µ g cs , φ g s ) where µ g cs and φ g s represen t the mean and disp ersion, resp ectively , for gene g , condition c and study s , and the mean-v ariance relationship is defined by V ar( Y g crs ) = µ g cs + µ 2 g cs φ g s . In order to incorp orate inter-study v ariability , we consider the follo wing situation for the mean parameter µ g cs : log( µ g cs ) = w g c + ε g cs , and ε g cs ∼ N (0 , σ 2 ) , where w g c represen ts the ov erall mean for gene g in condition c , ε g cs the v ariabilit y around these means due to a study effect, and σ 2 the size of the inter-study v ariability . Note that as ε g cs affects µ g cs through a log link, the v alue of exp( ε g cs ) has a m ultiplicative effect on the mean. 3.2.1 P arameters for sim ulations T o fix realistic v alues for the parameters { w g c , φ g s , σ } , w e first p erformed individual p er-study differen tial analyses b y fitting a negative binomial mo del with the default metho ds and parameters of the DESeq pack age (see Section 2.1) on the unfiltered h uman data presen ted in Section 3.1. The p er-study false disco very rate was subsequen tly controlled at the α = 0 . 05 lev el [3]. F or the genes identified as differentially expressed in b oth studies, w g 1 and w g 2 w ere fixed to b e the v alues 7 T able 1: Simulation settings, including the num b er of studies and the num b er of replicates p er condition in eac h study . Setting # of studies Replicates/study 1 2 (2,3) 2 3 (2,2,3) 3 5 (2,2,3,3,3) of the empirical means (after normalization for library size differences) for each condition across studies. F or the remaining genes, we set w g 1 = w g 2 = w g to b e the o verall empirical mean (after normalization for library size differences) for gene g across b oth conditions and studies. Using the gamma-family GLM fitted to the p er-gene mean and disp ersion parameter estimates for eac h study (Supplemen tary Figure 8), we fixed the disp ersion parameter φ g s to b e equal to the fitted v alues φ − 1 g s = ˆ α 0 s + ˆ α 1 s w g , where ˆ α 0 s and ˆ α 1 s are the estimated co efficients from the gamma-family GLM for study s , and w g is the o v erall empirical mean for gene g . F or weakly expressed genes, it has b een observed that little ov erdisp ersion is present as biological v ariation is dominated by shot noise (i.e., the v ariation inheren t to a coun ting pro cess); for genes with w g < 10, the disp ersion parameter is therefore fixed to b e φ g s = 10 10 , which corresp onds to nearly zero ov erdisp ersion (i.e., mean nearly equal to the v ariance). Finally , the parameter σ is chosen to represent a range of v alues for the amoun t of inter-study v ariabilit y . The observ ed human data exhibit a considerable amount of inter-study v ariability , corresp onding to a v alue of roughly σ = 0 . 5 (see Supplemen tary Materials, Figure 9). In the follo wing sim ulations, four v alues are considered for the parameter σ : { 0 , 0 . 15 , 0 . 3 , 0 . 5 } , represen ting zero, small, medium, and large in ter-study v ariability , resp ectiv ely . Finally , we note that for genes sim ulated to b e non-differentially expressed, we set ε g 1 s = ε g 2 s = ε g s ∼ N (0 , σ 2 ). The sim ulation settings used for the n umber of studies and n umber of replicates p er condition in eac h study are presen ted in T able 1 and w ere c hosen to reflect the size of real RNA-seq exp eriments. When more than t wo studies were simulated, the same sim ulation parameters were used as for the first tw o, as determined from the real data. F or simplicity , the same n umber of replicates was sim ulated in each condition for all studies. 3.2.2 Metho ds and criteria for comparison In addition to the in tersection of indep enden t p er-study analyses (where genes were declared to b e differen tially expressed if identified in more than half of the studies with no differential conflict), the Fisher and in verse normal p -v alue com bination techniques, and the global analysis with fixed study effect, we also considered a global analysis with no study effect. F or each simulation setting and lev el of inter-study v ariabilit y σ , 300 indep enden t datasets were simulated, and the filtering metho d of [16] was applied, either indep endently to each study (for the indep endent p er-study analyses and p -v alue combination techniques) or to the full set of data (for the global analysis). F or eac h method, p erformance w as assessed using the sensitivity , false disco very rate (FDR) and area under the receiv er op erating c haracteristic (R OC) curve (A UC). In addition, w e also considered 8 0.0 0.2 0.4 0.6 0.8 1.0 0.0 0.2 0.4 0.6 0.8 1.0 σ = 0.15 Sensitivity 2 studies 0.0 0.2 0.4 0.6 0.8 1.0 0.0 0.2 0.4 0.6 0.8 1.0 σ = 0.50 1 − Specificity Sensitivity 0.0 0.2 0.4 0.6 0.8 1.0 0.0 0.2 0.4 0.6 0.8 1.0 3 studies 0.0 0.2 0.4 0.6 0.8 1.0 0.0 0.2 0.4 0.6 0.8 1.0 1 − Specificity 0.0 0.2 0.4 0.6 0.8 1.0 0.0 0.2 0.4 0.6 0.8 1.0 5 studies 0.0 0.2 0.4 0.6 0.8 1.0 0.0 0.2 0.4 0.6 0.8 1.0 1 − Specificity Fisher DESeq (no study) DESeq (study) Figure 3: Receiver Op erating Characteristic (R OC) curv es, a v eraged ov er 300 datasets. Eac h plot represen ts the results of a particular setting, with columns corresp onding (from left to righ t) to simulations including 2 studies, 3 studies, and 5 studies, and ro ws corresp onding (from top to b ottom) to sim ulations with in ter-study v ariability set to σ = 0 . 15 and σ = 0 . 50 (lo w in ter-study v ariability to lareg inte r-study v ariabilit y). Within eac h plot: Fisher (red lines), global analysis with no fixed study effect (DESeq (no study), blue lines), and global analysis with a fixed study effect (DESeq (study), orange lines). The dotted black line represen ts the diagonal. a criterion to assess the “v alue added” for the p -v alue combination metho ds with resp ect to the global analysis, and vice versa: the prop ortion of true p ositiv es among those uniquely iden tified b y a giv en metho d (e.g., the Fisher approach) as compared to another (e.g., the global analysis). 3.2.3 Results The different metho ds w ere first compared with R OC curv es, presen ted in Figure 3 for low and high inter-study v ariability (results for zero and mo derate inter-study v ariability are shown in Supplemen tary Figure 5). W e note that for clarity , the inv erse normal metho d is not represen ted on these plots as its p erformance was found to b e equiv alent to the Fisher metho d. It can first b e noted that for no or small in ter-study v ariabilit y ( σ = 0 or σ = 0 . 15), no practical difference may b e observed among the metho ds. On the other hand, for moderate to large inter-study v ariability ( σ = 0 . 3 or σ = 0 . 5) differences among the metho ds become more apparen t; this pattern is observ ed for any n umber of studies. As exp ected, including a study effect in the global analysis improv es the 9 p erformance ov er a naiv e global analysis without suc h an effect. W e note that the t wo prop osed meta-analysis metho ds (in verse normal and Fisher p -v alue com bination) were found to perform v ery similarly and were able, in the case of large in ter-study v ariabilit y , to outp erform the global analysis in terms of A UC (Supplemen tary Figure 1). In particular, in the presence of large inter- study v ariability , the naiv e global analysis without a study effect unsurprisingly has the lo west A UC, and the t wo meta-analysis metho ds yield a larger A UC than the global analysis with a study effect. Considering the sensitivity (Figure 4 and Supplementary Figure 6), the meta-analyses app ear to lead to similar, and in some settings considerably higher, detection p o wer compared to the other metho ds. W e note that in all settings, using the intersection of independent analyses leads to m uch lo wer sensitivit y , even for low or zero inter-study v ariability . As for the AUC, the sensitivity was found to be considerably impro v ed for the global analysis when including a study effect in the GLM mo del, particularly for medium to large inter-study v ariabilit y . The tw o meta-analysis metho ds w ere found to lead to significan t improv ements in sensitivity as compared to the global analysis in the presence of moderate to large in ter-study v ariabilit y when three or more studies w ere considered. Ho wev er, for the setting that most resembles our real data analysis (2 studies, σ = 0 . 50), the global analysis with study effect and meta-analyses app ear to ha ve similar detection pow er. Finally , w e also note that for all metho ds the FDR w as w ell c on trolled b elow 5% (Supplementary Figure 2). Based on these criteria, the t wo prop osed meta-analysis metho ds (in verse normal and Fisher) seem to p erform very similarly . In order to more thoroughly inv estigate the differences b etw een p -v alue com bination metho ds and the global analysis including a study effect, we calculated the prop ortion of true p ositiv es uniquely detected b y the Fisher metho d as compared to the global analysis with study effect, and vice versa (Figure 5 and Supplemen tary Figure 7). In the setting closest to the real data analysis presen ted ab ov e (tw o studies and large in ter-study v ariability), the prop ortion of true p ositiv es found uniquely by either the Fisher approach or the global analysis with fixed study effect are v ery large (around 80% for both methods). This seems to suggest that the additional genes uniquely found either b y the global analysis or Fisher p -v alue combination metho d in the real data application ma y indeed b e of great biological interest. F or more than t wo studies, ho wev er, as the in ter-study v ariability increases the prop ortion of truly differentially expressed genes uniquely found by the Fisher metho d increases compared to the global analysis. F or example, for three studies with large in ter-study v ariability ( σ = 0 . 5), the prop ortion of truly DE genes uniquely found with the Fisher metho d was equal to more than 80%, whereas it was only around 40% for the global analysis with a study effect. 4 Conclusions The aim of this pap er was to presen t and compare different strategies for the differential meta- analysis of RNA-seq data arising from m ultiple, related studies. As expected, naiv e analyses such as the ov erlap of lists of differentially expressed genes found by individual studies or a global analysis not accounting for a study effect p erform very p o orly . On the other hand, the t wo prop osed meta-analysis metho ds seem to ha ve very similar p erformances. F or lo w in ter-study v ariability , the results are v ery close to those of a global GLM analysis including a study effect. When the inter- study v ariability increases, how ev er, the gains in p erformance in terms of AUC, sensitivity , and prop ortion of true p ositives among uniquely iden tified genes for the meta-analysis tec hniques are 10 0.3 0.4 0.5 0.6 0.7 0.8 0.9 1.0 2 studies σ = 0.15 Sensitivity 0.3 0.4 0.5 0.6 0.7 0.8 0.9 1.0 σ = 0.50 Sensitivity Indiv Inverse Normal Fisher DESeq (no study) DESeq (study) 0.3 0.4 0.5 0.6 0.7 0.8 0.9 1.0 3 studies 0.3 0.4 0.5 0.6 0.7 0.8 0.9 1.0 Indiv Inverse Normal Fisher DESeq (no study) DESeq (study) 0.3 0.4 0.5 0.6 0.7 0.8 0.9 1.0 5 studies 0.3 0.4 0.5 0.6 0.7 0.8 0.9 1.0 Indiv Inverse Normal Fisher DESeq (no study) DESeq (study) Figure 4: Sensitivit y , for the simulation settings corresp onding to σ = 0 . 15 and σ = 0 . 50. Eac h barplot represen ts the results of a particular setting, with columns corresp onding (from left to righ t) to sim ulations including 2 studies, 3 studies, and 5 studies, and ro ws corre- sp onding (from top to b ottom) to sim ulations with in ter-study v ariabilit y set to σ = 0 . 15 and σ = 0 . 50 (no in ter-study v ariability to mo derate in ter-study v ariability). Within each barplot, from left to righ t: Individual p er-study analyses (green bars), Inv erse Normal (pur- ple bars), Fisher (red bars), DESeq with no study effect (blue bars), and DESeq with a fixed study effect (orange bars). % TP among unique disco v er ies 0.0 0.2 0.4 0.6 0.8 1.0 (27.9) (78) 2 studies σ = 0.15 % TP among unique % TP among unique disco v er ies 0.0 0.2 0.4 0.6 0.8 1.0 (125.8) (80) σ = 0.50 % TP among unique DESeq (study) Fisher 0.0 0.2 0.4 0.6 0.8 1.0 (42.9) (63) 3 studies 0.0 0.2 0.4 0.6 0.8 1.0 (54) (207) DESeq (study) Fisher 0.0 0.2 0.4 0.6 0.8 1.0 (49.3) (36) 5 studies 0.0 0.2 0.4 0.6 0.8 1.0 (61.8) (170) DESeq (study) Fisher Figure 5: Proportion of true positives among unique discov eries for DESeq with a fixed study effect (orange bars) and Fisher (red bars) for the sim ulation settings not demonstrated in the main pap er. Each barplot represen ts the results of a particular setting, with columns corresp onding (from left to righ t) to sim ulations including 2 studies, 3 studies, and 5 studies, and ro ws corresponding (from top to b ottom) to simulations with inter-study v ariability set to σ = 0 . 15 and σ = 0 . 50 (no inter-study v ariability to mo derate inter-study v ariability). Error bars represen t one standard deviation, and n um b ers in paren theses represen t the mean total num b er of unique discov eries for DESeq with study effect as compared to Fisher and vice v ersa, respectively . 11 significan t as compared to the global analysis, particularly for the analysis of data from more than t wo studies. W e note that b oth of the proposed p -v alue combination metho ds are implemented in an R pac k age called metaRNASeq , av ailable on the R-F orge. Our fo cus in this work is on differen tial analyses b etw een tw o experimental conditions, but can readily b e extended to m ulti-group comparisons. Ho wev er, as previously noted, the metho ds presen ted here are intended for the analysis of data in which all experimental conditions under con- sideration are included in every study , th us a voiding problems due to the confounding of condition and study effects. As with all meta-analyses, the p -v alue combination tec hniques presented here m ust ov ercome differences in exp erimental ob jectives, design, and p opulations of in terest, as w ell as differences in sequencing tec hnology , library preparation, and lab oratory-sp ecific effects. The differen tial meta-analyses presented here concern expression studies based on RNA-seq data. How ever, other genomic data are generated by high-throughput sequencing techniques, in- cluding chromatin immunoprecipitation sequencing (CHIP-seq) and DNA methylation sequencing (meth yl-seq), and the prop osed techniques could p oten tially be extended to these other kinds of data. How ever, in order to be biologically relev ant, the p -v alue combination methods rely on the fact that the same test statistics, or in the case of RNA-seq data conditioned tests, are used to obtain p -v alues for each study . An important challenge for the future will b e to prop ose methods able to join tly analyze related heterogeneous data, such as microarray and RNA-seq data, or other kinds of genomic data. This is not straightforw ard in a meta-analysis framework and remains an op en researc h question. Authors’ con tributions AR participated in the design of the study , p erformed sim ulations and data analyses, and help ed draft the manuscript. GM designed the study , wrote the asso ciated R pack age, and help ed draft the manuscript. FJ conceiv ed of the study , participated in its design, and drafted the manuscript. All authors read and appro ved the final manuscript. Ac kno wledgemen ts W e thank Thomas Strub, Irwin Davidson, C´ eline Keime and the IGBMC sequencing platform for pro viding the RNA-seq data. 12 References [1] S. Anders and W. Hub er. Differen tial expression analysis for sequence count data. Genome Biol , 11(R106), 2010. [2] P . Auer and R. Doerge. A t wo-stage P oisson mo del for testing RNA-seq data. Stat Appl Genet Mol Biol , 10(26):1–26, 2011. [3] Y. Benjamini and Y. Ho c hberg. Controlling the false discov ery rate: A practical and p ow erful approac h to multiple testing. J R oy Statist So c Ser B , 57(1):289–300, 1995. [4] R. Breitling, P . Armengaud, A. Am tmann, and P . Herzyk. Rank pro ducts: A simple yet p ow- erful new metho d to detect differential regulated genes in replicated microarra y exp eriments. FEBS L etters , 573:83–92, 2004. [5] H. Chen and P . C. Boutros. V ennDiagram: a pac k age for the generation of highly-customizable V enn and Euler diagrams in R. BMC Bioinformatics , 12(35), 2011. [6] J. K. Choi, U. Y u, S. Kim, and O. J. Y o o. Com bining multiple microarray studies and mo del in terstudy v ariation. Bioinformatics , 19(Suppl 1):84–90, 2003. [7] M.-A. Dillies, A. Rau, J. Aub ert, C. Hennequet-Antier, M. Jeanmougin, N. Serv ant, C. Keime, G. Marot, D. Castel, J. Estelle, G. Guernec, B. Jagla, L. Jouneau, D. Lalo ¨ e, C. Le Gall, B. Scha ¨ effer, S. Le Crom, and F. Jaffr ´ ezic. A comprehensiv e ev aluation of normalization metho ds for Illumina high-throughput RNA sequencing data analysis. Brief Bioinform , 2012. doi: 10.1093/bib/bbs046. [8] R. A. Fisher. Statistic al metho ds for r ese ar ch workers . Oliv er and Bo yd, Edin burgh, 1932. [9] F. Hong and R. Breitling. A comparison of meta-analysis metho ds for detecting differentially expressed genes in microarra y experiments. Bioinformatics , 24(3):374–382, 2008. [10] P . Hu, C. M. Greenw o o d, and J. Beyene. Statistical metho ds for meta-analysis of microarray data: A comparative study . Inf Syst F r ont , 8:9–20, 2006. [11] F. Jaffr´ ezic, G. Marot, S. Degrelle, I. Hue, and J.-L. F oulley . A structural mixed mo del for v ariances in differential gene expression studies. Genet R es , 89:19–25, 2007. [12] E. Kulinsk a ya, S. Morgenthaler, and R. G. Staudte. Meta Analysis: A guide to c alibr ating and c ombining statistic al evidenc e , volume 756 of Wiley Series in Probabilit y and Statistics. John Wiley & Sons, W est Sussex, England, 2008. [13] T. Liptak. On the combination of independent tests. Magyar T udomanyos. A kademia Matem- atikai Kutato Intezetenek Kozlemenyei , 3:171–197, 1958. [14] G. Marot, J.-L. F oulley , C.-D. May er, and F. Jaffr´ ezic. Mo derated effect size and p-v alue com binations for microarray meta-analyses. Bioinformatics , 25(20):2692–2699, 2009. [15] G. Marot and C.-D. Ma yer. Sequential analysis for microarray data based on sensitivity and meta-analysis. Stat Appl Genet Mol Biol , 8(Article 3), 2009. 13 [16] A. Rau, M. Gallopin, G. Celeux, and F. Jaffr ´ ezic. Data-based filtering for replicated high- throughput transcriptome sequencing exp erimen ts. (submitte d) , 2013. [17] M. D. Robinson, D. J. McCarth y , and G. K. Smyth. edgeR: a Bioconductor pack age for differen tial expression analysis of digital gene expression data. Bioinformatics , 26:139–140, 2010. [18] G. K. Smyth. Linear mo dels and empirical Ba yes metho ds for assessing differential expression in microarra y exp eriments. Stat Appl Genet Mol Biol , 3(Article 3), 2004. [19] T. Strub, S. Giuliano, T. Y e, C. Bonet, C. Keime, D. Kobi, S. L. Gras, M. Cormont, R. Ballotti, C. Bertolotto, and I. Davidson. Essential role of microphthalmia transcription factor for DNA replication, mitosis and genomic stabilit y in melanoma. Onc o gene , 30:2319–2332, 2011. [20] H. Wic kham. ggplot2: ele gant gr aphics for data analysis . Springer, New Y ork, 2009. 14
Original Paper
Loading high-quality paper...
Comments & Academic Discussion
Loading comments...
Leave a Comment