Learning About Meetings
Most people participate in meetings almost every day, multiple times a day. The study of meetings is important, but also challenging, as it requires an understanding of social signals and complex interpersonal dynamics. Our aim this work is to use a …
Authors: Been Kim, Cynthia Rudin
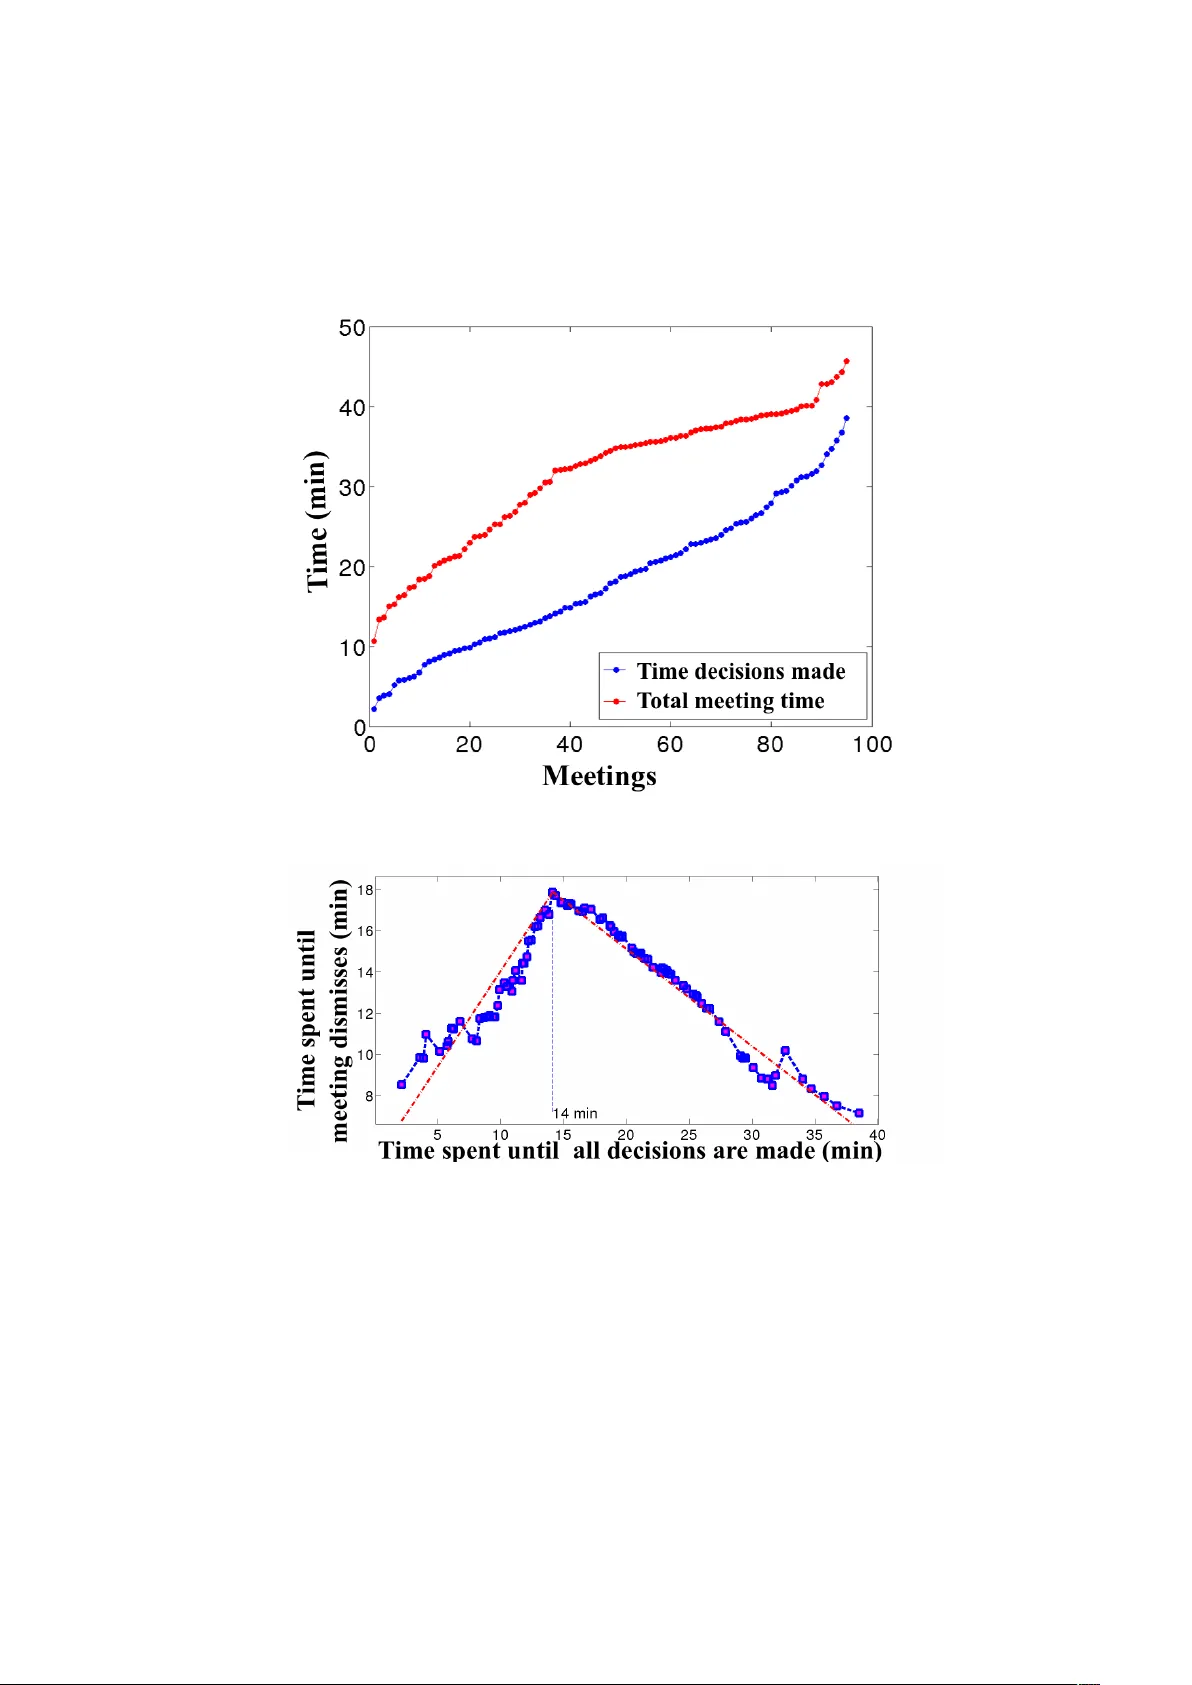
Learning Ab out Meetings Been Kim and Cyn thia Rudin Massac husetts Institute of T ec hnology beenkim@csail.mit.edu, rudin@mit.edu Abstract. Most p eople participate in meetings almost ev ery da y , m ulti- ple times a da y . The study of meetings is imp ortan t, but also challenging, as it requires an understanding of so cial signals and complex interper- sonal dynamics. Our aim this w ork is to use a data-driven approach to the science of meetings. W e provide ten tativ e evidence that: i) it is p ossible to automatically detect when during the meeting a key decision is taking place, from analyzing only the lo cal dialogue acts, ii) there are common patterns in the w ay so cial dialogue acts are interspersed throughout a meeting, iii) at the time key decisions are made, the amount of time left in the meeting can b e predicted from the amoun t of time that has passed, iv) it is often possible to predict whether a prop osal during a meeting will b e accepted or rejected based entirely on the language (the set of p ersuasiv e words) used b y the speaker. 1 In tro duction “A me eting is indisp ensable when you don ’t want to get anything done.” [Kayser, 1990] In the United States alone, an estimated 11 million meetings tak e place dur- ing a t ypical w ork da y [Newlund, 2012]. Managers t ypically sp end b et w een a quarter and three-quarters of their time in meetings [Mac k enzie and Nick er- son, 2009], and appro ximately 97% of work ers ha v e rep orted in a large-scale study [Hall, 1994] that to do their best work, collaboration is essential. Most of us work directly with others ev ery day , and wan t to b e useful participan ts in meetings. Meeting analysis (the science of meetings) can p oten tially help us un- derstand v arious asp ects of meetings, find w a ys to allo w us to be more effective participan ts in our meetings, and help us to create automated to ols for meet- ing assistance. Meeting dynamics can b e complex; often prop osals are implicitly comm unicated and accepted [Eugenio et al., 1999]. Despite the plethora of meet- ings that happ en eac h da y , and despite a bo dy of w ork on meeting analysis [e.g., see Romano Jr and Nunamaker Jr, 2001, for a review], we still cannot claim that w e understand the topic of meetings well enough that these studies ha v e led to quantifiable improv emen ts in the o v erall qualit y of meetings, nor useful guidelines for more pro ductiv e meetings. Perhaps if w e step back and consider a basic science approach to meeting analysis, we would quan titativ ely uncov er asp ects of meetings that could ev en tually lead to true impro v emen ts. In this w ork, we dev elop and use predictive mo deling to ols and descriptive statistics in order to provide a data-driven approach to the scientific study of 2 Kim and Rudin meetings. W e provide preliminary answers to sev eral key questions: i) Can we automatically detect when the main decisions are made during the meeting, based only on the frequency and t ype of dialogue acts in a given p eriod of time? In other w ords, based on the t yp es of utte rances p eople are making, can w e determine whether the most imp ortan t part of the meeting is occurring? ii) Is there an y t ype of pattern of dialogue common to most or all meetings? W e w ould lik e to kno w whether there is a “quintessen tial” pattern of dialogue that w e can identify . iii) How long is a meeting going to last, in terms of “wrap- up” time, b ey ond the time that the main decisions are made? Sometimes this wrap-up time is substan tial, and the meeting extends w ell beyond when the main decisions are made. iv) Can we predict whether a prop osal made during a meeting will b e accepted or rejected based entirely on the language (the set of persu asiv e words) used by the sp eak er? There hav e been many studies and commen taries fo cused on “p ersuasive words,” but do those p ersuasive w ords truly correlate with successful outcomes during a meeting? Some of these questions can be answered using curren t mac hine learning approaches, but others cannot. F or finding patterns in dialogue acts that are common to most/all meetings, w e design an algorithm to learn a sparse representation of a meeting as a graph of dialogue acts, whic h yields insigh t ab out the wa y social dialogue acts intersperse with w ork-related dialogue acts. In our study , we use the most extensive annotated corpus of meetings data in existence, originating from the AMI (Augmented multi-part y interaction) pro ject [McCo w an et al., 2005]. This dataset contains a large num b er of annotated meet- ings (ov er 12,000 human-labeled annotations). In total, there are 108,947 dia- logue acts in total n um ber of 95 meetings, and 26,825 adjacency pairs (explained b elo w). This corpus is deriv ed from a series of real meetings, controlled in the sense that each meeting has four participan ts who w ork as a team to comp ose a new design for a new remote control. Each participant takes a role, either pro ject manager, mark eting exp ert, industrial designer or in terface designer. The partic- ipan ts are given training for their roles at the beginning of the task. Documents used to train participan ts and annotators are publicly a v ailable. The in teraction b et w een participants is unstructured, and each p erson freely chooses their own st yle of interaction. The length of meetings ranges from appro ximately 10 min- utes to 45 min utes, whic h ov erlaps with the most common lengths of meetings [discussed by Romano Jr and Nunamaker Jr, 2001]. Here we provide detail on the annotations pro vided with the corpus. Dialo gue A cts : A dialogue act marks a characteristic of an utterance, repre- sen ting the inten tion or the role of the utterance. It is possible to use dialogue act data to predict characteristics of future dialogue [Nagata and Morimoto, 1994], or to do automatic dialogue act tagging [Stolck e et al., 2000, Ji and Bilmes, 2005]. Dialogue acts include questions, statements, suggestions, assessment of suggestions (p ositiv e, negativ e or neutral) and so cial acts. Each sentence is of- ten divided in to pieces and tagged with differen t dialogues acts. 1 A sequence of dialogue acts lo oks lik e this: 1 More deta ils of definition of dialogue acts can be found in [McCo w an et al., 2005]. Learning About Meetings 3 A: Suggestion B: Commenting on A’s suggestion C: Asking questions A: Answering C’s question B: Accepting A’s suggestion De cision summary : A summary of decisions made in a meeting and related dialogue acts. Discussion : A set of dialogue acts and their time stamps that supp ort or reflect decisions describ ed in the decision summary annotation. A djac ency p airs : An adjacency pair encodes the relationship betw een tw o dialogue acts. It represen ts the reaction to the first dialogue act that is expressed within the second dialogue act; e.g., the first dialogue act can b e a suggestion and the second dialogue act can be a p ositiv e or negative response to it, as demonstrated in the sequence of dialogue acts ab o v e. W e note that meetings can hav e man y purp oses, [e.g., see Romano Jr and Nunamak er Jr, 2001], how ev er in this work we study only meetings where the purp ose is to mak e a group judgment or decision (rather than for instance, to ensure that ev ery one understands, or to explore new ideas and concepts). Our sp ecific goal in this work is to contribute insigh ts to the new scientific field of meeting analysis. W e provide tentativ e answ ers to the ab o v e questions that can b e used for constructing other studies. W e do not claim that our re- sults definitively answer these questions, only that they yield h ypotheses that can b e tested more thoroughly through other surv eys. Most medical (and more generally , scientific) studies make or verify hypotheses based on a database or patien t study . Hyp otheses based on these single studies are sometimes first steps in answ ering imp ortan t questions - this is a study of that kind, and we b eliev e our results can b e tested and built upon. Our more general goal is to show that ML can b e useful for exploratory study of meetings, including and beyond the questions studied here. This paper is not fo cused on a sp ecific machine learning technique per se, its goal is to show that ML metho ds can b e applied for exploratory scientific analysis of data in this domain, leading tow ards the even tual goal of increasing meeting pro ductivit y . W e start with a question for which a simple application of machine learning to ols pro vides direct insigh t. 2 Question i: Can w e au tomatically detect when k ey decisions are made? If w e can learn the statistics of dialogue acts around the time when important decisions are ab out to b e made or b eing made, we can p otentially detect the critical time window of a meeting. One can imagine using this information in sev eral w a ys, for instance, to know at what p oin t in the meeting to pa y more atten tion (or to join the meeting in the first place), or to use this as part of a historical meetings database in order to fast forw ard the meeting’s recording to the most imp ortan t parts. 4 Kim and Rudin In our setup, eac h feature vector for the detection problem is a time-shifted bag-of-dialogue-acts. The feature v ector for a specific timeframe is defined b y the coun ts of differen t dialogue acts (e.g., one example has 3 suggestions, 2 p ositiv e resp onses and 10 information exchanges). Using this represen tation means that the results do not depend on specific k eyw ords within the meeting dialogue; this p oten tially allo ws our results to hold indep enden tly of the sp ecific t yp e and pur- p ose of the meeting being held. Among dialogue acts, w e use only a subset that are known to b e relev an t to the group decision making process [Eugenio et al., 1999], namely: action directiv e, offer, accept, reject, info-request, and informa- tion. Action directives represent all elicit forms of dialogue acts — dialogue acts that require actions from hearers. By limiting to these dialogue acts, we are now w orking with a total of 53,079 dialogue acts in the corpus. Using this definition, a timeframe of dialogue becomes one example, repre- sen ted b y a 6-dimensional v ector, where each element is the coun t of a particular dialogue act within the sp ecified timeframe. The lab els are 1 if the decisions are annotated as being made in that timeframe of in terest and 0 otherwise. W e con- sidered timeframes with av erage size 70 timestamps (roughly 5 min utes). This c hoice of timeframe comes from the minimum meeting time considered in the researc h done on meeting profiles b y P ank o and Kinney [1995]. W e applied sup ervised and unsup ervised classification algorithms to predict whether important decisions are b eing made within a given blo ck of dialogue. The data were divided into 15 folds, and each fold w as used in turn as the test set. The supervised algorithms were SVM with radial basis function (RBF) kernels, SVM with linear kernels, logistic regression, and Naïve Bay es with a Gaussian densit y assumption on eac h class and feature. F or the unsup ervised algorithms, whic h (purposely) discard the annotations, we used EM with Gaussian Mixture Mo dels and Kmeans. F rom the resulting tw o clusters, we c hose the b etter of the t w o possible lab elings. The AUC, precision, recall, and F-measure for each algorithm’s p erformance on the testing folds are rep orted in T able 1. The sam- ple mean and sample standard deviation of A UC v alues ov er the test folds are rep orted within the second column of the table. T able 1. Results for predicting key decision times Metho d A UC ± Std. Precision Recall F-measure SVM-Linear 0.87 ± 0.05 0.89 0.87 0.88 Logistic regression 0.87 ± 0.05 0.70 0.56 0.62 SVM-RBF 0.86 ± 0.06 0.86 0.95 0.90 EM-GMM 0.57 ± 0.06 0.68 0.48 0.56 NB-Ga ussian 0.56 ± 0.10 0.88 0.81 0.84 Kmeans 0.48 ± 0.24 0.69 0.34 0.45 The prediction quality , with resp ect to the AUC, is v ery similar for SVM- Linear, Logistic Regression, and SVM-RBF. All three methods show high A UC Learning About Meetings 5 v alues around 0.86 or 0.87. The three other methods do not perform nearly as w ell. Naïve Bay es has v ery strong indep endence assumptions that are clearly violated here. EM-GMM is a non-conv ex approac h that has a tendency to get stuc k in lo cal minima. Both EM-GMM and K-Means are unsupervised, so they do not get the benefit of b eing trained on human-labeled data. W e remark that the predictive p erformance given by some of these algorithms is quite high giv en that the imbalance ratio is only 3 to 1 (three “no decision made” examples for eac h “decision made” example). Logistic regression performed w ell with respect to the AUC, but not with resp ect to the other measures. AUC is a rank statis- tic, whereas the other measures are relative to a decision boundary . Th us, if the decision b oundary is in the wrong place, precision, recall, and F-measure suf- fer, regardless of whether the p ositiv es are generally given higher scores than the negativ es. (There is an in-depth discussion b y Ertekin and Rudin [2011] on logis- tic regression’s p erformance with resp ect to the A UC.) The opp osite is true for Naïv e Bay es, where the decision b oundary seems to b e in the righ t place, leading to go od classification p erformance, but the relative placemen t of p ositiv es and negativ es within the classes lead to rank statistics that are not at the level of the other algorithms. This could p oten tially be due to the choice of scoring mea- sure used for the A UC, as the choice of scoring measure is not unique for Naïv e Ba y es. W e c hose P ( y = 1) Q j ˆ P ( x j | y = 1) , where the empirical probability is computed ov er the training set. (Here y = 1 indicates decisions b eing made, and x j is the j th feature v alue.) It is p ossible that even if an example scored highly for b eing a member of the p ositive class, it could score even more highly for b eing a member of the negative class, and thus b e classified correctly . Thus, care should be taken in general when judging Naïve Ba y es by the AUC; in this case, quan tities computed with respect to the decision b oundary (true p ositiv es, false p ositiv es, etc.) are more natural than rank statistics. T able 2. F eature ranking using SVM co efficien t Ranking Dialogue Acts λ ± Std. 1 Information 0.30 ± 0.031 2 Information Request 0.11 ± 0.03 3 Offer -0.0076 ± 0.04 4 A ction-directive -0.0662 ± 0.04 5 Reject -0.20 ± 0.03 6 A ccept -0.27 ± 0.02 W e can use the SVM co efficien ts to understand the distribution of dialogue acts during the important parts of the meeting. As it turns out, the imp ortan t parts of the meeting are characterized mostly by information and information request dialogue acts, and very few offers, rejections, or acceptances. This is sho wn in T able 2. W e hypothesize that at the imp ortant parts of the meeting, when the decisions hav e b een narrow ed down and few choices remain, the meeting 6 Kim and Rudin participan ts would like to ensure that they hav e all the relev an t information necessary to mak e the decision, and that the outcome will fit within all of their constrain ts. This small exp erimen t has implications for the practical use of machine learn- ing for automated meeting recording and assistance softw are. First, it is p ossible to obtain at least 0.87 AUC in detecting the time frame when decisions are made . An algorithm with this level of fidelity could b e useful, for instance, in searc hing through large quantities of meeting data automatically (rather than manually scrolling through eac h meeting). One could en vision having soft w are create an alert that key decisions are being made, so that upp er-level managemen t can then choose to join the meeting. Or the soft w are could inform secretarial staff of an estimate for when the meeting is done in order to facilitate schedule planning. (T o do this, how ev er, it might b e useful to incorp orate knowledge from Section 4 ab out the expected length of the wrap-up time.) 3 Question ii: Is there a pattern of in teractions within a meeting? There is often a mixture of so cial and work-related utterances during a meeting, and it is not obvious how the tw o interact. In particular, we would like to study the w a y in which so cial acts (p ositiv e or negative) interact with work-related acts (i.e., acceptance or rejection of prop osals). More abstractly , we w ould lik e to know if there is a “quintessen tial representation” of interactions within a meet- ing, where a representation is a directed graph of dialogue acts. If there is suc h a representation, w e would lik e to learn it directly from data. T o do this, w e will presen t a discrete optimization approac h that uses the notion of “template in- stan tiation.” The optimization will be performed via sim ulated annealing. First, let us formally define the problem of template discov ery . 3.1 F ormalization of the Problem of T emplate Disco v ery W e define a template as a graph, where each no de takes a v alue in the set of dialogue acts, and the graph has directed edges from left to right, and additional bac kw ards edges. F ormally , let Λ be the set of p ossible dialogue acts ( Λ n is a string of length n ). Sp ecifically , define the set D as D : ( n ∈ { 1 , · · · , L } ) × Λ n × Π B ,n so that D is a set of templates with length of size n ≤ L , where if the template is of size n , there are n dialogue acts. There are forw ard edges b et w een neighboring no des (i.e. dialogue acts). Π B ,n is the set of all p ossible backw ard arro ws for the template, containing at most B bac kw ard arrows. One can represent Π B ,n as the set of n × n low er diagonal binary matrices, 1’s indicating backw ard arrows, with at most B v alues that are 1. Let X b e the set of meetings, which are strings Learning About Meetings 7 consisting of an arbitrary n um ber of elemen ts of Λ . Define the loss function l : D × X → Z + as l ( t, x ) := min t j ∈ instan ( t ) [ dist ( t j , x )] where dist is edit distance, dist : Λ n 1 × Λ n 2 → Z + for strings of lengths n 1 and n 2 . W e define instan ( t ) as the set of template instantiations t j of the template t , where a template instan tiation is a path through the graph, beginning or ending anywhere within the graph. The path is a sequence of elements from Λ . Consider for instance the example template at the top of Figure 1. T wo example template instan tiations are pro vided just below that. The edit distance betw ee n t w o strings is the minim um n um ber of insertions, deletions, and/or substitutions to turn one string in to the other. Each meeting x is a string of dialogue acts, and each template instan tiation t j is also a string of dialogue acts, so the edit distance is w ell-defined. Fig. 1. Example template instan tiations. The template is at the top, and t w o instan- tiations are b elo w. W e assume that we are giv en meetings x 1 , · · · , x m dra wn indep endently from an unknown probabilit y distribution µ o v er possible meetings X . Define empir- ical risk R emp ( t ) : D → R + and true risk R true ( t ) : D → R + as: R emp ( t ) := 1 m m X i =1 l ( t, x i ) and R true ( t ) := E x ∼ µ [ l ( t, x )] . W e can bound the difference b et w een the empirical risk and true risk for the problem of template disco v ery as follo ws: Theorem 1. F or al l δ > 0 , with pr ob ability at le ast 1 − δ with r esp e ct to the indep endent r andom dr aw of me etings x ∼ µ , x i ∼ µ , i = 1 , ..., m , and for al l templates t in D with length at most L and with numb er of b ackwar ds arr ows at 8 Kim and Rudin most B : R true ( t ) ≤ R emp ( t ) + v u u u u u t log L X n =0 | Λ | n min( B ,n ) X b =0 n ( n − 1) / 2 b + log 1 δ 2 m , wher e | Λ | is the numb er of elements in the set Λ . The pro of is in the Appendix. This framew ork for macro-pattern discov ery leads naturally to an algorithm for finding templates in real data, whic h is to minimize the empirical risk, regu- larized b y the n um b er of bac kw ards arro ws and the length of the template. 3.2 Macro-P atterns in Meetings Let us explain the data pro cessing. W e selected the annotations that were mean- ingful in this con text, namely: so cially p ositiv e act, so cially negative act, negative assessmen t act and p ositiv e assessment act. This allows us only to fo cus on as- sessmen ts (either so cial or work related), as they may hav e a generally more p o w erful effect on the trends in the conv ersation than other dialogue acts. That is, the assessments create a “macro-pattern” within the meeting that we wan t to learn. Rep eated dialogue acts by the same p erson w ere coun ted as a single dialogue act. The selected data con tain 12,309 dialogue acts, on a v erage 130 acts p er meeting. W e w ould like to kno w if all or most meetings ha v e something in common, in terms of the pattern of dialogue acts throughout the meeting (e.g., a smaller sub-con v ersation in which certain dialogue acts alternate, follo w ed b y a shift to a differen t sub-conv ersation, and so on). If this w ere the case, a template for meetings could b e a directed graph, where each meeting appro ximately follo ws a (p ossibly rep etitiv e) path through the graph. Time migh t lo osely follow from left to right. W e thus learn the directed graph b y optimizing the following regularized risk functional using discrete optimization: F ( template t ) = 1 m X meetings i min t j ∈ instan ( t ) [ dist ( t j , meeting i )] + C 1 length ( t ) + C 2 bac kw ( t ) , (1) whic h is a regularized v ersion of the empirical risk defined abov e. Intuitiv ely , (1) c haracterizes how well the set of meetings matc h the template using the first term, and the other tw o terms are regularization terms that force the template to b e sparser and simpler, with most of the edges p ointing forwards in time. The smaller templates hav e the adv an tage of being more interpretable, also ac- cording to the b ound ab o v e, smaller templates encourage better generalization. The length ( t ) is the num ber of nodes in template t . The v alue of bac kw ( t ) is the n um b er of backw ards directed edges in the template graph. W e c hose C 1 = 1 Learning About Meetings 9 and C 2 = 0 . 1 to force few er bac kw ards edges than forw ards edges, meaning a graph that follo ws more linearly in time. T emplate instantiations alwa ys follow paths that exist within the template, whereas a real meeting will likely never exactly follo w a template (unless the tem- plate is o v erly complex, in whic h case the algorithm has wildly o v erfit the data, whic h is preven ted by v alidation). Our calculation for min t j ∈ instan ( t ) [ dist ( t j , meeting i )] in the first term of (1) is approximate, in the sense that the min ov er all templates is calculated ov er all template instan tiations that are approximately the same length as the meeting i , rather than ov er all instan tiations. As it is likely the minim um w ould b e achiev ed at an instantiation with appro ximately the same length as the meeting, this is a reasonable assumption to mak e in order to make the calculation more tractable. W e optimiz e (1) ov er templates using sim ulated annealing, as sho wn in Al- gorithm 1. Sim ulated annealing probabilistically decides whether it will mov e to a neigh boring state or stay at the current state at each iteration. The neigh- b orhoo d is defined as a set of templates that are edit distance 1 aw a y from the curren t template under allow able op erations. The allow able operations include insertion of a new node b et w een an y tw o no des or at the b eginning or end of the template, deletion of a no de, insertion or deletion of backw ards directed edges. F or the prop osal distribution for sim ulated annealing, eac h op eration is randomly c hosen with uniform probability . The acceptance probability of the new template is 1 if the proposed ob jective function v alue is less than the current v alue. If the prop osed v alue is larger than the curren t v alue, the acceptance function accepts with probability exp ( − ∆F /T ) where ∆F represents the difference in ob jective function v alue, namely the prop osed function v alue minus the curren t function v alue, and T is the current temp erature (lines 19-27 in Algorithm 1). The an- nealing schedule is T = T 0 · 0 . 95 k , where k = 800 is the annealing parameter and T 0 = 1000 is the initial temp erature. After ev ery k accepted steps, we restarted the optimization starting at the b est p oin t so far, resetting the temperature to its initial v alue. The maximum iteration n um ber was set at 4000. W e ran the algorithm starting from 95 different initial conditions, each initial condition corresp onding to one of the true meetings in the database. These 95 exp eriments were p erformed in order to find a fairly full set of reasonable templates, and to also determine whether the algorithm consistently settled on a small set of templates. The results were highly self-consistent, in the sense that in 98% of the total exp erimen tal runs, the algorithm conv erged to a template that is equiv alen t to, or a simple instantiation of, the one shown in Figure 2. This template has a v ery simple and strong message, whic h is that the next judgmen t following a negative assessment is almost never a so cially p ositive act. The conv erse is also true, that a so cially positive act is rarely follo w ed by a negativ e assessmen t. T o assess the correctness of this template, we note that of the 1475 times a so cially p ositiv e act app ears, it is adjacen t to a negativ e assessment 141 times. Of the 991 times a negative assessment app ears, 132 times a so cially p ositiv e act is adjacent to it. One can contrast these n um bers with the p ercen t of time a 10 Kim and Rudin Algorithm 1 Discrete optimization algorithm for learning meeting templates 1: Input: Starting template t 0 , m meetings, constants C 1 , C 2 , initial temp erature T 0 . 2: Initialize t = t 0 , t best = t 0 , i ter = 0 , k = 800 , set F ( t o ) . 3: while (! conv erged ) ∩ ( iter < Maximum Iteration ) do 4: if mo d ( iter ) = k then 5: T ← T 0 where T 0 is initial temp erature, t ← t best 6: end if 7: N t ← get_neighborho o d_templates( t ) 8: c ho ose t 0 ∈ N t uniformly a t random 9: length ( t 0 ) ← n umber of no des in template t 0 10: bac kw ( t 0 ) ← n umber of backw ards edges in template t 0 11: for all meetings i ≤ m do 12: instan ( t 0 ) ← set of template instantiations (sufficient to use only ones with length ≈ length o f meeting i ) 13: for all instan tiations t j ∈ instan ( t 0 ) do 14: d t 0 ij = edit_distance ( t j , meeting i ) 15: end for 16: d t 0 i ← min j ( d t 0 ij ) 17: end for 18: F ( t 0 ) ← 1 m X i d t 0 i + C 1 length ( t 0 ) + C 2 bac kw ( t 0 ) 19: if F ( t 0 ) < F ( t ) then 20: t ← t 0 , acc ept jump with probabilit y 1, iter ← iter + 1 , F ( t ) ← F ( t 0 ) 21: if F ( t 0 ) < F ( t best ) then 22: t best ← t 0 23: end if 24: else 25: t ← t 0 with probabilit y exp ( − ∆F /T ) where 26: ∆F = F ( t 0 ) − F ( t ) . If accepted, then iter ← iter + 1 , F ( t ) ← F ( t 0 ) 27: end if 28: T ← T 0 ∗ 0 . 95 iter (up date temp erature) 29: end while p ositiv e assessmen t is adjacen t to a so cially p ositiv e act (68%), though there are generally more p ositiv e assessments than either so cially p ositiv e acts or negative assessmen ts, which intrinsically low ers the probabilit y that a socially positive act w ould be adjacent to a negativ e assessmen t; how ev er, even kno wing this, there could b e more pow erful reasons wh y so cially positive acts are asso ciated with p ositiv e assessmen ts rather than negativ e assessmen ts. F rom a so cial p erspective, this result can b e view ed as somewhat counterin tu- itiv e, as one migh t imagine w an ting to encourage a colleague so cially in order to comp ensate for a negativ e assessmen t. In practice, how ev er, sometimes positive so cial acts can sound disingenuous when accompanying a negative assessmen t. This can be demonstrated using the following pairs of dialog from within the Learning About Meetings 11 Asse ss P ositive S oc iall y P ositive Asse ss Ne gative So ci a l l y P o s i ti v e A s s es s P o s i ti v e A s s es s N eg a ti v e So ci a l l y P o s i ti v e A s s es s P o s i ti v e So ci a l l y P o s i ti v e A s s es s P o s i ti v e A s s es s P o s i ti v e A s s es s N eg a ti v e A s s es s P o s i ti v e A s s es s N eg a ti v e A s s es s P o s i ti v e So ci a l l y P o s i ti v e A s s es s P o s i ti v e A s s es s P o s i ti v e Conve r g e d T e mplate ( 98% ) I n s tan tiati o n o f th e tem p late 1 : 4 1 % I n s tan tiatio n o f th e tem p late 2 : 14% I n s tan tiatio n o f th e tem p late 3 : 4 3 % A s s es s P o s i ti v e A s s es s N eg a ti v e A s s es s P o s i ti v e A s s es s N eg a ti v e So ci a l l y P o s i ti v e Fig. 2. The template representing the interaction of social and work related acts. Sp ecific template instantiations and ho w often they o ccurred in the exp eriment are also provided. AMI Corpus (that are not truly side by side): 1) “But I though t it was just com- pletely p oin tless.” “Sup erb sk etc h b y the w a y .” 2) “Brilliantly done.” “It’s gonna inevitably sort of start looking like those group of sort of ugly ones that we saw stac k ed up.” 3) “It’d be anno ying.” “Y eah, it was a pleasure working with you.” 4) “No, a wheel is b etter.” “All thanks to Iain for the design of that one.” In these cases a p ositiv e social act essentially becomes a negative social act. The algorithm introduced here found a macro pattern of assessmen ts that is prev alent and yields insigh t in to the interaction betw een so cial and work related dialogue acts. This demonstrates that machine learning can b e used to illuminate fundamen tal asp ects of this domain. This knowledge is general, and could b e used, for instance, to help classify assessments when they are not lab eled, and to potentially help reconstruct missing/garbled pieces of dialogue. These are necessary elements in building any type of meetings analysis assistant. T o our kno wledge, the macro pattern we found has not b een previously noted in the literature. 3.3 Exp erimen tal Comparison with Other Metho ds In this section, w e compare our results with other methods, particularly profile Hidden Marko v Mo del (HMM) and Marko v c hain. W e fo cus on comparison of results in this section, how ev er, further in depth discussion is pro vided in Section 6. Profile HMM is a tool to find and align related sequences, and matc h a new sequence to kno wn sequences. The structure of a profile HMM has forward arro ws b et w een match states, along with delete and insertion no des that allow an y string to fit into the template. Profile HMM shares similar features with 12 Kim and Rudin our algorithm, in that it finds a common sequence given sequences with differen t lengths. T o create a profile HMM, there are a series of heuristic steps. One wa y of learning profile HMM, used to pro duce T able 3, is the following. First, w e choose the length of the HMM. Second, we estimate the parameters in the HMM mo del using pseudo-counts for the prior. Third, we find the most likely string to b e emitted from eac h matc h state. As mentioned ab o v e, the length of a profile HMM is generally sp ecified by the user. T able 3 sho ws profile HMMs with a v ariety of lengths specified. W e were not able to reco v er the full pattern with profile HMM that our metho d pro duced, but we were able to see, for instance, that so cially p ositiv e acts are often next to positive assessments, which is one of the instantiations of the template our metho d disco v ered. T able 3. Profile HMM (SP: So cially p ositiv e, AP: Assess p ositiv e, AN: Assess negative) Length sp ecified Result 3 SP → AP → AP 5 SP → AP → SP → AP → AP 10 SP → AP → SP → AP → AP → AP → AP → AP → AP → AP 20 SP → AP → SP → AP → AP → AP → AP → AP → AP → AP → AP → AP → AP → AP → AP → AP → AP → AP → AP → AP W e note that a first-order Mark o v chain could b e used to mo del transitions b et w een no des, how ev er, since a Marko v chain records all p ossible transition probabilities, it is not clear in general ho w to turn this into a template that w ould yield insigh t. On the other hand, once we provide a template lik e the one in Figure 2, it is easy to see the template within the Marko v chain. The first-order Marko v chain for the meetings data, learned using maximum likeli- ho od estimation, is provided in Figure 3. This learned Mark o v chain supp orts our learned template, as the four highest transition probabilities exactly repre- sen t our learned template — with high transition probabilities b etw een so cially p ositiv e and assess positive, and betw een assess negativ e and assess p ositiv e. The reason that socially negativ e did not appear in Figure 2 (as it should not) is b ecause the n um ber of socially negativ e dialogue acts is muc h smaller than the num ber of other dialogue acts (only 1%). This is an imp ortan t difference b et w een a Marko v c hain and our algorithm — our algorithm picks the dominant macro pattern, and has the ability to exclude a state (i.e. dialogue act) if there is no strong pattern in v olving that state. The Marko v chain, on the other hand, is required to model transition probabilities b et w een all states that exist within the data. W e also note that it is p ossible for our method to choose forw ard arrows with very low transition probabilities in the Marko v chain, so looking at only the high probabilit y transitions will not suffice for constructing a template that minimizes our risk functional. Learning About Meetings 13 0 . 9 S o c i a l l y Po si t i ve S oc i a l l y N e ga t i ve 0 . 5 3 0 . 0 1 5 0 . 08 3 A s s e ss P os i t i v e A ss e ss N e ga t i ve 0 . 02 3 0 . 4 4 0 . 08 2 0 . 9 0 0 . 0 0 9 0 . 1 2 0 . 5 2 0.62 Fig. 3. Learned Mark o v Chain 4 Question iii: How long is this meeting going to last giv en that the decision has already b een made? Meetings sometimes last longer than exp ected. Ev en when all the decisions seem to b e made, it often takes some time to work out the details and formally end the meeting. W e would like to know whether it is possible to predict when the meeting is going to b e o v er if w e kno w when the decisions are made. Figure 4(a) displa ys meetings along the horizon tal axis, ordered b y total meeting time. The annotated time when key decisions are all made (discussion finishing times) are indicated b y blue squares, and the total meeting times are indicated by red squares for each meeting. Figure 4(b) shows the time b etw een when key decisions are made on the x-axis, and the wrap-up time on the y- axis (this is the time sp en t after key decisions are made and b efore the meeting finishes). With a simple piecewise linear formula, one can predict with relativ ely high accuracy what the wrap-up time will be, given the time at which the k ey decisions are finished b eing made. Denoting the time to complete key decisions b y x , the estimated wrap-up time is as follows: If x ≤ ab out 14 minutes, the wrap-up time is ab out 0 . 923 + 4 . 78 min utes. If x > about 14 minutes, the wrap- up time is − 0 . 47 x + 24 . 53 minutes. There are some in teresting implications: if the meeting was efficient enough to make all the decisions within 14 minutes, then the team will also b e efficient in wrapping up. Once the meeting has gone ab out 14 minutes without all decisions made, then p eople also tend to sp end more time wrapping up. If the meetings runs very long without decisions b eing made, then once the decisions are made, the meeting tends to wrap up quickly . These results are sp ecific to meetings whose length is less than an hour as in the AMI corpus, which, according to Romano Jr and Nunamaker Jr [2001] is true 26% of the time; it w ould b e interesting for future w ork to see if a piecewise linear mo del works well for meetings of other lengths, though this hypothesis cannot curren tly b e v erified b y an y database that w e are a w are of. 14 Kim and Rudin (a) T otal meeting time (red) and discussion ending time (blue). (b) “W rap-up” time vs . time un til decisions are made. Fig. 4. T otal meeting time and wrap-up time Learning About Meetings 15 5 Question iv: Do p ersuasiv e w ords exist? A “go od” meeting might b e one where we ha v e con tributed to the team effort. W e alwa ys wan t to suggest go od ideas and w an t the team members to accept those ideas. Numerous articles claim that how w e pack age our ideas, and our c hoice of w ords, is sometimes as imp ortan t as the idea itself [Olsen, 2009, Carl- son, 2012]. W e are in terested in understanding this hidden factor in the team’s decision making process. Are there patterns in suggestions that are accepted v ersus rejected? Can w e use this to impro v e ho w w e presen t ideas to the team? T o select data for this section, w e chose a bag-of-words representation for eac h “suggestion” dialogue act. W e gathered a set of all words that o ccurred in all suggestions, excluding stop words, leading to a 1,839 dimensional binary v ector representation for eac h suggestion. The lab els were determined by the annotations, where accepted suggestions received a +1 label, and rejected sug- gestions receiv ed a − 1 lab el. 5.1 Are published sets of p ersuasive w ords really p ersuasiv e? W e would like to kno w whether the p ersuasiv e words of Olsen [2009], Carlson [2012] are truly p ersuasiv e. These w ords are not domain-sp ecific, meaning that they do not depend on the topic of the meeting, and could th us be more gener- ally useful. Note that the data cannot tell us (without a controlled experiment) whether there is a truly causal relationship b et w een using p ersuasiv e words and ha ving a prop osal accepted; ho w ev er, we can study correlations, which provide evidence. An important first question is whether the prop ortion of p ersuasiv e w ords in accepted suggestions differ significan tly from the prop ortion of p ersua- siv e w ords in rejected suggestions. W e mark ed eac h suggestion as to whether or not one of the words in Olsen [2009], Carlson [2012] app ears. W e also mark eac h suggestion as to whether it is an accepted or rejected suggestion. Of the 139 times that a suggestion contained persuasive w ords from Olsen [2009], Carlson [2012], 134 of these app earances were within accepted suggestions (96% of ap- p earances). Of the 2,185 times a suggestion did not contain an y of the words from Olsen [2009], Carlson [2012], 1,981 of these app earances were within accepted suggestions (90% of app earances). Using Fisher’s exact test, the difference in prop ortions is significant at the 0.01 level (p v alue 0.0037); it app ears that per- suasiv e w ords do app ear more often in accepted suggestions than other w ords do. On the other hand, we tested each p ersuasiv e word individually , to see whether the n um b er of accepted suggestions it app ears in is significan tly dif- feren t than the proportion of rejected suggestions it app ears in. The difference b et w een the t w o prop ortions was not significan t at the 0.05 lev el for any of the p ersuasiv e w ords, again using Fisher’s exact test for differences b et w een prop or- tions. Perhaps this is b ecause eac h w ord individually is rare, while the collection is not. This b egs the question as to whether there are w ords that themselves sho w a significan t difference in the proportion of accepted suggestions they ap- p ear in. A related question is whic h words are the most imp ortan t, in terms of 16 Kim and Rudin predictiv e mo deling, for distinguishing accepted and rejected suggestions. W e will answ er b oth of these questions below, the latter answ ered first. 5.2 Using SVM coefficients to tell us ab out p ersuasiv e words In this section, we try to discov er persuasive words from data alone, and after- w ards compare to the published lists of p ersuasiv e w ords. Sp ecifically , we wan t to know whether w e can predict if a suggestion would b e accepted or rejected solely based on w ords that are used, not based on the idea within it. A standard w a y to do this is to apply a linear SVM with cross-v alidation for the tradeoff parameter, and examine the v alues of its co efficien ts; this provides a ranking of features, and a rough measure of how important eac h w ord is to the ov erall classifier [e.g., see Guy on et al., 2002]. The set of 2,324 suggestions with 1,839 features (one feature p er unique word) w as separated into 5 folds using eac h in turn as the test set, and the SVM accuracy was 83% ± 2.1%. Note that the SVM has no prior knowledge of what p ersuasiv e w ords are. Persuasiv e words iden tified by the SVM are considered to be w ords with large absolute co efficien t v alue (normalized) ov er all 5 folds. These include “things,” “start,” “meeting,” “p eople,” “yeah.” Many of the p ersuasiv e w ords concerned the topic of marketing (“mark et,” “presentation,” “gimmic k,” “logo”) and non-persuasive w ords included “buttons,” “sp eec h,” “LCD,” “recognition,” and more often words sp ecific to the topic of creating a remote con trol (“scroll,” “green”). The next question is whether these learned p ersuasiv e w ords make sense. T o answ er this, we chec k ed whether the persuasive w ords from Olsen [2009], Carlson [2012] had p ositiv e or negativ e SVM co efficien ts. The ov erlap betw een our set of 1,839 w ords and the persuasive w ords from Olsen [2009], Carlson [2012] is 29 words. Their a v erage co efficien t v alues o v er 5 folds are shown in T able 4. The finding is consisten t with the Fisher’s exact test result in Section 5.1 — not a single w ord has a large positive coefficient and all w ords ha v e relativ ely large standard deviations, showing lac k of their individual connection to p ersuasiv eness. In what follo ws w e will explore a differen t metho d for feature ranking, where the space is reduced to only w ords that o ccur in significantly different prop ortions b et w een accepted and rejected suggestions before applying an SVM. 5.3 Whic h words are individually p ersuasiv e? W e hav e 2,324 suggestions in an 1,839 dimensional space. Fisher’s exact test is based on the hypergeometric distribution and has the benefit that it can be used for features that are rarely presen t. It considers whether the suggestions contain- ing the feature hav e significantly different prop ortions of acceptance and rejec- tion. The s elected p ersuasiv e words are shown in T able 5 with their asso ciated p v alues, where the most significant w ords are at the top of the list. W e can also find non-p ersuasiv e words that are significan t according to Fisher’s exact test. T ogether with the p ersuasiv e w ords, this giv es us a set of important features to use as a reduced feature space for mac hine learning. Some of the non-p ersuasiv e Learning About Meetings 17 T able 4. List of p ersuasiv e words on which SVM and the articles [Olsen, 2009, Carlson, 2012] agree/disagree Agrees Disagrees W ords λ ± Std. W ords λ ± Std. strength 0.006 ± 0.0026 inspiration -0.0002 ± 0.003 free 0.0054 ± 0.0031 driv e -0.0002 ± 0.0011 go od 0.0048 ± 0.0015 easy -0.0004 ± 0.003 p o w er 0.0043 ± 0.0032 health -0.0005 ± 0.0022 a void 0.0039 ± 0.0011 creativit y -0.0016 ± 0.0021 offer 0.0036 ± 0.0035 guaran tee -0.0017 ± 0.001 sa ve 0.003 ± 0.0036 explore -0.0017 ± 0.001 safe 0.0028 ± 0.0015 safet y -0.0017 ± 0.001 energy 0.0024 ± 0.0032 rein ven t -0.0017 ± 0.0009 imagine 0.0024 ± 0.0016 approac h -0.0019 ± 0.003 imp ortan t 0.0023 ± 0.002 money -0.0025 ± 0.0035 confidence 0.0019 ± 0.0027 purp ose -0.0027 ± 0.0008 w anted 0.0015 ± 0.0009 quic k 0.0015 ± 0.0009 memory 0.0015 ± 0.0009 life 0.0006 ± 0.0029 h urry 0.0005 ± 0.0029 w ords include “recognition”, “sp eec h”, “fair”, “selecting”, “flat”, “animals”, “mid- dle”, and “b ottom”. The total n um ber of features we used is 244 (where p ersua- siv e w ords and non-p ersuasiv e words were selected under the same significance threshold). After this feature reduction, w e applied SVM and achiev ed an ac- curacy of 87.2% ± 0.010%, which is higher than b efore. The SVM co efficien ts for all of the w ords that w e iden tified as being p ersuasiv e are p ositiv e, as sho wn also in T able 5. These w ords are thus p ersuasiv e b oth individually and together: they are each individually significan t in predicting accepted suggestions, and they ha v e p ositiv e predictiv e coefficients. Studying the most p ersuasive words from Fisher’s exact test, w e find that man y of these words are not specifically tied to the topic of the meeting (design- ing a remote con trol), but seem to be more generally persuasive. In fact, we can mak e informed h ypotheses about why these w ords are p ersuasiv e. Some of these observ ations help us to understand more generally how language is used during meetings. Let us consider the most significan t p ersuasiv e w ords as follo ws: • Y e ah: Dialogue segments where the word “y eah” is used include: “or y eah, ma yb e even just a limited multi-colour so it do esn’t lo ok to o childish,” “yeah, if you had one of those, just coming back to your other p oint ab out pressing the button and setting off the bleeper in the room,” “Y eah if y ou are holding it in your hand y ou could do that.” Judging from these and similar dialogue segmen ts, our hypothesis is that framing a suggestion as an agreement with a previous suggestion increases its c hances of b eing accepted. That is, if the 18 Kim and Rudin T able 5. List of p ersuasiv e words from Fisher’s exact test (higher ranking for smaller p v alues). The second column contains the p v alue from Fisher’s exact test. The third column con tains the ratio of accepted proposals when the word appeared. The fourth column con tains the ratio of accepted prop osals when the word did not app ear. The last column con tains the SVM coefficients. W ords Pv alues Ratio of accepted when app ears Ratio of accepted when not app ears SVM λ ± Std. y eah 0.012 1 (46/46) 0.90 (2069/2278) 0.011 ± 0.0021 giv e 0.020 1 (41/41) 0.90 (2074/2283) 0.010 ± 0.0015 men u 0.027 1 (38/38) 0.90 (2077/2286) 0.010 ± 0.0045 start 0.043 1 (33/33) 0.90 (2082/2291) 0.012 ± 0.0020 meeting 0.052 1 (31/31) 0.90 (2084/2293) 0.012 ± 0.0019 touc h 0.085 1 (26/26) 0.90 (2089/2298) 0.0081 ± 0.00059 discuss 0.093 1 (25/25) 0.90 (2090/2299) 0.0092 ± 0.0024 find 0.093 1 (25/25) 0.90 (2090/2299) 0.0098 ± 0.0017 mark et 0.12 1 (22/22) 0.90 (2093/2302) 0.0094 ± 0.0023 y ellow 0.12 1 (22/22) 0.90 (2093/2302) 0.0076 ± 0.0018 w ork 0.12 1 (22/22) 0.90 (2093/2302) 0.0097 ± 0.0031 go od 0.13 0.97 (37/38) 0.90 (2078/2286) 0.0029 ± 0.0035 fruit 0.13 1 (21/21) 0.90 (2094/2303) 0.0065 ± 0.0032 logo 0.15 1 (20/20) 0.90 (2095/2304) 0.0073 ± 0.0019 p eople 0.15 0.97 (35/36) 0.90 (2080/2288) 0.012 ± 0.0024 side 0.16 0.97 (34/35) 0.90 (2081/2289) 0.0056 ± 0.0039 n umber 0.16 1 (19/19) 0.90 (2096/2305) 0.0059 ± 0.0027 presen tation 0.18 1 (18/18) 0.90 (2097/2306) 0.0084 ± 0.0020 things 0.19 0.95 (45/47) 0.90 (2070/2277) 0.012 ± 0.0026 c hip 0.20 1 (17/17) 0.90 (2098/2307) 0.0066 ± 0.0026 stic k 0.22 1 (16/16) 0.90 (2099/2308) 0.0070 ± 0.0017 gonna 0.22 0.95 (42/44) 0.90 (2073/2280) 0.000063 ± 0.0057 information 0.24 1 (15/15) 0.90 (2100/2309) 0.0059 ± 0.0020 talk 0.24 1 (15/15) 0.90 (2100/2309) 0.0034 ± 0.0027 Learning About Meetings 19 idea comes across as if it w ere in line with previous thoughts b y others, the suggestion has a higher c hance of b eing accepted. This applies either when attributing the full idea to others, or just the line of thought. The case where one attributes their full idea to others in order to increase its c hances of acceptance has b een considered in popular b ooks Carnegie [1936]. • Give: “Giv e” is used in at least three wa ys, the first one o ccurring the most often: (i) giving with resp ect to the topic of the meeting, which here is either the customer or the product (“so if you wan t to giv e the full freedom to the user,” “Y ou giv e it the full functions in here,” “W e can give them smo oth k eys”), (ii) giving to the meeting participan ts (“would give us a little bit of a marketing nic he”), and (iii) to indicate that suggestions are based on previous data or knowledge (“given these parameters that w e’re just gonna sort of ha v e this kind of uh non-remote remote”, “giv en sp eech recognition I think y ou should go for the less fancy c hip”). • Menu: This w ord seems to be tied to the topic of remote con trols (“Um and one other suggestions I’d make is to in is to include in a menu system”), without a general h yp othesis for other t ypes of meetings. • Start: Our hypothesis is that the w ord “start” giv es group mem bers the opp ortunit y to agree, where agreemen t of basic suggestions provides an indi- cation that group members wan t to b e productive during the meeting; e.g., “Shouldn’t we start with the most imp ortan t parts?” “I will start by the basic one.” This type of agreement may help with alliance building early on in the meeting. • Me eting: The word “meeting” often app ears in suggestions about what not to discuss: “Or ma ybe this is something for the next meeting,” “I figure w e could get back to it on the next meeting actually ,” “W e tak e it to the other meeting.” Our h ypothesis is that suggesting that a topic b elong to a later meeting may be a w a y to gently c hange the topic or mov e the curren t meeting along. It can b e used instead of a negativ e assessment of a previous suggestion. • T ouch: This seems to b e tied to the topic of remote controls, “So we put a touc h pad on it,” “W e can uh do a touch-pad on our remote.” • Discuss: This word app ears mainly in an organizational con text for the meet- ing: “And then w e can discuss some more closely ,” “I think w e shouldn’t discuss an y p oin ts p oin ts that long,” “Ma ybe we should centralise the dis- cussion here.” It seems that often, p eople tend to agree with organizational suggestions ab out the meeting. • Find: Our hypothesis is that “find” is often used in suggestions to gather more information or do more work, and these are suggestions that are often accepted: “we hav e to find out if it’s p ossible,” “um and I’m sure we can find more goals for the pro duct we are going to dev elop,” “but just try to find out what they’re willing to pa y for it.” Ha ving a collection of p ersuasiv e words can b e immediately useful, assuming that there is a causal relationship b etw een p ersuasiv e words and accepted pro- p osals, rather than only a correlation. The h yp othesis tested in this work (that 20 Kim and Rudin p ersuasiv e words tr uly exist) can also be tested for this causal relationship, and it would b e v ery interesting to create a dataset for this purp ose. If the h yp othesis do es hold, it has the p oten tial to allow ideas to b e communicated more clearly , and th us to mak e meetings more efficien t o v erall. Already w e ha v e gained some insigh t for how sp ecific words are used within meetings, and why suggestions con taining these w ords are more lik ely to b e accepted. 6 Related W ork The closest work to ours is that of the CALO (Cognitive Assistan t that Learns and Organizes) pro ject [SRI International, 2003-2009], whic h tak es a b ottom-up approac h to designing a cognitiv e assistan t that can reason and learn from users using machine learning techniques. Although the CALO pro ject’s focus (e.g., sp eec h recognition, sentence segmen tation, dialogue act tagging, topic segmen- tation, action item detection and decision extraction) do es not intersect with our w ork, it is worth while to note that this m ulti-y ear pro ject has made a definite step tow ards improving meetings using machine learning tec hniques. How ev er, as p oin ted out b y T ur et al. [2010], a num ber of challenges (e.g. extracting task descriptions) still exist b efore this tool can b e in tegrated into daily life. The insigh ts into meetings obtained through our w ork could b e used as part of a top-down approach to design suc h a tool. W e b eliev e our w ork is the first to take a truly data-driven approach to finding p ersuasiv e words; this is the first w ork to try to pro v e that a w ord is p ersuasiv e using data. Qualitative W ork: Research on group decision making processes traditionally app ears in qualitative studies. W orks along these lines attempt to understand and mo del the course of agreemen t [Blac k, 1948], design features to track the course of negotiation [Eugenio et al., 1999], dev elop theories for group decision making [Davis, 1973] and study differen t group decision-making sc hemes [Green and T ab er, 1980]. R elate d W ork for Question i: A few quan titativ e approac hes hav e attempted to detect when decisions are made. These metho ds use maxim um en trop y [Hsueh and Mo ore, 2008], linear SVMs [F ernández et al., 2008] and directed graphical mo dels [Bui et al., 2009]. A common factor of these works is that they require con ten t information (audio and video data; proso dic features, p osition within the meeting, length in words and duration etc.) that can p oten tially con tain sensitiv e information ab out what is b eing planned. Our approach requires only dialogue acts (i.e. the actual meeting con ten t is not required) to ac hiev e the same goal with relatively high accuracy . One benefit of using only dialogue acts is that the algorithm allows our results to hold independently of the sp ecific t yp e and purp ose of the meeting b eing held and can be used in situations where the meeting contains p oten tially sensitiv e information. It is also muc h simpler logistically to require collecting only dialogue acts. Learning About Meetings 21 R elate d W ork for Question ii: T o the b est of our knowledge, our work is the first to apply learning tec hniques to learn dynamical in teractions b et w een social and w ork asp ects in meetings. As discussed earlier, one could consider the method w e dev elop ed generally for learning a template from a sequence of data. Our metho d has the follo wing characteristics: 1) The loss function considers meetings instan tiated from the same template, but p ossibly with differen t lengths, to be equally go od. F or instance: if a template is ‘A’ ‘B’ ‘C’ with a bac k arrow from ‘C’ to ‘A’, then ‘ABCABC’, ‘BCABCA’, ‘CAB’ are equally go od instantiations from this template. 2) An instantiation of the template can start at any p osition, as demonstrated b y the ‘BCABCA’ and ‘CAB’ instances in the template ab o v e. 3) By optimizing the loss function we provide in Section 3, the algorithm is able to uncov er a template of exactly the desired form, despite the existence of noise. Let us compare this metho d to other graph learning tec hniques within related subfields. Petri nets are used (and were designed) to mo del concurrency and sync hro- nization in distributed systems. In learning Petri nets from data, and generally in learning w orkflo w graphs and workflo w nets (see v an der Aalst [1998]), all p ossible transitions in the data must be accounted for within the learned net (e.g., Agraw al et al. [1998]), which is the opp osite of what we w ould like to do, whic h is to create instead a more concise representation that is not necessarily all-inclusiv e. The kind of templates we disco v er should b e muc h simpler than P etri nets - for us, there is only sequen tial and iterativ e routing, and no parallel routing (no concurrency), there are no “tok ens” and th us there is no underlying w orkflo w state, and there are no conditions inv olv ed in mo ving from one place to the next (no conditional routing). One ma jor difference betw een our approach to learning macro-patterns and learning probabilistic graphical mo dels suc h as Mark o v mo dels is that our ap- proac h is deterministic (not probabilistic). W e do not mo del the probabilities of transitions b et w een states, as these probabilities are not of fundamen tal inter- est for building the template (but could b e calculated afterwards). As in other deterministic metho ds (e.g., SVM), we aim to directly optimize the quality mea- sure that the macro-pattern will b e judged b y on the data, in our case inv olving edit distance. This allows us to handle noisy data, that is, meetings that do not fit precisely into the pattern, without having to include additional nodes that complicate the template. W e do not then need a graph that handles all p ossi- ble transitions and their probabilities (as is required in Mark o v models or Petri nets). It is certainly p ossible to mo del a macro-pattern as a Marko v chain, as w e demonstrated, but the resulting transition matrix would most lik ely pro vide little insigh t. The full Marko v transition matrix w ould b e of size | Λ | × | Λ | , but distilling this to a compact one dimensional graph with mostly forward arro ws w ould then b e an additional task. Hidden Marko v Mo dels aim to infer unobserved states, where in our case, there are no natural unobserved states. Although we could artificially create hidden states, it is more natural to directly model the observed sequence. One exception to this is profile HMM’s, where hidden states are either “matc h” states, 22 Kim and Rudin “insert” states, or “delete” states [Eddy, 1998]. Metho ds for fitting profile HMM’s generally do not create backw ards edges, and thus cannot easily accommo date substrings b eing rep eated arbitrarily within the template. Profile HMM’s are designed for accuracy in aligning sequences, but they are not generally designed for conciseness or to minimize, for instance, a count of backw ards edges. Methods for learning profile HMMs generally require the user to specify the length of the HMM, whereas w e purp osely do not do this. Profile HMM’s generally hav e a fixed initial state, whereas our metho d can start an ywhere within the template. The price of a fixed initial state and fixed length with no bac kw ards edges is high; for instance for a template ‘A’ ‘B’ ‘C’ with a bac kw ards arro w from ‘C’ to ‘A,’ we can equally well accommodate patterns ‘ABCABCABC’ and ‘BCABCA,’ as w ell as ‘BC’, all of them b eing p erfect matches to our template. Profile HMM’s, with any fixed initial state, and with no backw ards arrows to allow rep eats, would require insertions and deletions for each of these patterns, and hav e difficulty viewing all of these patterns equally . Note that in general, left-to-right HMM’s cannot ha v e backw ards loops as our templates do. One might also think of automata (Narendra and Thathac har [1974], Wikip edia [2013]) as a wa y to mo del meetings. HMM’s are equiv alen t to probabilistic au- tomata with no final probabilities (see Dupont et al. [2005]), where ab o v e we discussed how our goals do not generally in v olv e hidden states. There are addi- tional c haracteristics of automata that contrast with our efforts. F or instance, probabilistic automata generally hav e a set of initial states and accepting or final (terminating) states, whereas our meetings can begin an end an ywhere in the template, and there is no notion of acceptance or rejection of a meeting to the template. F urther, an imp ortan t c haracteristic of Probabilistic Determinis- tic Finite Automata (PDF A) is that for an y giv en string, at most a single path generating the string exists in the automaton, whereas in our w ork, w e do not require this uniqueness (Guttman [2006]). Probabilistic Suffix Automata (PSA) [Ron et al., 1996] are probabilistic au- tomata with v ariable memory length, that aim to learn an order- K Marko v mo del with K v arying in differen t parts of state space. As with order-1 Mark o v c hains discussed abov e, is not clear how to construct a concise template of the form w e are considering. On the other hand, it w ould be an interesting extension of our work to k eep track of higher order patterns within the template like PSA do es. One could think of our goal in Section 3 as solving a type of case of the consensus string problem [Sim and Park, 2003, Lyngsø and Pedersen, 2002] with consensus error, but with tw o ma jor c hanges: (i) using edit distance b etw een meetings and template instan tiations as a metric, rather than betw een pairs of strings, whic h allo ws bac kw ards loops, (ii) encouraging conciseness in the template. Problems encountered when not including these asp ects w ere provided for the ‘ABC’ example ab o v e. The goal of learning metro maps [Shahaf et al., 2012] is v ery differen t than ours, since their goal is to learn a set of sp ecial paths through a graph (metro Learning About Meetings 23 lines) that hav e specific prop erties. T emp oral LDA [W ang et al., 2012] is also v ery different than our work: its goal is to predict the next topic within a stream, whereas our goal is to find a concise representation of a set of strings. R elate d W ork for Question iv: Identifying c haracteristics of p ersuasiv e sp eec h and discourse has b een of great interest in the qualitativ e research communit y [Stern thal et al., 1978, Sc heidel, 1967]. Ho w ev er, there has not been m uc h quan- titativ e researc h done on this topic. Guerini et al. [2008] studied the relationship b et w een the choice of w ords and the reaction they elicit in p olitical sp eec hes based on n umerical statistics, including counts of w ords in each document and ho w common the w ords are across all documents (tf-idf ). T o the best of our kno wledge, our w ork is the first w ork to apply machine learning techniques to learn p ersuasive w ords from free-form conv ersational meeting data, to rank p er- suasiv e words, and to compare resulting p ersuasiv e words with qualitative studies to gain insigh ts. Other me eting r elate d work: Other studies that apply mac hine learning tech- niques for meeting related topics (but not specifically related to an y of the w ork in this pap er) include meeting summarization [Purver et al., 2007], topic segmen- tation [Galley et al., 2003], agreemen t/disagreemen t detection [Hahn et al., 2006, Hillard and Ostendorf, 2003, Bousmalis et al., 2009], detection of the state of a meeting (discussion, presen tation and briefing) [Banerjee and Rudnic ky, 2004, Reiter and Rigoll, 2005], and prediction of the roles of meeting participan ts [Banerjee and Rudnic ky, 2004]. In all of this work, mac hine learning techniques are used as to ols to classify a particular asp ect of a meeting with a sp ecific ap- plications in mind. In addition to addressing different aspects of meetings, our w ork uses mac hine learning tec hniques as a w a y to to learn and study meet- ings scientifically in an attempt to bridge the gap betw een qualitative studies on understanding meetings and quan titativ e application-fo cused studies. 7 Conclusion The scientific field of meeting analysis is still in b eginning stages; meetings hav e not yet b een well c haracterized, and this is one of the first works in this new scien tific arena. Sev eral hypotheses made in this work c annot b e tested further with any current av ailable dataset. W e hop e that by illuminating the poten- tial of fully solving these problems, it will inspire the creation of new meetings corp ora. Elab orating further, if we are able to automatically detect when k ey de- cisions are made, this could translate directly in to a soft w are tool that managers could use to determine when they should join an ongoing meeting of their staff without attending the full meeting. If we kno w common patterns of dialogue, this might help us to understand so cial cues b etter for business settings, and could p oten tially help reconstruct parts of dialogue that might not hav e b een recorded prop erly . I f we can automatically detect when a meeting’s k ey decisions are made, and can accurately gauge the meeting wrap-up time, it can give us 24 Kim and Rudin something immediately v aluable, namely an estimated time for the end of the curren t meeting, which staff can use to plan ahead for the start of the next meeting, or to plan transp ortation, in a fast-paced corporate culture. If w e truly knew which words w ere p ersuasiv e, we could use these words to help con v ey our ideas in the most fav orable light. Before we can do all of this, ho w ev er, we need to understand the science b ehind meetings, and make h ypotheses that can b e tested, whic h is the goal of this w ork. Bibliograph y R. Agraw al, D. Gunopulos, and F. Leymann. Mining pr o c ess mo dels fr om work- flow lo gs . Springer, 1998. S. Banerjee and A.I. Rudnicky . Using simple speech based features to detect the state of a meeting and the roles of the meeting participants. In Pr o c e e dings of International Confer enc e on Sp oken L anguage Pr o c essing , pages 221–231, 2004. D. Black. On the rationale of group decision-making. Journal of Politic al Ec on- omy , 56(1):23–34, 1948. K. Bousmalis, M. Mehu, and M. Pan tic. Sp otting agreemen t and disagreement: A survey of nonv erbal audiovisual cues and to ols. In Pr o c e e dings of 3r d Inter- national Confer enc e on Affe ctive Computing and Intel ligent Inter action and W orkshops , pages 1–9, 2009. T. H. Bui, M. F rampton, J. Do wding, and S. Peters. Extracting decisions from m ulti-part y dialogue using directed graphical models and seman tic similarit y . In Pr o c e e dings of the 10th Sp e cial Inter est Gr oup on Disc ourse and Dialo gue W orkshop on Disc ourse and Dialo gue , pages 235–243, 2009. G. Carlson. Uplifting word list: http://www.freelance- copy- writing.com/ Uplifting- Word- List.html , 2012. D. Carnegie. How to win friends and influenc e p e ople . Simon & Sc h uster, 1936. J. H. Davis. Group decision and so cial interaction: A theory of so cial decision sc hemes. Psycholo gic al R eview , 80(2):97–125, 1973. P . Dup on t, F. Denis, and Y. Esp osito. Links b et w een probabilistic automata and hidden mark o v models: probability distributions, learning models and induction algorithms. Pattern R e c o gnition , 38(9):1349–1371, 2005. S. R. Eddy . Profile hidden mark o v models. Bioinformatics , 14(9):755–763, 1998. S. Ertekin and C. Rudin. On equiv alence relationships betw een classification and ranking algorithms. Journal of Machine L e arning R ese ar ch , 12:2905–2929, 2011. B. D. Eugenio, P . W. Jordan, J. H. Thomason, and J. D. Mo ore. The agreemen t pro cess: An empirical in v estigation of human-h uman computer-mediated col- lab orativ e dialogues. International Journal of Human Computer Studies , 53 (6):1017–1076, 1999. R. F ernández, M. F rampton, P . Ehlen, M. Purv er, and S. P eters. Modeling and detecting decisions in m ulti-part y dialogue. In Pr o c e e dings of the 9th Sp e cial Inter est Gr oup on Disc ourse and Dialo gue W orkshop on Disc ourse and Dialo gue , pages 156–163, 2008. M. Galley , K. McKeo wn, E. F osler-Lussier, and H. Jing. Discourse segmen tation of m ulti-part y conv ersation. In Pr o c e e dings of the 41st Annual Me eting of Asso ciation for Computational Linguistics , pages 562–569, 2003. S. G. Green and T. D. T ab er. The effects of three so cial decision schemes on decision group pro cess. Or ganizational Behavior and Human Performanc e , 25 (1):97–106, 1980. 26 Kim and Rudin M. Guerini, C. Strapparav a, and O. Sto c k. T rusting p oliticians’ w ords (for p ersuasiv e NLP). Computational Linguistics and Intel ligent T ext Pr o c essing , pages 263–274, 2008. O. Guttman. Pr ob abilistic Automata Distributions over Se quenc es . PhD thesis, The Australian National Univ ersit y , 2006. I. Guy on, J. W eston, S. Barnhill, and V. V apnik. Gene selection for cancer classification using support vector mac hines. Machine L e arning , 46(1-3):389– 422, Marc h 2002. S. Hahn, R. Ladner, and M. Ostendorf. Agreement/disagreemen t classification: Exploiting unlabeled data using con trast classifiers. In Pr o c e e dings of the Human L anguage T e chnolo gy Confer enc e of the North A meric an Chapter of the Asso ciation for Computational Linguistics , pages 53–56, 2006. J. Hall. Americans kno w how to b e productive if managers will let them. Or ga- nizational Dynamics , 1994. D. Hillard and M. Ostendorf. Detection of agreement vs. disagreemen t in meet- ings: T raining with unlab eled data. In Pr o c e e dings of the Human L anguage T e chnolo gy Confer enc e of the North A meric an Chapter of the Asso ciation for Computational Linguistics , 2003. P . Y. Hsueh and J. Mo ore. Automatic decision detection in meeting speech. Machine L e arning for Multimo dal Inter action , pages 168–179, 2008. G. Ji and J. Bilmes. Dialog act tagging using graphical models. In Pr o c e e d- ings of International Confer enc e on A c oustics, Sp e e ch, and Signal Pr o c essing , v olume 1, pages 33–36, 2005. T. A. Kayser. Mining gr oup gold: How to c ash in on the c ol lab or ative br ain p ower of a gr oup . Serif Publishing, 1990. R. B. Lyngsø and C. N. S. P edersen. The consensus string problem and the complexit y of comparing hidden mark o v mo dels. Journal of Computer and System Scienc es , 65(3):545–569, 2002. A. Mack enzie and P . Nic k erson. The time tr ap: The classic b o ok on time man- agement . Amacom Bo oks, 2009. I. McCo w an, J. Carletta, W. Kraaij, S. Ashb y , S. Bourban, M. Flynn, M. Guille- mot, T. Hain, J. Kadlec, V. Karaisk os, et al. The AMI meeting corpus. In Pr o c e e dings of Metho ds and T e chniques in Behavior al R ese ar ch , 2005. M. Nagata and T. Morimoto. First steps tow ards statistical mo deling of dialogue to predict the sp eec h act t ype of the next utterance. Sp e e ch Communic ation , 15(3-4):193–203, 1994. K. S. Narendra and M. A. L. Thathac har. Learning automata a surv ey . IEEE T r ansactions on Systems, Man and Cyb ernetics , 4:323–334, 1974. D. Newlund. Make y our meetings w orth ev ery one’s time: http://www.usatoday.com/USCP/PNI/Business/ 2012- 06- 20- PNI0620biz- career- getting- aheadPNIBrd_ST_U.htm , 2012. H. Olsen. 108 p ersuasiv e w ords: http://www.high- output.com/ uncategorized/108- persuasive- words/ , 2009. R. R. Pank o and S. T. Kinney . Meeting profiles: Size, duration, and location. In Pr o c e e dings of the Twenty-Eighth Hawaii International Confer enc e on System Scienc es , v olume 4, pages 1002–1011, 1995. Learning About Meetings 27 M. Purver, J. Do wding, J. Niekrasz, P . Ehlen, S. No orbaloo c hi, and S. P eters. Detecting and summarizing action items in multi-part y dialogue. In Pr o c e e d- ings of the 8th Sp e cial Inter est Gr oup on Disc ourse and Dialo gue W orkshop on Disc ourse and Dialo gue , 2007. S. Reiter and G. Rigoll. Multimo dal meeting analysis b y segmen tation and classification of meeting even ts based on a higher lev el semantic approac h. In Pr o c e e dings of International Confer enc e on A c oustics, Sp e e ch, and Signal Pr o c essing , v olume 2, pages 161–164, 2005. N. C. Romano Jr and J. F. Nunamaker Jr. Meeting analysis: Findings from researc h and practice. In Pr o c e e dings of the 34th A nnual Hawaii International Confer enc e on System Scienc es , 2001. D. Ron, Y. Singer, and N. Tishb y . The pow er of amnesia: Learning probabilistic automata with v ariable memory length. Machine le arning , 25(2-3):117–149, 1996. T. M. Sc heidel. Persuasive Sp e aking. Scott, F oresman and Compan y , 1967. D. Shahaf, C. Guestrin, and E. Horvitz. T rains of thought: Generating infor- mation maps. In Pr o c e e dings of the 21st International Confer enc e on W orld Wide W eb , pages 899–908, 2012. J. S. Sim and K. Park. The consensus string problem for a metric is NP-complete. Journal of Discr ete Algorithms , 1(1):111–117, 2003. SRI In ternational. CALO: Cognitive assistan t that learns and organizes. http: //caloproject.sri.com , 2003-2009. B. Sternthal, L.W. Phillips, and R. Dholakia. The p ersuasiv e effect of scarce credibilit y: a situational analysis. Public Opinion Quarterly , 42(3):285–314, 1978. A. Stolc k e, K. Ries, N. Co ccaro, E. Shrib erg, R. Bates, D. Jurafsky , P . T aylor, R. Martin, C.V. Ess-Dyk ema, and M. Meteer. Dialogue act mo deling for automatic tagging and recognition of con v ersational sp eec h. Computational Linguistics , 26(3):339–373, 2000. G. T ur, A. Stolck e, L. V oss, S. Peters, D. Hakk ani-T ur, J. Dowding, B. F avre, R. F ernandez, M. F rampton, M. F randsen, C. F rederickson, M. Graciarena, D. Kin tzing, K. Lev eque, S. Mason, J. Niekrasz, M. Purv er, K. Riedhammer, E. Shriberg, Jing Tien, D. V ergyri, and F an Y ang. The CALO meeting assis- tan t system. IEEE T r ansactions on Audio, Sp e e ch, and L anguage Pr o c essing , 18(6):1601–1611, 2010. W. M. P . v an der Aalst. The application of p etri nets to workflo w managemen t. Journal of Cir cuits, Systems, and Computers , 8(01):21–66, 1998. Y. W ang, E. Agich tein, and M. Benzi. Tm-lda: efficient online mod eling of latent topic transitions in so cial media. In Pr o c e e dings of the 18th International Confer enc e on Know le dge Disc overy and Data Mining , pages 123–131, 2012. Wikip edia. Probabilistic automation— Wikip edia, the free encyclop edia, 2013. URL http://en.wikipedia.org/wiki/Probabilistic_automaton . [Online; accessed 28-Ma y-2013]. 28 Kim and Rudin App endix Pro of of Theorem 1. W e will use Ho effding’s inequality combined with the union b ound to create a uniform generalization bound ov er all viable templates. The main step in doing this is to coun t the n um b er of possible viable templates. Let us do this now. Let Λ b e the set of p ossible dialogue acts, and denote | Λ | as the n um ber of elements in the set. W e will calculate the n um b er of templates that are of size less than or equal to L , which is the size of our function class in statistical learning theory . F or a template of exactly length n , there are | Λ | n p ossible assignments of dialogue acts for the templates. Also, for a template of length n , there are at most n ( n − 1) / 2 B p ossible assignments of B backw ard arrows, where B ≤ n . T o see this, consider the set of backw ards arro ws as represen ted b y an n × n adjacency matrix, where only the part b elo w the diagonal could b e 1. There are n 2 total elemen ts in the matrix, n on the diagonal, s o n ( n − 1) off diagonal elements, and n ( n − 1) / 2 elements in the low er triangle. If exactly b of these can be 1, the total n um b er of p ossibilities is at most n ( n − 1) / 2 b . There can be up to B bac kw ard arro ws, so the total n um b er of possibilities is at most min( B ,n ) X b =0 n ( n − 1) / 2 b . Note that this n um ber is an upp er b ound, as usually w e cannot ha v e more than one bac kw ards arrow lea ving or entering a no de. Finally w e could hav e n an ywhere b et w een 0 and L so the final n um b er of possible templates has upper b ound: L X n =0 | Λ | n min( B ,n ) X b =0 n ( n − 1) / 2 b . Ho effding’s inequality applies to arbitrary bounded loss functions. This, com- bined with a union b ound o v er all viable templates, yields the statement of the theorem.
Original Paper
Loading high-quality paper...
Comments & Academic Discussion
Loading comments...
Leave a Comment