Verdict Accuracy of Quick Reduct Algorithm using Clustering and Classification Techniques for Gene Expression Data
In most gene expression data, the number of training samples is very small compared to the large number of genes involved in the experiments. However, among the large amount of genes, only a small fraction is effective for performing a certain task. …
Authors: T. Ch, rasekhar, K. Thangavel
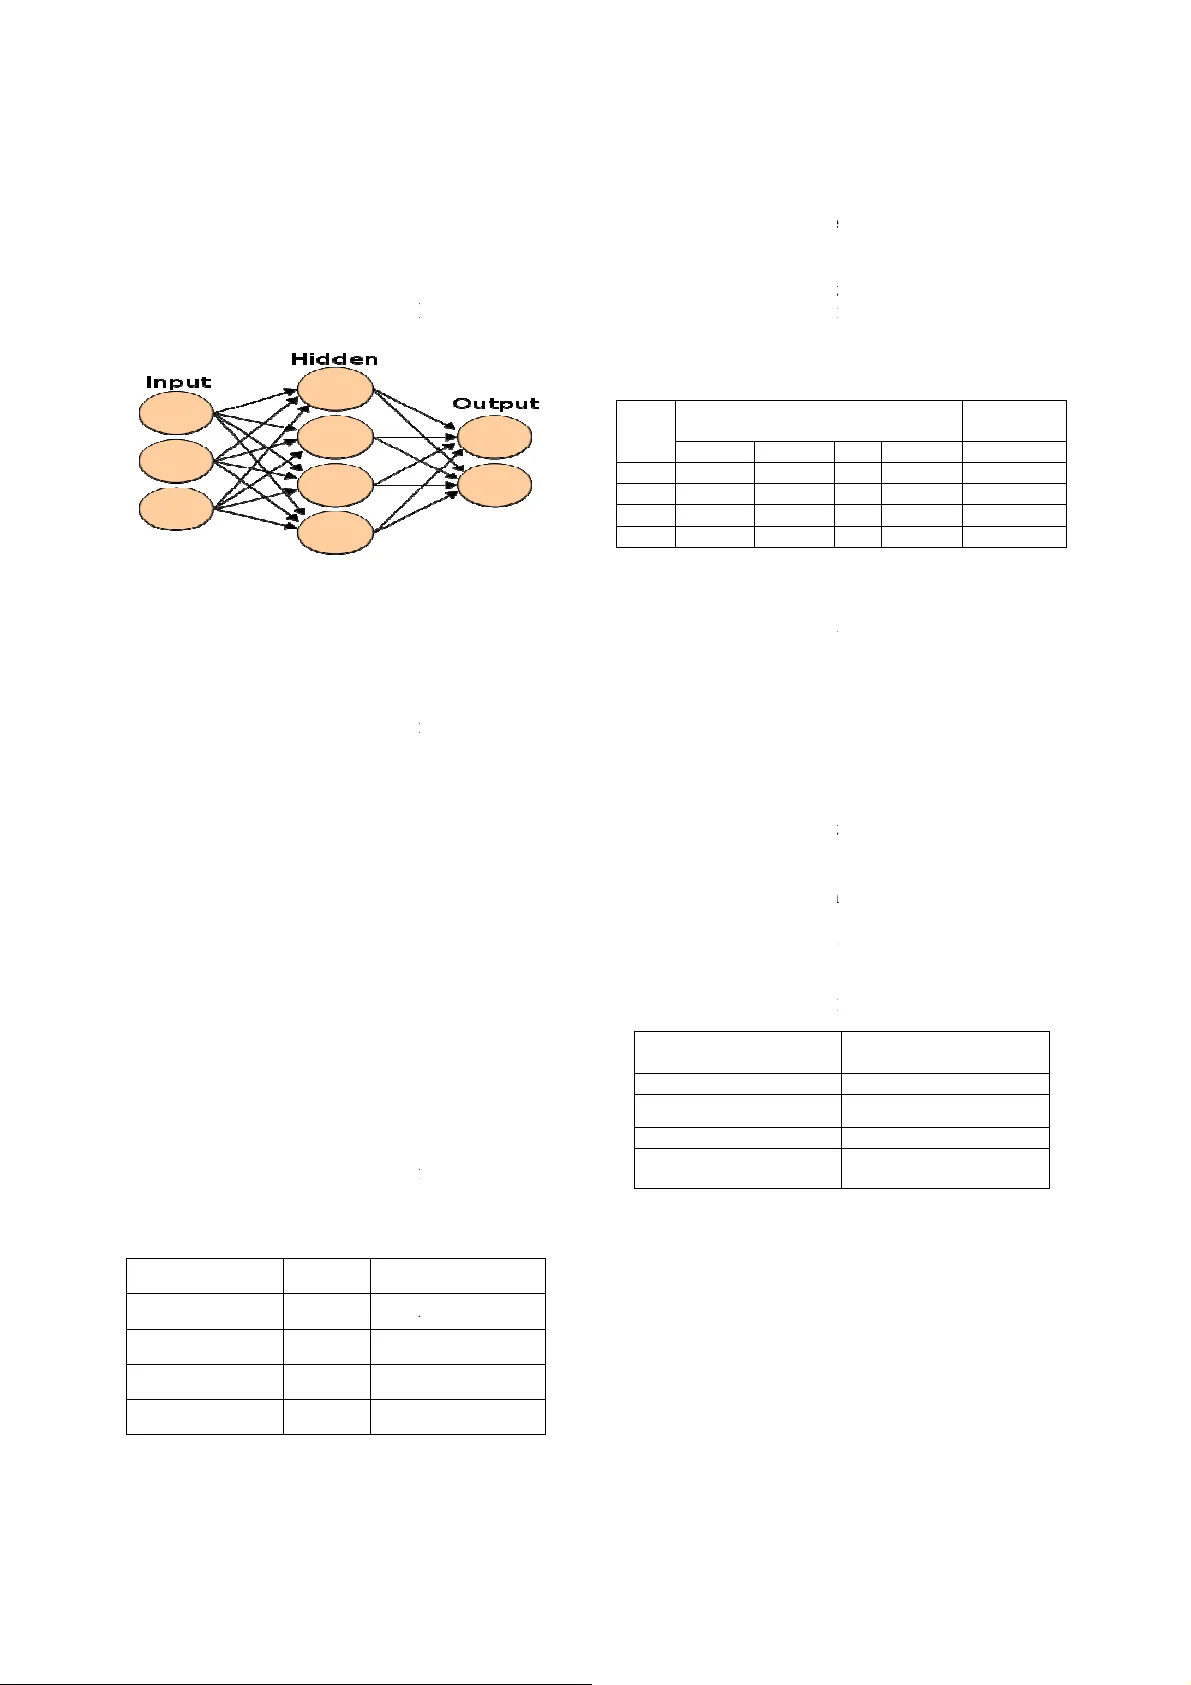
V e r d i c t A c c u r a c y o f Q u i c k R e d u c t A l g o r i t h m u s i n g C l u s t e r i n g , V e r d i c t A c c u r a c y o f Q u i c k R e d u c t A l g o r i t h m u s i n g C l u s t e r i n g , V e r d i c t A c c u r a c y o f Q u i c k R e d u c t A l g o r i t h m u s i n g C l u s t e r i n g , V e r d i c t A c c u r a c y o f Q u i c k R e d u c t A l g o r i t h m u s i n g C l u s t e r i n g , C l a s s i f i c a t i o n T e c h n i q u e s f o r G e n e E x p r e s s i o n D a t a C l a s s i f i c a t i o n T e c h n i q u e s f o r G e n e E x p r e s s i o n D a t a C l a s s i f i c a t i o n T e c h n i q u e s f o r G e n e E x p r e s s i o n D a t a C l a s s i f i c a t i o n T e c h n i q u e s f o r G e n e E x p r e s s i o n D a t a T.Chandrasekhar 1 , K.T han gavel 2 and E.N.Sathishkumar 3 1 Department of Computer Science, Periyar University, Salem, Tamilnadu-636 011, India ch_ansekh80@rediffmail.com 2 Department of Computer Science, Periyar University, Salem, Tamilnadu-636 011, India drktvelu@yahoo.com 3 Department of Computer Science, Periyar University, Salem, Tamilnadu-636 011, India en.sathishkumar@yahoo.in Abstract In most ge ne expression data, the number o f training samples is very small compared to the large nu mber of genes involved in the experiments. However , among the lar ge amoun t of g enes , only a small fraction is effective for performing a certain task. Furthermore, a small subset of g enes is desirable in developing gene expression based d iagnostic tools for d elivering reli able and understandable results. Wit h the ge ne selection r esults, the cos t of bio lo gical experiment and decision can b e greatly reduc ed by analyzing only the marker g enes. A n important application of gene expression data in functional genomics is to classify samples accordin g to their gene expres sion profil es. F eature selection (FS) is a process which attempts to select more informative features. I t is on e of the i mportant steps in knowledge discovery. Conventional supervised F S methods evaluate vari ous feature subsets usin g an evaluation f unction or metric to se lect onl y those featur es w hich ar e related to the d ecisio n class es of th e data un der consideration. This pap er studies a feature selection me thod based on ro ugh set theory. Further K-Means, Fuz zy C- Means (FCM) algorithm h ave implemented for th e r educed f eature set without consid ering class lab els. Then the obtained results a re compared with the original class labels. Back Propagation Networ k (BPN) has also been used f or cl assification. Th en the performance of K-Means , FCM, and BPN are a nalyzed thr ough the confusi on matrix. It is found that the BPN is performing well comparatively. Keywords: Rough set theory, Feature Selection, Gene Expression, Quick Reduct, K-means, Fuzzy C means, BPN . 1. Introduction Feature selection is the proces s of choosing the most appropriat e f eatures when cr eati ng the model of the process. Most of the feature selecti on m ethods are applied across the entire data set. Once such genes are chosen, the creation of classifiers o n the basi s of th e genes is another undertakin g. If we su rvey t he establi shed investigat ions in this field , we will find th at almost all th e accurate classifi cation resu lts ar e obtained bas ed on more than t wo genes. Rough sets have been used as a fe ature selection metho ds by m any res earchers among them Jense n and Schen, Zhong et al, Wang and Hu et al. T he Rough set appro ach t o feature sel ection consis ts in selecti ng a subset of f eatures wh ich can predict the cl asses a s well as th e ori ginal set of f eatures. The optimal crit erion for Rough set feature selectio n is to fi nd s hortest or minimal reducts while obtainin g high quality cla ssifi ers based o n the sel ected features. Here we pro pose a feature selecti on metho d based on r ough set theor y f or reducing genes from large gene expression database [1, 4]. Discrimina nt analysis is now wi dely u sed i n bioinf ormatics, su ch as disti nguishing can cer tissu es from norm al tissues. A probl em with gene e xpression analysis or with an y large dimensio nal dat a set is often the sel ection of s ignificant variable s (feature selecti on) within th e data set that would enable accurat e clas sification of t he dat a t o some output classes. These variabl es may be potential di agnostic markers too. T here are good r easons for redu cing the large number of variabl es: 1) An opport unity to scrutini ze individ ual genes for fu rther medi cal t reatme nt and d ru g d evelopm ent. 2) Dimensi on reductio n to redu ce t he computation al cost. 3) Red ucing th e num ber of redundant and unnecessar y variabl es ca n impro ve in ference and classification. 4) More interpretabl e features or c haracteri stics that can help i dentify and monito r the target diseas es or function types [5]. The rest of th e paper is organized as fol lows: Section 2 , bri efs about the Rough set theo ry. Sect ion 3 d escribes t he clusteri ng techniq ues. Section 4 b riefs ab out classification techniq ues. Section 5 explains briefly about experime ntal analysis an d resu lts. Section 6 presents a con clusion for this pap er. 2. Rough Set Theory Rough s et t heory (Pawl ak, 1991 ) is a fo rmal m athematical tool th at can be ap plied to reduci ng the d imensionalit y of datasets . The rou gh set attribut e reduction method rem oves redundant inp ut attribut es f rom datas ets of di screte values, all th e whil e making s ure that no info rmation is lost. The appro ach is f ast an d e fficient, mak i ng use of standard operatio ns from conventio nal set theor y [3 ]. Definitio n: Let U be a universe of di scourse, X ⊆ U , and R is a n equivalen ce relation on U . U/R represent s the s et of the equival ence class of U induced b y R . The positiv e region of X on R in U , is d efined as pos(R,X) = U { Y ∈ U/R | Y ⊆ X }. The partiti on of U , generat ed b y I ND ( P ) is denoted U / P . If ( x , y ) ∈ IND ( P ), then x and y are i ndiscerni ble by attribut es fr om P . T he eq ui valence classes o f th e P- indisc ernibilit y relation are denoted [ x ] p . The indisc ernibilit y rel ation i s t he ma thematical b asis of rou gh set th eory. Let X ⊆ U, t he P-l ower ap proximation PX a nd P - upper approximation PX of set X can be d efined as: PX= { x ∈ U | [x]p ⊆ X } (1) PX= { x ∈ U | [ x ] p ∩ X ≠ φ } (2) Let P , Q ⊆ A be eq uivalen ce relati ons over U , then t he positive, n egative and boundary regions can be defined as : X P Q Q U X P / ) ( POS ∈ ∪ = (3 ) X P U Q Q U X P / ) ( NEG ∈ ∪ − = (4) X P X P Q Q U X Q U X P / / ) ( BND ∈ ∈ ∪ − ∪ = (5) An impo rtant issue in data analysis is dis covering depend e ncies b etween attribut es d ependency ca n be defined in t he following way. For P , Q ⊆ A , P depends t otally on Q , if and onl y if IND ( P ) ⊆ IND ( Q ). That means that t he partiti on generated by P is finer t han t he partitio n generated by Q . We say t hat Q d epends o n P in a degree 0 ≤ k ≤ 1 den oted P ⇒ k Q, if U Q P Q P k ) ( POS ) ( = = γ (6) If k = 1 , Q depends t otally on P , if 0 ≤ k ≤ 1 , Q d epends partiall y on P , and if k = 0 th en Q does no t d epend on P . In other words, Q depend s totall y (partiall y) on P , if all (so me) objects of the u niverse U can b e certainl y classified to blocks of th e partitio n U / Q , emplo y i ng P . I n a decis ion system t he attribut e s et contains th e co ndition attri bute set C and decision at tribute s et D , i. e. A = C U D . The degree of dependen cy bet ween con dition and decision attributes, γ c ( D ), is called th e qualit y of appr oximatio n of classifi cation, induce d by the set of decisi on attrib utes[6,10]. 2.1 Quick Reduct A lgorithm The red uction of attributes is achie ved by co mpari ng equival ence relations generated b y s ets of attribute s. Attrib utes are r emoved so that the reduced set pro vides th e same qualit y o f cl assification as the origin al. A red uct is defined as a sub set R of the condition al attribute set C su ch th at γ R(D )= γ C(D). A given dat aset ma y have man y attrib ute reduct sets, so the setR of all r educts is defined as: Rall = {X | X ⊆ C, γ X(D) = γ C (D); γ X−{a}( D) ≠ γ X(D), ∀ a ∈ X }. (7) The inte rsection of all the sets in Rall is called the cor e, the eleme nts of which are t hose att ributes th at cannot be elimin ated without introducing mo re cont radictions to th e repre sentation of the dat aset. For m any tas ks (for example, feature selection), a reduct of mini mal cardinality is id eally searc hed fo r. T hat is, an attempt is to b e made to locate a single element of th e reduct set Rmin ⊆ Rall : Rmin = {X |X ∈ Rall, ∀ Y ∈ Rall, | X | ≤ |Y|}. (8) The Q uick R educt al gorithm shown b elow[8, 9], it searc hes for a mi nimal subset without exhaustively generatin g all possib le su bsets. The s earch begins with an empt y subs et; attri butes which result i n the greatest in crease in th e r ough s et dep endency val ue are ad ded iterativel y. This process cont inues u ntil the s earch produces its maximum possibl e dep endency value f or that dat aset ( γ c(D)). Note that thi s t y pe of s earch does not guarant ee a mini mal subset and may onl y di scover a local minimum . QUICKREDUCT( C, D) C, the set of all conditio nal features; D, th e set of decisio n features. (a) R ← {} (b) Do (c) T ← R (d) ∀ x ∈ (C-R) (e) if γ R ∪ {x} (D) > γ T (D) Where γ R(D)=card(P OSR(D)) / card(U ) (f) T ← R ∪ {x} (g) R ← T (h) until γ R(D) = = γ C(D) (i) return R It starts o ff with an empt y set and add s in turn, on e at a time, those attribut es t hat r esult in the greatest i ncrease i n the r ough s et d ependenc y metric, until this produces its maximu m possibl e value f or th e datas et. Other s uch techniques may be found in [8, 9] 3. Clustering Techniques Clusteri ng is the pro cess of group ing d ata i nto c luste rs, where objects within each clust er have high simil arity, bu t are dissimilar t o t he objects in other clusters. Similarities are assessed b ased on the attributes valu es that b est descri bes t he ob jects. Often distance measu res are used for the purpose. Clust ering has i ts roots in man y areas, includin g dat a mi ning, statistics, biology, and machine learning. In this work K -Means, FCM and BPN algorithms which are used to classif y the data. 3.1 K-Means Algori thm K-M eans al gorithm (MacQueen, 1967) is one of a group of algorith ms called p artitioning method s. The k-mean algorithm is ver y s imple and can be easil y i mplem ented in solvin g many practi cal problems. The k-mean s algorithm is the best-known squared error-based clustering algorithm [11]. Consid er the data set wit h ‘n’ objects , i.e., S = {x i : 1 ≤ i ≤ n}. 1) Initialize a k-par tition r andomly or b ased on some prior knowledge. i.e. {C 1 , C 2 , C 3 ,…….., C k }. 2) Calculate the cluster protot y pe mat rix M (distance matrix o f distances bet ween k-clusters an d data obj ects). M = {m 1 , m 2 , m 3, …. , m k } Where m i is a column matrix 1× n . 3) Assign each object in th e dat a set to t he n earest cluster - C m i.e. x j ∈ C m if || x j - C m || ≤ | | x j – C i || ∀ 1 ≤ j ≤ k , j ≠ m Where j =1, 2, 3, ……., n. 4) Calcul ate t he average of each clust er and cha nge t he k- cluster centers by thei r averages. 5) Again calculate t he cluster protot y pe m atrix M. 6) Repeat st eps 3, 4 and 5 u ntil t here i s no change for each cluster. The k-means algorithm i s the most e xtensivel y s tudied clusteri ng al gorithm and is generall y effecti ve i n producing good result s. The majo r drawb ack of this algorithm is that it p roduces different cluste rs for different sets of values o f t he i nitial centroids. Quality o f the fina l clusters heavily d epends on th e selection of th e initial cent roids [12]. 3.2 Fuzzy C Means Fuzzy clus tering al lows ea ch feature vect or to b elong to more t han one cluster with different membership d egrees (bet ween 0 and 1) and vague or fuzzy bou ndari es between clusters. Fuzzy c-mea ns (FCM) is a method of cl ustering which allows o ne pi ece of dat a to belong t o two or more clusters. This method ( develo ped by Dun n in 1973 and impro ved b y Bezd ek in 1981) is fr equentl y us ed in pattern recognitio n [15]. Algorit hm Steps: Step-1: Rando mly in itialize the membership matrix usin g this e quation, ∑ ( ) = 1 i = 1,2,… ..k (9) Step-2: Calculate th e Centroid using equ ation, = ∑ [ ( )] ∑ [ ( )] (10) Step-3: Calculat e d issimilarl y bet ween th e data points and Centroi d using the Euclidean distan ce. Step-4: Upda te the New membershi p m atrix u sing t he equatio n, ( ) = [ 1 ] ⁄ ∑ [ 1 ] ⁄ (11) Here m is a fuzzifi cation paramete r, The ra nge m is alwa y s {1.25, 2} Step-5: Go b ack to S tep 2, unless the centroids are not changin g. 4. Classification Techniques 4.1 Back Propagation Netw orks (BPN) BPN is an information-pro cessing paradi gm that i s inspired b y the way biolo gical nervous s ystems[13,14 ], such as t he brain, p rocess i nformati on. T h e k e y e l e m e n t o f this paradigm is the novel stru cture o f t h e i n f o r m a t i o n processi ng s ystem. It i s compos ed o f a l a r g e n u m b e r o f highly i nterconnec ted pro cessing e l e m e n t s ( n e u r o n s ) workin g in unison to solve specific prob l e m s . Fig 1: BPN Architectu re Developin g a neur al network in volves f i r s t t r a i n i n g t h e network to carry out the desired compu t a t i o n s forward neur al net work archi tecture is c o m m o n l y u s e d f o r super vised lear ning. Feed- forward n eura l n e t w o r k s c o n t a i n a set o f la yered nodes and weighted co n n e c t i o n nodes i n adj acent l ay ers. Feed - forward n e t w o r k s a r e o f t e n trained using a b ack p ropagation- learn i n g s c h e m e . B a c k propa gation learning works by makin g m o d i f i c a t i o n s i n weight values starting at t he ou tput l a y e r t h e n m o v i n g backward through t he hid den layers of th e n e t w o r k . N e u r a l networks have b een critici zed f o r t h e i r p o o r interpretabilit y, sin ce it i s dif ficult for h u m a n s t o i n t e r p r e t the symbolic meaning b ehind t he l e a r n e d w e i g h t s . Advantages of neural networks, howe v e r , i n c l u d e t h e i r high to ler ance to noisy data as t heir a b i l i t y t o c l a s s i f y patternson whic h they have not been trai n e d [ 1 3 5. Experimental Results 5.1 Data Sets We us e fou r datasets: l eukemia, b reast c a n c e r , l u n g c a n c e r and prostate cancer which are availab l e i n t h e w e b s i t e : http://d atam.i2r.a- star.edu.sg/ datasets/krb d / , [ 2 ] . t h e g e n e numbe r and class contai ned in fou r d a t a s e t s a r e l i s t e d i n Table 1. Table1: Su mmary of the four gene expres s i o n d a t a s e t s . Dataset # Gene Leukemia 7129 A L L / A M L Prostate Cancer 12600 Tu m o r / N o r m a l Breast Cancer 24481 Relap s e / N o n R e l a p s e Lung Cancer 7129 Tu m o r / N o r m a l s u c h a s t h e b r a i n , p r o c e s s i n f o r m a t i o n . The key element of t h i s p a r a d i g m i s t h e n o v e l s t r u c t u r e of the i nformation p r o c e s s i n g s y s t e m . I t i s c o m p o s e d o f a l arge number of h i g h l y i n t e r c o n n e c t e d p r o c e s s i n g e l ements (neuron s) w o r k i n g i n u n i s o n t o s o l v e s p e c i f i c p r o b l ems. a l n e t w o r k i n v o l v e s first training the d e s i r e d c o m p utations . The feed- f o r w a r d n e u r a l n e t w o r k a r c h i t e c t u r e i s commonly us ed for f o r w a r d n e u r al n etworks contain a s e t o f l a y e r e d n o d e s a n d w e i g h t e d c on nection s between f o r w a r d networks are often l e a r ning sc heme. Back p r o p a g a t i o n l e a r n i n g w o r k s b y m a k i n g modi fications in w e i g h t v a l u e s s t a r t i n g a t t h e o u t p u t l ayer the n m oving d e n l a y e r s o f t he network. Neural n e t w o r k s h a v e b e e n c r i t i c i z e d for t heir poor i n t e r p r e t a b i l i t y , s i n c e i t i s d i f f i c u l t f o r humans to inter pret t h e s y m b o l i c m e a n i n g b e h i n d t h e learn ed weights. A d v a n t a g e s o f n e u r a l n e t w o r k s , h o w ever, include th eir a n c e t o n o i s y d a t a a s t h e i r a bility to classify h t h e y h a v e n o t b e e n t r a ined [13 ,14]. W e u s e f o u r d a t a s e t s : l e u k e m i a , b r e a s t cancer, lun g cancer a n d p r o s t a t e c a n c e r w h i c h a r e a v a i l a ble in the website: s t a r . e d u . s g / d a t a s e t s / k r bd/, [ 2]. t he gene n u m b e r a n d c l a s s c o n t a i n e d i n f o u r d a tasets ar e list ed in g e n e e x p r e ssion datas ets. Class ALL/AML T umor/Normal R e l a pse/Non Relapse T umor/Normal The d ata studied b y rough se t s a r e m a i n l y o r g a n i z e d i n t h e form of decision tables . O n e d e c i s i o n t a b l e c a n b e repre sented as S = ( U, A = C U D sampl es, C the condition att r i b u t e s e t a n d attribut e s et. We c an represe n t e v e r y g e n e e x p r e s s i o n d a t a with th e decision table like T a b l e 2 . Table2. Microarray d a t a d e c i s i o n t a b l e . Sam ples Condition attrib u t e s ( g e n e s ) Gene 1 Gene 2 1 g( 1 ,1) g(1,2) 2 g(2,1) g(2,2) … … … m g(m,1) g (m,2) In t he decisio n ta ble, t here a r e Every s ampl e is assi gned to o n e c l a s s l a b e l . E a c h g e n e i s a conditio n attribute and eac h c l a s s i s a d e c i s i o n a t t r i b u t e . g(x, y) signifies the expressio n l e v e l o f g e n e [2]. 5.2 Data Pre- processing, G e n e S e l e c t i o n Before appl y i ng feat ure s e l e c t i o n a l g o r i t h m a l l t h e conditio nal a ttribut es (sampl e s ) a r e d i s c r e t i z e d Means discretizatio n [16]. Le t u s c o n s i d e r e d sampl es, C the condition att r i b u t e s e t a n d attribut e s et. By appl ying Q u i c k R e d u c t prost ate gene dat aset, gene # 2 0 a n d # 1 1 1 5 4 a r e i d e n t i f i e d , where as in leukemia data s e t g e n e # 4 a n d # 3 2 5 2 a r e identifi ed, in breast cance r da t a s e t g e n e # 3 a n d # 2 2 0 1 9 a r e identifi ed, f i nally in lung c a n c e r d a t a s e t g e n e # 4 8 1 7 a s best attrib ut e for finding appr o p r i a t e d e c i s i o n . Table 3: Features sel ected b y Q u i c k R e d u c t A l g o r i t h m Gene Data Leukemia Cancer Prostate Cancer Breast Cancer Lung Cancer 5.3 Classification Performa n c e In this section th e selected d a t a i s c l u s t e r e d b y t h e K Means and FCM al gorithm. T h e d a t a p r e s e n t e d i n T a b l e 4 and 5 sho ws th e cl assific a t i o n p e r f o r m a n c e o f T r u e Positive (TP) rate, Tr ue Nega t i v e ( T N ) r a t e , F a l s e P o s i t i v e (FP) rate, and False Negat i v e ( F N ) descri bed. Table 5 shows c l a s s i f i c a t i o n p e r f o r m a n c e o f Back P ropa gation Network. R e s u l t s a r e p r e s e n t e d b o t h i n T h e d a t a s t u d i e d b y r o u g h s e ts are mainly o rgani zed in th e f o r m o f d e c i s i o n t a b l e s . One decision t able can be C U D ), where U is the set of t h e c o n d i t i o n a t t ribute set and D the deci sion a t t r i b u t e s e t . W e c a n r e p r e s e nt every gene e xpressi on data w i t h t h e d e c i s i o n t a b l e l i k e T able 2. T a b l e 2 . M i c r o a r r a y data decision table. C o n d i t i o n a t t r i butes(genes) Decision attributes ... Gene n Class label … g(1,n) Class(1) … g(2,n) Class(2) … … … … g(m,n) Class(m) I n t h e d e c i s i o n t a b l e , t h e r e ar e m sa mples an d n genes. E v e r y s a m p l e i s a s s i g n e d t o one class l abel. Each gen e is a c o n d i t i o n a t t r i b u t e a n d e a c h c lass is a deci sion attrib ute. s i g n i f i e s t h e e x p r e s s i on l evel of gene y i n sa mple x . p r o c e s s i n g , Gene Selection u r e sel ection algorithm all t he c o n d i t i o n a l a t t r i b u t e s ( s a m p les) are discretized using K- L et us considered U i s the set of t h e c o n d i t i o n a t t ribute set and D the deci sion B y a p p l y i n g Qui ck Reduc t Algorithm , In p r o s t a t e g e n e d a t a s e t , g e n e #20 and # 11154 are id entified, w h e r e a s i n l e u k e m i a d a t a set gene #4 and # 3252 a re i d e n t i f i e d , i n b r e a s t c a n c e r d ataset gene #3 and #2201 9 are i d e n t i f i e d , f i n a l l y i n l u n g c ancer dataset gene #4817 as e f o r f i n d i n g a p p ropriate decisi on. T a b l e 3 : F e a t u r e s s e l e c t e d by Q u ick Reduct Alg orithm Identified Attributes (Genes) #4, #3252 #20, #11154 #3, #22019 #4817 C l a s s i f i c a t i o n P e r f o r m a nce I n t h i s s e c t i o n t h e s e l e c t e d data is clustered by the K - M e a n s a n d F C M a l g o r i t h m . The data pres ented i n Table 4 a n d 5 s h o w s t h e c l a s s i f i cation performan ce of True P o s i t i v e ( T P ) r a t e , T r u e N e g ative (TN) r ate, Fals e Positive ( F P ) r a t e , a n d F a l s e N e g a tive (FN) rate as previously d e s c r i b e d . T a b l e 5 s h o w s classif ication perform ance of B a c k P r o p a g a t i o n N e t w o r k . Resu lts are pres ented bot h in terms of classifi cation accuracy an d classi fication error [7]. Table 4 : K-Means Cl assification Performance R ate Table 5: FCMs Cl assification Performance Rat e When comp aring classifi cation results, wh ere the BPN method sh ows a high in classification accu racy, which is demonstr ated in Fig. 2. Tabl e 6: K-Means, FCM and BPN Classi fication Accuracy Gene Data K-Means FCM BPN Leukemia Cancer 0.9412 0.9412 1.0000 Prostate Cancer 0.7143 0.6190 0.8000 Breast Cancer 0.6315 0.6315 0.9167 Lung Cancer 0.9896 0.9896 1.0000 Fig 2: K-Means , FC M and BPN Classifi ca tion Accuracy Table 7: K- Mean s, FC M and BPN Classificatio n Error Gene Data K-Means FCM BPN Leukemia Cancer 0.0588 0.0588 0.0000 Prostate Cancer 0.2857 0.3809 0.2000 Breast Cancer 0.3684 0.3684 0.1667 Lung Cancer 0.0104 0.0104 0.0000 Fig 3: K-Means, FCM and BPN Cl assification Error Fi g 2 and 3 demonst rated th e classifi cation ac curacy and e rror rate of Quic k reduct algorithm . 6. Conclusion In thi s paper, Quick redu ct algorithm based on rough set th eory has been studied for gene expression datasets. The reduced feature set has been used to cluster the data usin g K-Means and FCM algorithms with considering decisio n attribut es. T he perform ance was evaluated u sin g confusi on matrix with positive and negat ive class values. Furt her, the s elected features with class l abels were classifi ed usi ng Bac k Pr opagation Netwo rk. It was obser ved that the perfo rmance of th e BPN is significa nt. References [1] Jense n, R. an d Sh en, Q. (2 003) ‘ Finding rough s et reducts with ant col ony optimization’, Proceedin gs UK Works hop on Com put ational Intelligence, pp. 15–22. [2] Xiao sh eng Wan g, Osa mu Gotoh, “Cancer Classification Using Single Genes”, pp 179-188. [3] Pawlak, Z. (2002 ) ‘Rough Sets and Intelligent D ata Analysis’, Information Sciences, Vol. 147, pp. 1–12 . [4] Chang jin g Shang and Qi angShen, ”Aidin g Classification of Gene Ex pression Data with F eature Selection: A Comparative Study”, International Journal of Computatonal Intelli gence Research. ISSN 09 73-1873 Vol.1, No.1 (2005), pp. 68–76 0 0.2 0.4 0.6 0.8 1 1.2 Accurac y Classifica tion Accuracy K-Means FCM BPN 0 0.05 0.1 0.15 0.2 0.25 0.3 0.35 0.4 Error Classification Error K-Means FCM BPN Gene Data K - Means TP FP TN FN Leukemia Cancer 1.0000 0.0000 0.1428 0.8571 Prostate Cancer 0.3750 0.6250 0.0769 0.9230 Breast Cancer 0.6667 0.3333 0.4286 0.5714 Lung Cancer 0 .9883 0 .0116 0.0000 1.0000 Gene Data FCM TP FP TN FN Leukemia Cancer 1.0000 0.0 000 0.1428 0.8 571 Prostate Cancer 0.1250 0.8 750 0.0769 0.9 230 Breast Cancer 0.6667 0.3 333 0.4285 0.5 714 Lung Cancer 0.9883 0.0 116 0.0000 1.0 000 [5] Liang G oh, Qun Song, and Nikola Kasabov,”A Novel Feature Selection M ethod to Improve Cl assification of Gene Expression Data”, Conferences in R esearch and Practice in Information Technology, Vol. 29 . [6] PradiptaMaji and Sankar K . Pal , “Fuzz y–rough sets for information measures and Selection of relevant genes from microarray d ata”, IEEE transactions on systems, man, and cybernetics—part b: cybernetics, vol. 40, no. 3, June 201 0 [7] C.Velayutham, K.Than gavel , “Unsup ervised Feature Selection Using Rou gh S et”. Pr oceeding on International Conference, Emerging Trends in Computing(ICETC- 2011), 17-18 Mar 2011 . [8] K.Thangavel, P. Jaganathan, A. P ethalakshmi, M.Karnan,“Effective Class ific ation with Improved Q uick Reduct For Medical D atabase Usin g Rough System”, BIME Journal, Volume (05), Issue (1), Dec., 2005. [9] K.Thangavel, A. Pethal akshmi, ” Feature Sel ection for Medical Database Using Rou gh Syste m”, AIML Journ al, Volume (6), Issue (1), January, 2006 [10] QiangShen, Alexios Chouchoulas, “A Rough Fuzzy Approach For Generating Classification Rules”,ww.e lsevier.com/locate/patcog, Pattern Recognition 35 (2002) 2425 – 2438 [11] Parvesh Kumar, Si riKrishanWasan,“Comparative Analysis of k-mean Based Algorithms”. IJCSNS International Journal of Computer Science an d N etwork Security, VOL.10 No.4, April 2010. [12] K. A . Abdu l N azeer, M. P. Sebastian, “I mproving th e Accuracy and Efficiency of the k-means Clustering Algorithm”. Proceedin gs of t he World C ongress on Engineering 200 9 Vol I WCE 20 09, Ju ly 1 - 3 , 200 9, London, U.K. [13] AshaGowdaKaregowda, A.S . Manjun ath, M.A. Jayaram ,” Application of Genetic Al gorithm Op timized Neural Network Connection Wei ghts f or Medical Diagnosis of Pima Indi ans Diabetes”. Int ernational Journal on Soft Computing ( IJSC ), Vol.2, No.2, May 2011. [14] Ping Chan g and J eng-Shong Shih ,” The Application of Back Pr opagation Neural Network of Multi- channel Piezoelectric Quartz Crystal S ensor for Mi xed Or ganic Vapours”.Tamkang Journal of S cience and Engineering, Vol. 5, No. 4, pp. 209-217 (2002). [15] Binu Thomas, R aju G., a nd S onamWangmo, “A Modifi ed Fuzzy C-Me ans Algorithm for Natural Data Exploration”. World Acad emy of Sci ence,Engineering and T echnology 49 2009. [16] SellappanPalaniappan, Tan Ki m Hong, “ Discretization of Continuous Valued Dimensions in OLAP Data Cubes”.IJCSNS International J ournal of Computer Sci ence and Network Security, VOL.8 No.11, Novemb er 2008.
Original Paper
Loading high-quality paper...
Comments & Academic Discussion
Loading comments...
Leave a Comment