Joint and individual variation explained (JIVE) for integrated analysis of multiple data types
Research in several fields now requires the analysis of data sets in which multiple high-dimensional types of data are available for a common set of objects. In particular, The Cancer Genome Atlas (TCGA) includes data from several diverse genomic tec…
Authors: Eric F. Lock, Katherine A. Hoadley, J. S. Marron
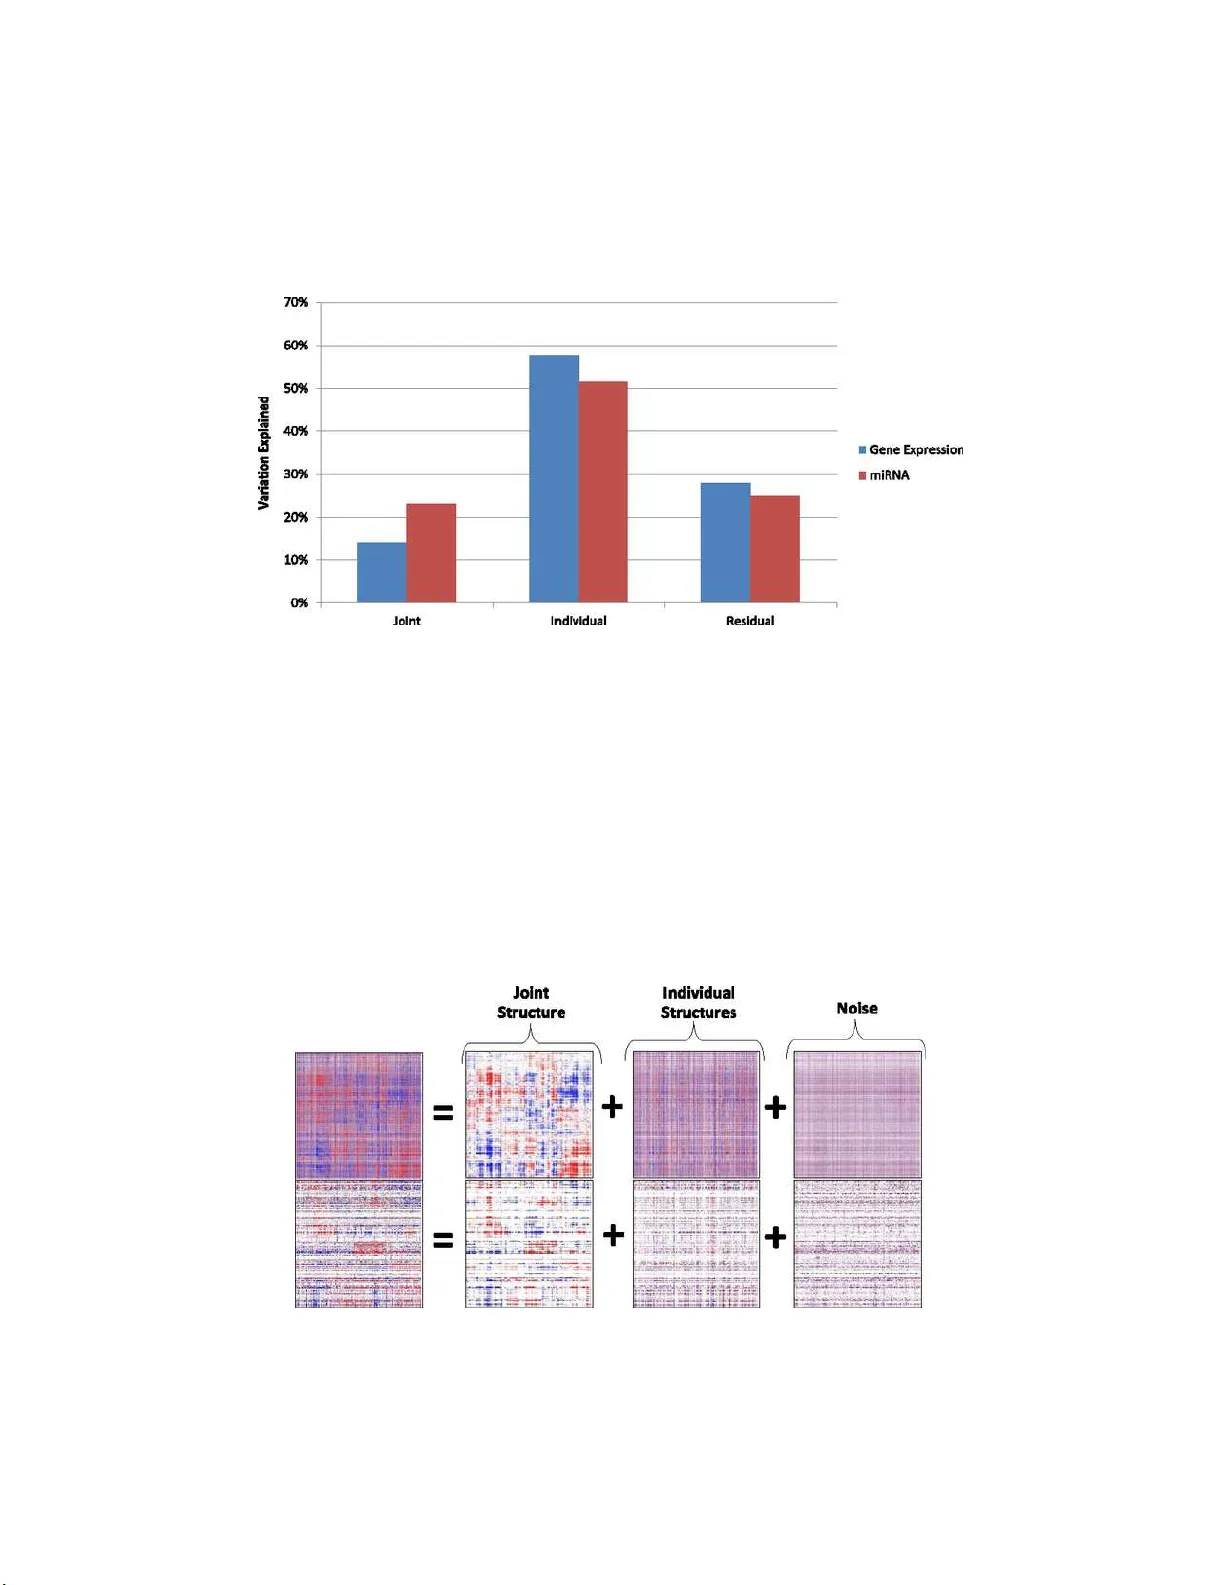
The Annals of Applie d Statistics 2013, V ol. 7, No. 1, 523–542 DOI: 10.1214 /12-A OAS597 c Institute of Mathematical Statistics , 2 013 JOINT AND INDIVIDUAL V ARIA TION EXPLAINED (JIVE) F OR INTEGRA TED ANAL Y SIS OF MUL TIPLE DA T A TYPES 1 By Eric F. Lock, Ka therine A. Ho ad ley, J. S. Marron and Andrew B. Nobel University of North Car olina at Chap el Hil l Researc h in sever al fields now requires the analysis of data sets in which multiple h igh- dimensional types of data are av aila ble for a common set of ob jects. In particular, The Cancer Genome Atlas (TCGA) includes data from severa l diverse g enomic technologi es on the same cancerous t u mor samples. In this pap er w e introduce Joint and In d ividual V ariation Explained (JIVE), a general decomp osition of v ariation for th e integrated analysis of such data sets. The decom- p osition consists of three terms: a low -rank approximation capturing join t v ariation across data typ es, low-rank approximations for struc- tured v ariation ind ividual to eac h data type, and residual n oise. JIVE quantifies th e amount of join t v ariation b etw een d ata typ es, reduces the dimensionalit y of th e data and provides new d irections for th e visual exploration of joint and indiv idual structures. The prop osed metho d represents an extension of Principal Component A nalysis and has clear adva ntages o ver p opular tw o-blo c k metho ds such as Canon- ical Correlation Analysis and P artial Least Squ ares. A JIVE analysis of gene ex p ression and miRN A data on Glioblastoma Multiforme t u - mor samples reveals gene–miRNA associations and provides b etter chara cterization of tumor typ es. Data and softw are are a v ailable at https://ge nome.unc. edu/jive/ . 1. In tro d uction. Man y fields o f scien tific researc h no w analyze high- dimensional data, in whic h a large n um b er of v ariables are measured for a give n set of exp erimen tal ob jects. Increasingly , those d ata include m u lti- ple high-dimensional data sets for a common s et of ob jects. T able 1 giv es v ery diverse examples of such data ob jects. In this cont ext we refer to eac h data set as a data typ e to indicate that it comes fr om a distinct mo de of measuremen t or domain. Received Novem b er 2011; revised Septemb er 2012. 1 Supp orted in part by NI H Grant R01 MH090936-01, NSF Grant DMS-09-07177, N SF Gran t DMS - 08-54908 and NIH Grant U24-CA143848. Key wor ds and phr ases. Data integration, multi-block data, principal comp onent anal- ysis, d ata fusion. This is an electronic re pr int of the o riginal article published by the Institute of Mathematical Statistics in The Annals of Applie d S tatistics , 2013, V ol. 7, No. 1, 523– 542 . This reprint differs fro m the or iginal in pag ination and typogra phic detail. 1 2 LOCK, HOADLEY, MARRON AND NOBEL T able 1 Examples with m ultiple high-dimensional data typ es Field Ob ject Data types Computational b iology Tissue samples Gene expression, microRNA , genotyp e, protein abundance/activity Chemometrics Chemicals Mass sp ectra, NMR sp ectra, atomic comp osi- tion Atmospheric sciences Locations T emp erature, humidit y , particle concentrations o ver time Internet traffic W ebsites W ord frequencies, v isitor demographics, linked pages The motiv atio n for this article is a particular application to biological data. In biomedical studies, a num b er of tec hnologies n o w commonly collect div ers e information on an organism or tissu e sample. The amount of a v ail- able b iologi cal data from m ultiple p latforms and tec hnologies is expanding rapidly . Th e 2011 Onlin e Database collect ion of Nuc leic A cids R ese ar c h lists 1330 p ublicly a v ailable databases that measure v arious asp ect s of molecu- lar and cell biology [ Galb erin and Co chrane ( 2011 )]. Large online d atabases suc h as Arra yExpress [ P arkinson et al. ( 2009 )] a nd the UCSC Genome- bro w ser [ Rh ead et al. ( 2010 )] often conta in multiple d ata types co llected from a common set of samples. Large-scale pro jects lik e The Hu man Connec- tome Pro ject [ Sp orns, T ononi and K¨ otter ( 2005 )] an d Th e Cancer Genome A tlas [ C ancer Genome A tlas Researc h Net work ( 2008 )] fo cus on the inte- grated analysis of multiple data t yp es. W ell-established m u ltiv ariate metho d s can b e used to separately analyze differen t data t yp es measured on the same set of ob jects. Ho w ev er, individ - ual analyses will not capture the cr itical asso ciations and p ote n tial causal relationships b et w een data types. F urth ermore, eac h data t yp e can impart unique and useful inf ormation. Th ere is a strong need for n ew s tatistica l metho ds that explore asso ciations b et w een multiple data types and com- bine data from multiple sources when m aking inference ab out the ob jects. This motiv ates an in teresting new area of statistical researc h. 1.1. Data . W e d escrib e an application to data fr om TCGA, an ongoing collaborative effort fu nded by the National Cancer In stitute (NCI) and the National Hum an Genome Researc h Institute (NHGRI). A goal of TCGA is to c h aracterize cancer on a molecular level th r ough the analysis and in- tegration of multidimensional large scale genomic data. The inte gration of information from disparate genomic sources h as the promise to p ro vid e a more comprehen s iv e understand ing of cancer genetics and cell biology . W e fo cus, in particular, on a set of 234 Glioblastoma Multiforme (GBM) tumor samp les. GBM is a common and v ery fatal form of malignant brain JOINT A ND INDIV IDUAL V AR IA TION EXPLA INED 3 tumor. Ho wev er, GBM cases are not homogeneous, and an u nderstanding of systematic distinctions b etw een the tumor samples may lead to more tar- geted therapies. V erhaak et al. ( 2010 ) classified the T CGA GBM s amp les in to four su bt yp es: Neur al, Mesenc hymal, Proneur al and Classical. These subtypes h a ve distinct expr ession c haracteristics, copy num b er alterations and gene m u tations. In addition, there w ere clinical d ifferences across sub- t yp es in resp onse to aggressiv e therapy . Cop y num b er ab errations and somatic mutations, and their relation to gene exp ression, ha v e b een r ecognized as imp ortant asp ects of GBM biology [see, e.g., Bredel et al. ( 2009 ) and Cancer Genome A tlas Researc h Net work ( 2008 )]. Ho wev er, the role of microRNA (miRNA) d ata in GBM biology has not b een w ell studied. In this article we fo cus on the in tegrated analysis of miRNA and gene expr ession data. These data are tw o distinct data t yp es, as they are measured on different platforms and represent differen t b iologic al comp onen ts. Current b iological ideas suggest that miRNAs function primarily as p ost- transcriptional regulators of gene expression. Typically , they are consid- ered negativ e regulators, d ecreasing gene expr ession lev els. Many of the al- gorithms that predict miRNA targets ( T a r getSc an , miR anda , Pictar , an d RNA22 ) ha ve v astly differen t p redicted gene lists [ P eter ( 2010 )]. Therefore, miRNA and gene exp ression relations are not we ll un dersto o d. Ho we v er, recen t researc h suggests that miRNAs may b e p artly resp onsible for the ex- pression of we ll-kno wn tu mor activ at ing genes (oncogenes) and tum or sup- pressing genes. In v estigating eac h d ata t y p e ind ividually w ould lose some imp ortan t re- lations, considerin g the inheren t interac tions b et ween miRNAs and gene expression. An int egrativ e, m ultiv ariate approac h is desired. The data de- comp osition prop osed in S ection 1.2 giv es new insigh t in to the joint and in- dividual v ariation b et we en the miRNA and gene expr ession d ata. Although this decomp osition is unsup ervised with resp ect to the ab o ve GBM sub - t yp es, w e further inv estigate ho w it leads to a b ette r c haracterizati on of these sub t yp es. F or ea c h tumor sample, th er e are measures of intensit y for 534 miR- NAs and 23,293 genes (messenger RNA). Th ese data are publicly a v ailable from TCGA. The pr epro cessed data used for th is an alysis are a v ailable at https:// genome.un c.edu/jive . 1.2. Pr op ose d metho d. Giv en the biological rela tion b et w een gene ex- pression and miRNA, it is reasonable to exp ect sh ared patterns in the t wo sets of measurements. W e refer to such shared p atterns as joint structur e . W e also exp ect the gene expression data to h a ve systematic v ariation th at is un related to the miRNAs and vice versa. This individual structur e can b e the result of tec hn ical artifacts, b ut ma y also b e of biological in terest. 4 LOCK, HOADLEY, MARRON AND NOBEL F or example, miRNA regulation is ju st one of many factors th at can influ - ence gene expression. This structur ed individu al v ariation can in terfere with finding th e imp ortan t joint signal, ju st as joint structure can obscure the imp ortant signal that is ind ividual to a data t yp e. T o separate joint and individu al effects, w e in tro duce a m etho d called Join t and In dividual V ariation Explained (JIVE). This exploratory metho d decomp oses a d ata set into a sum of thr ee terms: a lo w -r ank appro ximation capturing join t structure b et w een d ata t yp es, low-rank appr o ximations cap- turing structur e in dividual to eac h data type and residual noise. Analysis of individual structur e provi des a wa y to identify p oten tially usefu l in f ormation that exists in one data type, b ut not others. Accoun ting for individu al struc- ture also allo w s for more accurate estimation of what is common b etw een data t yp es. As illustrated in Section 4.2 , JIVE can iden tify join t structure not found by existing metho d s. It ma y b e used regardless of whether the dimension of a d ata set exceeds the sample size. F u rthermore, JIVE is appli- cable to data s ets with more than t wo data t yp es an d has a simple algebraic in terp retation. A heatmap of joint structure and individu al structure in th e GBM data, iden tifi ed by J IVE, is shown in Figure 1 . Column s (corresp onding to the 234 samples) are sho w n in the same ord er for b oth gene and miRNA d ata in the displa y of j oin t structure. T h is common ordering sh o ws complex stru cture in b oth data t yp es, and s h ared patterns are p resen t in su bsets of g enes and miRNAs. JIVE also identifies a large amount of structur ed v ariation individual to the gene expression d ata and a lesser degree of individual structure in the m iRNA data. While the individual s tructure accoun ts for more v ariabilit y in the d ata than the join t stru cture, our analysis suggests that the join t structure is more relev an t to the cancer biology . 2. Mo del and estimation. 2.1. F ormal fr amework. F ormally , w e fo cus on data for multiple matrices X 1 , X 2 , . . . , X k with k ≥ 2. Eac h matrix has n columns, corresp ond ing to a common set of n ob jects. The i th matrix X i has p i ro ws, eac h corresp ondin g to a v ariable in a giv en measurement tec hnology th at v aries f rom matrix to matrix. F or example, in our app licatio n to GBM d ata the ro ws of X 1 con tain gene expression measurements (of dimension p 1 = 23,293) and the ro ws of X 2 con tain miRNA measurements (of d imension p 2 = 534) for th e same set of 234 tissu e s amples ( n = 234). Th e k matrices ma y b e com bin ed in to a single data matrix X = X 1 . . . X k : p × n, where p = p 1 + p 2 + · · · + p k . JOINT A ND INDIV IDUAL V AR IA TION EXPLA INED 5 Fig. 1. JIVE estimates f or joint structur e and i ndividual structur e in the GBM data. Blue c orr esp onds to ne gative values, r e d p ositive values. Columns ar e given in the same or der in the j oint structur e, and subsets of genes and miRN A s that shar e simil ar p atterns ar e hi ghlighte d in gr e en and yel low . Direct analysis of X can be problematic as the s ize and scale of the constituen t d ata t yp es often differ. T o remo ve b aseline differences b et ween data t yp es, it is helpful to ro w-cente r th e data by subtracting the mean within eac h ro w. Data t yp es may also b e of d ifferen t dimen sion ( p i ) or d iffer in v ariabilit y . T o circumv en t cases w here “the largest data set wins,” it is helpful to scale eac h d ata t yp e by its total v ariation, or sum -of-squ ares. In particular, for eac h i defin e X scaled i = X i k X i k , where k · k defin es the F r ob enius norm k A k 2 = P i,j a 2 ij . Th en , k X scaled i k = 1 for eac h i , and eac h data t yp e con tribu tes equally to the total v ariation of the concatenate d matrix X scaled = X scaled 1 . . . X scaled k . (2.1) 2.2. Mo del. Let X 1 , X 2 , . . . , X k b e matrices as in Section 2.1 , scaled ap- propriately . Joint structure is represented b y a single p × n matrix of rank r < rank( X ) . In d ividual stru cture for eac h X i is represen ted by a p i × n matrix of rank r i < rank( X i ). More formally , let A i b e the matrix r ep resen ting the individual structure of X i , and let J i b e the s u bmatrix of the joint structure matrix th at is asso ciated with X i . Th en , the unified JIVE mo del is X 1 = J 1 + A 1 + ε 1 , 6 LOCK, HOADLEY, MARRON AND NOBEL . . . (2.2) X k = J k + A k + ε k , where ε i are p i × n error matrices of indep enden t entries with E ( ε i ) = 0 p i × n . Let J = J 1 . . . J k denote the join t structur e matrix. The mo del imp oses the rank constr aints rank( J ) = r and r an k ( A i ) = r i for i = 1 , . . . , k . F ur thermore, we require that the ro ws of joint and individual structures are orthogonal: J A T i = 0 p × p i for i = 1 , . . . , k . Intuitiv ely , this means that sample patterns resp on s ible for join t structure b etw een d ata typ es are un related to sample patterns resp onsible for ind ividual structure. This r equiremen t do es not constrain the m o del, in that any matrix in the form ( 2.2 ) can b e written equiv alen tly with orthogo- nalit y b et w een joint and individ ual structures. F ur thermore, th e orthogonal- it y constraint assures that the join t and in dividual comp onents in ( 2.2 ) are uniquely determined (see the supplementary material [Lo c k et al. ( 2012 )] for more details). It is remark able that no fur ther orthogonalit y constraints (sa y , b et ween the column space of J i and the column space of A i , or b e- t wee n th e row spaces of eac h A i ) are required to m ak e the decomp osition iden tifi ab le. 2.3. Estima tion. Here we discuss estimation of the mo del for fi xed ranks r , r 1 , . . . , r k . The c hoice of these ranks is imp ortant to accurately qu an tify the amoun t of join t and ind ividual s tr uctures. The supp lementary material [Lo c k et al. ( 2012 )] describ es a p ermutati on testing app roac h to rank selectio n. Join t and ind ivid ual s tr uctures are estimated by minimizing the sum of squared err or. Let R b e the p × n matrix of residuals after accoun ting for join t and ind ividual structures: R = R 1 . . . R k = X 1 − J 1 − A 1 . . . X k − J k − A k . W e estimate the m atrices J and A 1 , . . . , A k b y minimizing k R k 2 under the giv en rank s . This is accomplished by iterativ ely estimating joint and ind i- vidual str u ctures: • Given J , find A 1 , . . . , A k to min imize k R k . • Given A 1 , . . . , A k , fin d J to minimize k R k . • R ep eat un til con vergence. JOINT A ND INDIV IDUAL V AR IA TION EXPLA INED 7 Fig. 2. X and Y ar e gener ate d by adding to gether joint structur e, individual structur e and noise. Blue c orr esp onds to ne gative values, r e d p ositive values. The joint structure J minimizing k R k is equ al to the first r terms in the singular v alue decomp osition (SVD) of X with individu al structure r emo ve d. The estimated individu al structure f or X i is equal to the first r i terms of the SVD of X i with the join t structure r emo ve d. The estimate of ind ividual structure for X i will n ot c hange those for X j , j 6 = i an d , hence, the k in d ivid- ual appr oximati ons minimize k R k for fixed joint structure. Pseud o co de for this iterativ e algorithm is giv en in th e supp lemen tary material [Lo c k et al. ( 2012 )]. Compu ting time can b e impro v ed by reducing the dimen sionalit y of X 1 , . . . , X k at the outset via their SVD (see the supplementary m aterial [Lo c k et al. ( 2012 )]). The iterativ e metho d is monotone in th e sense that k R k decreases at eac h step. Thus, k R k con verges to a coord inate-wise min imum, whic h can n ot b e impro v ed by c hanging the estimated join t or in d ividual, stru cture. F urther con verge n ce prop erties of th e algorithm are currently under study . 2.4. Il lustr ative example. As a b asic illustration we generate t wo matri- ces, X and Y , with simple patterns corresp ond ing to join t and in dividual structures. The simulat ed data are depicted in Figure 2 . Both X and Y are of dimension 50 × 100, that is, eac h h as 50 v ariables measured for the same 100 ob jects. A common pattern V of 100 ind ep endent stand ard nor- mal v ariables is added to h alf of the rows in X and h alf of the ro ws in Y . This represents the j oint structure b etw een the tw o data sets. Str ucture in- dividual to X is generated by partitioning the ob jects in to five group s , eac h of size tw en ty . Those columns corresp ond in g to group 1, 2, 3, 4 or 5 ha ve − 2, − 1, 0, 1, 2 added to eac h ro w of X , resp ectiv ely . Stru cture in dividual to Y is generated s imilarly , b ut the groups are randomly determined and are therefore indep enden t of the groups in X . Finally , indep enden t N (0 , 1) noise is added to b oth X and Y . Note that the imp ortant joint stru cture is visually obscur ed. 8 LOCK, HOADLEY, MARRON AND NOBEL Fig. 3. JIVE estimates for joint structur e and indi vidual structur e. Blue c orr esp onds to ne gative values, r e d p ositive values. The common pattern V repr esen ts an und erlying phenomenon that con- tributes to sev eral v ariables in b oth X and Y . P racticall y , the individ u al structure in X (or Y ) ma y corresp ond to an exp erimen tal grouping of th e measured v ariables in X ( Y ) not present in Y ( X ), for example, b atch ef- fects in microarra y data. Our goal is to iden tify b oth the common und erlying phenomenon and in d ividual group effects. Figure 3 sho ws the JIVE estimate for joint stru cture, JIVE estimate s for individual structure and the fit giv en by the su m of join t and individ ual structures. Estimates closely r esem ble the true signal in Figure 2 . 2.5. GBM data. As the gene expression and miRNA data for the GBM samples differ in dimen s ion and v ariabilit y , th ey w ere scaled as in S ection 2.1 . P ermutation testing (see the sup plemen tary m aterial [Lo c k et al. ( 2012 )]) w as used to determine the ranks of estimated j oin t and individual structur es. The test (usin g α = 0 . 01, and 1000 p erm utations) identified: • r ank 5 joint structure • r ank 33 stru ctur e individual to gene expression • r ank 13 stru ctur e individual to miRNA. The p ercen tage of v ariation (sum of squares) exp lained in eac h data s et by join t structure, in d ividual structure and residual n oise is sh o wn in Figure 4 . This illustrates ho w the JIVE d ecomp osition can b e used to quantify and compare the amount of s h ared and individual v ariation b et w een data t yp es. As sho w n in Figure 4 , join t str ucture is r esp onsible for more v ariation in miRNA than in gene exp ression (23% and 14%, resp.), and the gene exp r es- sion data has a considerable amoun t of structur ed v ariation (58%) that is un- related to miRNA. This is consistent with curr en t b iological understandin g, as miRNAs are just one of sev eral factors that can infl uence gene exp ression. Heatmaps of the lo w-rank estimates for join t str ucture, ind ividual struc- ture and residual noise are sho w n in Figure 5 . C olumns ha ve th e s ame ord er JOINT A ND INDIV IDUAL V AR IA TION EXPLA INED 9 Fig. 4. Per c entage of variation (sum of squar es) explaine d by estimate d joint structur e, individual structur e and r esidual noise for mi RNA and gene expr ession data. in all heatmaps. This reve als the shared patterns p resen t in the join t struc- ture from Figure 1 , bu t little of the structure that is present in the ind ividual estimates. 3. Mo del factorization. 3.1. R elation to PCA. The JIVE mo d el can b e factorized as in Princip al Comp o nent Analysis (PCA). F or a ro w-cent ered p × n matrix X , th e fi rst r Fig. 5. He atmaps of low-r ank estimates for joint structur e, individual structur e and r esid- ual noi se in the gene expr ession (top) and m iRNA (b ottom) data. Blue c orr esp onds to ne gative values, r e d p ositive values. C ol umns have the same or der in al l he atmaps. 10 LOCK, HOADLEY, MARRON AND NOBEL principal comp onents yield the r ank r approxi mation X ≈ U S, where S ( r × n ) con tains the s ample scores and U ( p × r ) con tains the v ariable loadings for the first r comp onen ts. As in PCA, the rank r joint structur e matrix J in th e JIVE mo del can b e written as U S , wh ere U is a p × r loading matrix and S is an r × n score matrix. Let U = U 1 . . . U k , where U i giv es the loadings of the join t structure corresp onding to the ro ws of X i . The r ank r i individual structure matrix A i for X i can b e written as W i S i , where W i is a p i × r i loading matrix and S i is an r i × n score matrix. Then, the lo w-rank decomp osition of X i in to joint and in d ividual s tr uctures is giv en by X i ≈ U i S + W i S i . Th is giv es the factorized mo del X 1 = U 1 S + W 1 S 1 + R 1 , . . . (3.1) X k = U k S + W k S k + R k . Join t stru cture is represented b y the common score matrix S . These scores summarize patterns in the samples that exp lain v ariabilit y across multi- ple data typ es. T he loading m atrices U i indicate h o w these joint scores are expressed in the ro ws (v ariables) of d ata t yp e i . The s core matrices S i sum- marize s amp le patterns individu al to d ata type i , with v ariable loadings W i . 3.2. GBM data. S ample scores for joint structur e, matrix S in equa- tion ( 3.1 ), rev eal sample patterns that are present across the miRNA and gene expr ession data. S ample scores for in dividual structure, matrices S 1 and S 2 in equation ( 3.1 ), rev eal sample patterns th at are ind ividual to eac h data t yp e. Figure 6 sho ws separate scatterplots of the sample scores for th e first tw o pr incipal comp onents of estimated join t structur e, the first t wo comp onen ts ind ividual to miRNA, and the fir s t t wo comp onents individual to gene expression. Subtype distinctions are clearly p resen t in the scatter- plot of join t scores, but a subt yp e effect is not visually apparent in either of the ind ividual scatterplots. Since the subt yp es are defined by gene expression clustering, their ap- p earance in Figure 6 is not surp rising. How ev er, the clustering app aren t in the joint plot s h o ws in volv emen t of miRNA in the differentiat ion of these subtypes. It is interesting that a sub t yp e effect is not app aren t in either JOINT A ND INDIV IDUAL V AR IA TION EXPLA INED 11 Fig. 6. Sc atterplots of sample sc or es for the first two joint c omp onents, first two indi- vidual mi RNA c omp onents and first two individual gene expr ession c omp onents. Samples ar e c olor e d by subtyp e: Mesenchymal ( yel low ), Pr oneur al ( blue ), Neur al ( gr e en ) and Cl as- sic al ( r e d ). Samples c olor e d black wer e assaye d af ter the i nitial subtyp e analysis and ar e c onsider e d unclassifie d. scatterplot for in dividual structure, suggesting th at this v ariation is drive n b y other biological comp onents. Th is is remark able, as th e fr action of gene expression v ariation exp lained by join t s tructure (see Figure 4 ) is s mall. T o n u merically compare the exte n t to w hic h su bt yp e distinctions are present , we consider the standard ized within-subtyp e s u m of squares SWISS( A ) = P i P j ( A ij − ¯ A i,s ( j ) ) 2 P i P j ( A ij − ¯ A i · ) 2 , where s ( j ) = { k : samples j and k b elong to the same subtype } . This repre- sen ts the v ariabilit y w ithin subtypes (across all ro w s) as a p rop ortion of total v ariabilit y . T a ble 2 giv es SWISS scores for the gene exp ression and miRNA data, an d SWISS scores for the JI VE estimates of join t and individual struc- tures. A p ermutati on test describ ed in Cabanski et al. ( 2010 ) concludes that the four su bt yp es are significan tly m ore distinguished on the estimated join t structure th an on the gene expression and miRNA d ata ( p < 0 . 001; 10,000 p ermutati ons). SWISS scores for ind ividual structur e in gene expression and miRNA are close to one, as s u bt yp e d istinctions are almost ent irely repre- sen ted in the joint stru cture b et w een the t wo data t yp es. This suggests that miRNA may pla y a greater role in GBM biology than previously thought. T able 2 SWISS sc or es for TCGA subtyp es. L ower sc or es indi c ate mor e subtyp e distinction Data Gene exp ression 0.8431 miRNA 0.8763 JIVE Join t 0.7678 Gene expression individual 0.9019 miRNA individual 0.9284 12 LOCK, HOADLEY, MARRON AND NOBEL In general, these analyses illustrate how an unsup ervised, in tegrated anal- ysis across multiple d ata typ es can result in a b etter distinction b et w een subtypes or other biological classes. One could condu ct a similar analysis to in vestig ate how the JIVE comp onen ts relate to s urviv al or other clinical fac- tors, rather th an s ubt yp e. F urthermore, a direct cluster an alysis on the J IVE comp onen ts could b e used to iden tify s ample groups that are distinguished across multiple data t yp es. 4. Comparison with existing metho ds. 4.1. Existing metho ds. One approac h to the analysis of m u ltiple data sets is to mine the data for v ariable-b y-v ariable asso ciations. In computa- tional b iology , large-scale correlation stud ies can id en tify millions of pairwise v ariable asso cia tions b et w een genomic data types [see, e.g., Gilad, Rifkin and Pritc hard ( 2008 )]. F urthermore, net w ork mo dels can link asso ciated v ariables across and within data t yp es [see Adourian et al. ( 2008 )]. How- ev er, analysis of v ariable-by- v ariable asso ciations alone do es n ot identify the global mo des of v ariation that drive asso ciations ac ross and w ithin data t yp es, whic h is the fo cus of this pap er . PCA of the blo ck- scaled matrix X scaled in ( 2.1 ) coincides w ith Consensus PCA [W old, Kettaneh and Tj essem ( 1996 ), W esterhuis, Kour ti and MacGre- gor ( 1998 )]. This direct ap p roac h is also used by the iCluster metho d [S hen, Olshen and Ladanyi ( 2009 )], which p erforms clustering based on a factor analysis of the concatenated m atrix X . While these metho ds s yn th esize in- formation from multiple d ata t yp es, they do n ot distinguish b et w een join t or ind ividual effects. Canonic al Corr e lation Analysis (CCA) [ Hotelling ( 1936 )] is a p opu lar metho d to globally examine the relation b et w een tw o sets of v ariables. If X 1 and X 2 are t wo data sets on a common set of samples, the first pair of canonical loadings (v ariable weigh ts) u 1 and u 2 are unit vect ors maximizing Corr( u T 1 X 1 , u T 2 X 2 ). Geometrical ly , u 1 and u 2 can b e in terpreted as the p air of d ir ections that m aximize the correlation b et w een X 1 and X 2 . Sample pro jections on th e canonical loadings, u T 1 X 1 and u T 2 X 2 , give the canonical sc or es for X 1 and X 2 . S ubsequent C CA directions can b e found by enforcing orthogonalit y with pr evious d irections. F or d ata s ets with p 1 > n or p 2 > n the CCA directions are not w ell defined, and o verfitting is often a problem ev en when p 1 , p 2 < n . Hence, standard CC A is t yp ically not applicable to high-dimensional d ata. Partial L e ast Squar es (PLS) [ W old ( 1985 )] directions are defined similarly to CCA, bu t maximize co v ariance rather than correlation. PLS is appr opri- ate for high-dimensional data. Ho wev er, T rygg and W old ( 2003 ) examine ho w stru ctured v ariation in X 1 not associated with X 2 (and vice v ersa) can JOINT A ND INDIV IDUAL V AR IA TION EXPLA INED 13 drastically alter PLS scores, making the interpretation of suc h scores prob- lematic. T heir solution, called O2-PLS, seeks to r emo ve stru ctured v ariation in X 1 not linearly related to X 2 (and vice ve rsa) from the P LS comp onen ts. As su c h, O2-PLS comp onen ts are often more representa tiv e of the true joint structure b et w een tw o data t yp es. Ho w ever, the restriction of O2-PLS (and PLS) to p airwise comparisons limits their utilt y in finding common s tructure among more than t wo data typ es. Witten and Tibsh irani ( 2009 ) recently introd uced Multiple Canonic al Corr elat ion Analysis (mC C A) to explore asso ciations and common str ucture on t wo or more d ata sets. F or X 1 , X 2 , . . . , X k as in S ection 2.1 , standardized so that eac h ro w has mean 0 and standard deviation 1, the s tand ard mCCA loading vect ors u 1 , u 2 , . . . , u k satisfy arg max k u 1 k = ··· = k u k k =1 X i
Original Paper
Loading high-quality paper...
Comments & Academic Discussion
Loading comments...
Leave a Comment