Testing Hypotheses by Regularized Maximum Mean Discrepancy
Do two data samples come from different distributions? Recent studies of this fundamental problem focused on embedding probability distributions into sufficiently rich characteristic Reproducing Kernel Hilbert Spaces (RKHSs), to compare distributions…
Authors: Somayeh Danafar, Paola M.V. Rancoita, Tobias Glasmachers
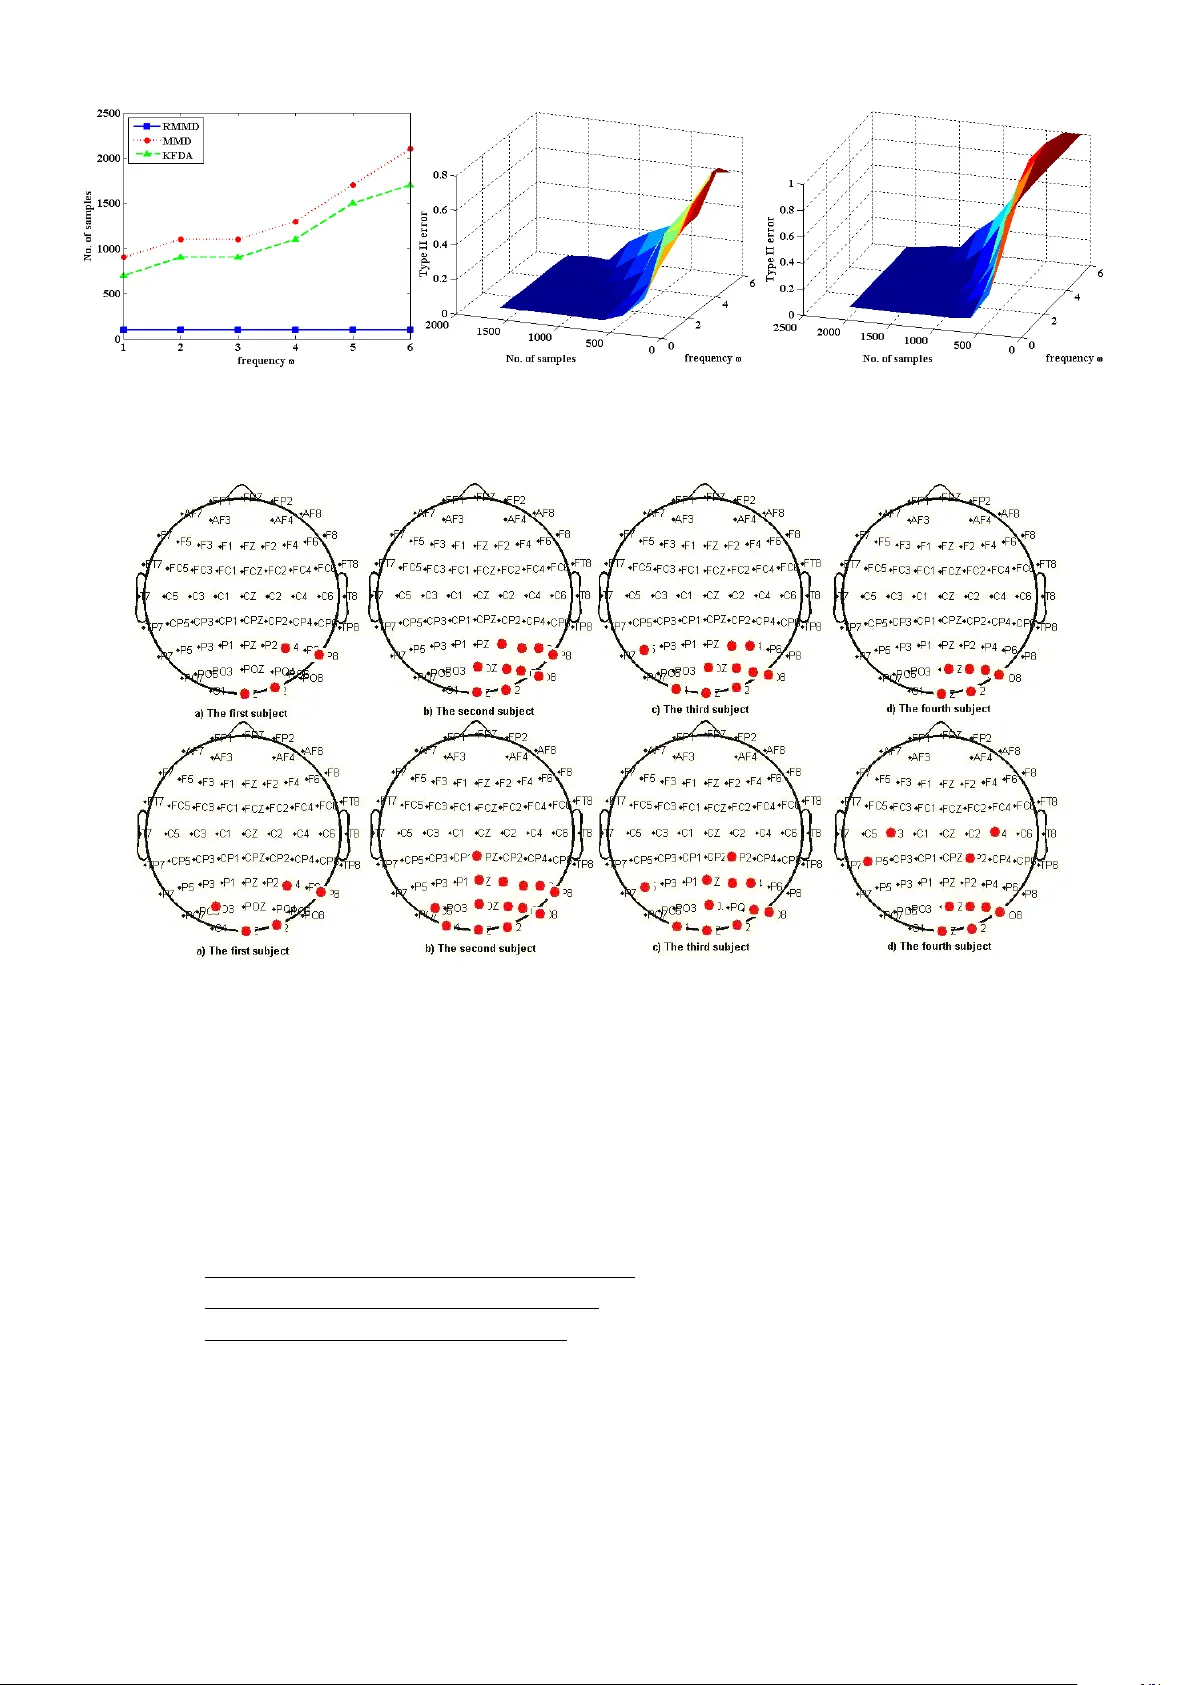
1 T esting Hypotheses by Re gularized Maximum Mean Discrepanc y Somayeh Danafar ∗ † , P aola M.V . Rancoita ∗ ‡ , T obias Glasmachers § K evin Whittingstall ¶ k , J ¨ urgen Schmidhuber ∗ † ∗ IDSIA/SUPSI, Manno-Lug ano, Switzerland † Uni versit ` a della Svizzera Italiana, Lugano, Switzerland ‡ CUSSB, V ita-Salute San Raf faele Uni versity , Milan, Italy § Institut f ¨ ur Neuroinformatik, Ruhr -Uni versit ¨ at Bochum, Germany ¶ Dept. of Diagnostic Radiology , Univ ersit ´ e de Sherbrooke, QC, Canada k Sherbrooke Molecular Imaging Center , Uni versit ´ e de Sherbrooke, QC, Canada Abstract Do two data samples come from different distributions? Recent studies of this fundamental problem focused on embedding probability distrib utions into suf ficiently rich characteristic Reproducing Kernel Hilbert Spaces (RKHSs), to compare distributions by the distance between their embeddings. W e show that Re gularized Maximum Mean Discrepancy (RMMD), our novel measure for kernel-based hypothesis testing, yields substantial improvements ev en when sample sizes are small, and excels at hypothesis tests in volving multiple comparisons with power control. W e deriv e asymptotic distributions under the null and alternati ve hypotheses, and assess po wer control. Outstanding results are obtained on: challenging EEG data, MNIST , the Berkle y Covertype, and the Flare-Solar dataset. I . I N T RO D U C T I O N Homogeneity testing is an important problem in statistics and machine learning. It tests whether two samples are dra wn from dif ferent distributions. This is rele vant for many applications, for instance, schema matching in databases [9], and speaker identification [13]. Popular two-sample tests like K olmogorov- Smirnov [2] and Cramer-v on-Mises [17] are not capable of capturing statistical information of densities with high frequency features. Non-parametric kernel-based statistical tests such as Maximum Mean Dis- crepancy (MMD) [9], [10] enable one to obtain greater power than such density based methods. MMD is applicable not only to Euclidean spaces R n , but also to groups and semigroups [8], and to structures such as strings or graphs in bioinformatics, and robotics problems, etc. [1]. Here we consider a regularized version of MMD to address hypothesis testing. W ith more than two distributions to be compared simultaneously , we face the multiple comparisons setting, for which statistical methods exist to deal with the issue of multiple test correction [23]. Giv en a prescribed global significance threshold α (type I error) for the set of all comparisons, ho we ver , the corresponding threshold per comparison becomes small, which greatly reduces the po wer of the test. In situations where one wants to retain the null hypothesis, tests with small α are not conserv ati ve. Our main contribution is the definition of a regularized MMD (RMMD) method. The regularization term in RMMD allo ws to control the power of the test statistic. The regularizer is set prov ably optimal for maximal po wer; there is no need for fine-tuning by the user . RMMD improves on MMD through higher power , especially for small sample sizes, while preserving the advantages of MMD. Power control enables us to look for true sets of null distributions among the significant ones in challenging multiple comparison tasks. 2 W e pro vide e xperimental e vidence of good performance on a challenging Electroencephalography (EEG) dataset, artificially generated periodic and Gaussian data, and the MNIST and Covertype datasets. W e also assess power control with the Asymptotic Relativ e Efficienc y (ARE) test. The paper is or ganized as follo ws. In section 2, we elaborate on hypothesis testing and define maximum mean discrepancy (MMD) as a metric. W e describe how to use MMD for homogeneity testing, and how to extend it to multiple comparisons. In section 3, we define RMMD for hypothesis testing and compare it to MMD and Kernel Fisher Discriminant Analysis (KFD A), and assess po wer control through ARE. Additional empirical justification of our test on various datasets is presented in section 4. I I . S TA T I S T I C A L H Y P O T H E S I S T E S T I N G A statistical hypothesis test is a method which, based on experimental data, aims to decide whether a hypothesis (called null or H 0 ) is true or false, against an alternati ve hypothesis ( H 1 ). The lev el of significance α of the test represents the probability of rejecting H 0 under the assumption that H 0 is true (type I error). A type II error ( β ) occurs when we reject H 1 although it holds. The power of the statistical test is usually defined as 1 − β . A desirable property of a statistical test is that for a prescribed global significance lev el α the power equals one in the population limit. W e divide the discussion of hypothesis testing into two topics: homogeneity testing and multiple comparisons. A. Maximum Mean Discr epancy (MMD) Embedding probability distributions into Reproducing K ernel Hilbert Spaces (RKHSs) yields a linear method that takes information of higher order statistics into account [9], [20], [21]. Characteristic kernels [6], [21], [8] injecti vely map the probability distribution onto its mean element in the corresponding RKHSs. The distance between the mean elements ( µ ) in the RKHS is kno wn as MMD [9], [10]. The definition of MMD [9] is giv en in the following theorem: Theorem 1. Let ( X , B ) be a metric space, and let P , Q be two Bor el pr obability measur es defined on X . The kernel function k : X × X → R embeds the points x ∈ X into the corr esponding r epr oducing kernel Hilbert space H . Then P = Q if and only if MMD( P , Q ) = 0 , where MMD( P , Q ) := k µ P − µ Q k H = k E P [ k ( x, . )] − E Q [ k ( y , . )] k H = ( E x,x 0 ∼ P [ k ( x, x 0 )] + E y ,y 0 ∼ Q [ k ( y , y 0 )] − 2 E x ∼ P,y ∼ Q [ k ( x, y )]) 1 2 . (1) B. Homogeneity T esting A two-sample test in vestigates whether two samples are generated by the same distribution. T o do testing, MMD can be used to measure the distance between embedded probability distributions in RKHS. Besides calculating the distance measure, we need to check whether this distance is significantly different from zero. For this, the asymptotic distribution of this distance measure is used to obtain a threshold on MMD values, and to extract the statistically significant cases. W e perform a hypothesis test with null hypothesis H 0 : P = Q and alternati ve H 1 : P 6 = Q on samples drawn from two distributions P and Q . If the result of MMD is close enough to zero, we accept H 0 , which indicates that the distrib utions P and Q coincide; otherwise the alternativ e is assumed to hold. With α as a threshold on the asymptotic distribution of the empirical MMD (when P = Q ) , the ( 1 − α )-quantile of this distrib ution is statistically significant. Our MMD test determines it by means of a bootstrap procedure. 3 C. Multiple Comparisons Statistical analysis of a data set typically needs testing many hypotheses. The multiple comparisons or multiple testing problem arises when we e valuate se veral statistical hypotheses simultaneously . Let α be the ov erall type I error , and let ¯ α denote the type I error of a single comparison in the multiple testing scenario. Maintaining the prescribed significance level of α in multiple comparisons yields ¯ α to be more stringent than α . Nev ertheless, in many studies α = ¯ α is used without correction. Sev eral statistical techniques hav e been developed to control α [23]. W e use the Dunn- ˆ Sid ´ ak method: For n independent comparisons in multiple testing, the significance lev el α is obtained by: α = 1 − (1 − ¯ α ) n . As α decreases, the probability of type II error ( β ) increases and the po wer of the test decreases. This requires to control β while correcting α . T o tackle this problem, and to control β , we define a new hypothesis test based on RMMD, which has higher power than the MMD-based test, in the next section. T o compare the distributions in the multiple testing problem we use two approaches: one-vs-all and pairwise comparisons. In the one-vs-all case each distribution is compared to all other distributions in the family , thus M distributions require M − 1 comparisons. In the pairwise case each pair of distributions is compared at the cost of M ( M − 1) 2 comparisons. I I I . R E G U L A R I Z E D M A X I M U M M E A N D I S C R E P A N C Y ( R M M D ) The main contribution of this paper is a novel regularization of MMD measure called RMMD. This regularization aims to provide a test statistics with greater power (power closer to 1 with a prescribed type I error α ). Erdogmus and Principe [5] sho wed that − log k µ P k 2 H is the Parzen windo w estimation of the Renyi entropy [16]. W ith RMMD we obtain a statistical test with greater power by penalizing the term k µ P k 2 H + k µ Q k 2 H . W e formulate RMMD and its empirical estimator as follows: RMMD( P , Q ) := MMD( P , Q ) 2 − κ P k µ P k 2 H − κ Q k µ Q k 2 H (2) \ RMMD( P , Q ) := k ˆ µ P − ˆ µ Q k 2 H − κ P k ˆ µ P k 2 H − κ Q k ˆ µ Q k 2 H (3) where κ P , and κ Q are non-negati ve regularization constants. For simplicity we consider κ P = κ Q = κ in many application, howe ver , we can introduce prior knowledge about the complexity of distributions by choosing κ P 6 = κ Q . The modified Jensen-Shanon div ergence (JS) [3] corresponding to RMMD is defined as: D ( P, Q ) := H s ( P , Q ) − ( κ + 1)( H s ( P ) + H s ( Q )) (4) where H s denotes the (cross) entropy . Since κ is positiv e, the absolute value of second term on the right- hand side of eq. (4) increases, leading to a higher weight for the mutual information than for the entropy (vice versa if κ would be lower than -1). 1 Here we summarize the notation needed in the next section. Giv en samples { x i } n 1 i =1 and { y i } n 2 i =1 drawn from distributions P and Q , respectiv ely , the mean element, the cross-cov ariance operator and the cov ariance operator are defined as follows [7], [9]: ˆ µ P = 1 n 1 P n 1 i =1 k ( x i , . ) , b Σ P Q = n 1 n 2 n 1 + n 2 ( ˆ µ P − ˆ µ Q ) ⊗ ( ˆ µ P − ˆ µ Q ) , and b Σ P = 1 n 1 P n 1 i =1 ( k ( x i , . ) ⊗ k ( x i , . )) − ( ˆ µ P ⊗ ˆ µ P ) , where u ⊗ v for u, v ∈ H is defined for all f ∈ H as ( u ⊗ v ) f = h v , f i H u . The quantities ˆ µ Q and b Σ Q are defined analogously for the second sample { y i } n 2 i =1 . The population counterparts, i.e., the population mean element and the population cov ariance operator are defined for any probability measure P as h µ P , f i H = E [ f ( x )] for all f ∈ H , and h f , Σ P g i H = cov P [ f ( x ) , g ( y )] for f , g ∈ H . From now on we call Σ B = Σ P Q the between-distribution covariance . The pooled cov ariance operator (which we call also the within-distribution covariance ) is denoted by: Σ W = n 1 n 1 + n 2 Σ P + n 2 n 1 + n 2 Σ Q . 1 RMMD with negativ e-valued κ can be used in clustering as a diver gence to compare clusters. W e achieve greater entropy with broader clusters. The resulting clustering method avoids overfitting with narrow clusters. 4 A. Limit Distribution of RMMD Under Null and F ixed Alternative Hypotheses No w we deriv e the distrib ution of the test statistics under the null hypothesis of homogeneity H 0 : P = Q (Theorem 2), which implies µ P = µ Q and Σ P = Σ Q = Σ W . Consistency of the test is guaranteed by the form of the distrib ution under H 1 : P 6 = Q (Theorem 2). Assume that { x i } n 1 i =1 and { y i } n 2 i =1 are independent samples from P and Q, respecti vely (a priori the y are not equally distrib uted). Let z i := ( x i , y i ) , h ( z i , z j ) := k ( x i , x j ) + k ( y i , y j ) − k ( x i , y j ) − k ( x j , y i ) − h 0 ( z i , z j ) , and h 0 ( z i , z j ) = κ P k ( x i , x j ) + κ Q k ( y i , y j ) , and D − → denotes con vergence in distrib ution. W ithout loss of generality we assume n 1 = n 2 = n , and κ P = κ Q = κ . The proofs hold ev en when κ P 6 = κ Q . Based on Hoeffding [14], Theorem A (p. 192) and Theorem B (p. 193) by Serfling [19], we can prov e the follo wing theorem: Theorem 2. If E [ h 2 ] < ∞ , under H 1 , \ RM M D is asymptotically normally distributed n 1 2 ( \ RM M D − RM M D ) D − → N (0 , ˆ σ 2 ) , with variance ˆ σ 2 = 4( E z [ E z 0 [ h ( z , z 0 ) 2 ]] − E 2 z ,z 0 [ h ( z , z 0 )]) , uniformly at rate 1 / √ n . Under H 0 , the same con ver gence holds with ˆ σ 2 = 4 ( E z [ E z 0 [ h 0 ( z , z 0 ) 2 ] ] − E 2 z ,z 0 [ h 0 ( z , z 0 )]) > 0 . T o increase the power of our RMMD-based test we need to decrease the variance under H 1 in Theorem 2. The following Theorem can be used to obtain maximal po wer by setting κ = 1 . This will gi ve us a fixed hyper-parameter —no need for user tuning. The optimal value of κ decreases both the variance of H 1 and H 0 simultaneously and the fixed α is defined over the changed v ariance of H 0 . Theorem 3. The highest power of RMMD is obtained for κ = 1 . Proof . Let denote A = k ( x i , x j ) + k ( y i , y j ) and B = k ( x i , y j ) − k ( x j , y i ) . Based on Theorem 2, the v ariance under H 1 is obtained by: ˆ σ 2 = 4( E z [ E z 0 [ h ( z , z 0 ) 2 ]] − E 2 z ,z 0 [ h ( z , z 0 )]) = 4( E [((1 − κ ) A − B ) 2 ] − ( E 2 [(1 − κ ) A − B ])) = 4((1 − κ ) 2 ( E [ A 2 ] − E 2 [ A ]) + E [ B 2 ] − E 2 [ B ]) = 4((1 − κ ) 2 v ar( A ) + v ar( B )) , (5) where v ar( A ) , and v ar( B ) denote the v ariances. T o get maximal power , we set ∂ ((1 − κ 2 ) v ar( A ) + v ar( B )) ∂ κ = 0 , (6) which yields κ = 1 . B. Comparison between RMMD, MMD, and KFD A According to Theorem 8 by Gretton et al. [9], under the null hypothesis the test statistics of MMD degenerates. This corresponds to ˆ σ 2 = 0 in our Theorem 2. For large sample sizes the null distribution of MMD approaches in distribution as an infinite weighted sum of independent χ 2 1 random variables, with weights equal to the eigen values of the within-distribution cov ariance operator Σ W . If we denote the test statistics based on MMD by ˆ T MMD n , then ˆ T MMD n D − → C P ∞ l =1 λ l ( z 2 l − 1) , where z l ∼ N (0 , 2) are i.i.d. random variables, and C is a scaling factor . Harchaoui et al. [13] introduced Kernel Fisher Discriminant Analysis (KFD A) as a homogeneity test by regularizing MMD with the within-distribution cov ariance operator . The maximum Fisher discriminant ratio defines this test statistic. The empirical KFD A test statistic is denoted as \ KFD A( P , Q ) = n 1 n 2 n 1 + n 2 k ˆ µ P − ˆ µ Q ( ˆ Σ W + γ n I ) 1 2 k 2 H . T o analyze the asymptotic behaviour of this statistics under the null hypothesis, Harchaoui et al. [13] consider two situations reg arding the 5 regularization parameter γ n : 1) one where γ n is held fix ed, obtaining the limit distrib ution similar to MMD under H 0 ; 2) one where γ n tends to zero slower than n − 1 / 2 . In the first situation the test statistic con ver ges to ˆ T KFDA( γ n ) n D − → C P ∞ l =1 ( λ l + γ n ) − 1 λ l ( z 2 l − 1) . Thus, the test statistics based on KFD A normalizes the weights of χ 2 1 random variables by using the cov ariance operator as the regularizer . In comparison MMD is more sensitiv e to the information of higher order moments because of their bigger weights (larger eigen values of the cov ariance operator). In the second situation (applicable in practice only for very large sample sizes) the test statistics con verges to ˆ T KFDA( γ n ) n D − → N ( C , 1) , where C is a constant. The asymptotic con ver gence of the test statistic based on RMMD is ˆ T RMMD n D − → N (0 , ˆ σ 2 ) , where ˆ σ 2 is the variance of the function h in Theorem 2. The precise analytical normal distribution obtains higher po wer in RMMD. Because of the div ergence ( σ 2 = 0 in the asymptotic distribution) for MMD and KFD A, they use an estimation of the distribution under the null hypothesis which looses the accuracy and affect the power . In contrast to MMD and KFD A, RMMD is consistent since the div ergence under the null hypothesis does not happen any more. RMMD is the generalized form of the test statistics based on MMD, which we obtain for κ = 0 . Moreover , by minimizing the variance of the normal distribution, we obtain the best power for κ = 1 and thus the hyper-parameter κ is fixed without requiring tuning by the user . In comparison to KFD A, RMMD does not require restrictiv e constraints to obtain high power . It also results in higher power than MMD and KFD A in cases with small sample size. The speed of power con vergence in KFD A is O p (1) , which is slower than O p ( n − 1 2 ) in RMMD when n → ∞ . Regarding the computational complexity , for MMD a parametric model with lower order moments of the test statistics is used to estimate the v alue of MMD which degenerates under H 0 , and which has no consistency or accuracy guarantee. In comparison, the bootstrap resampling and the eigen-spectrum of the gram matrix are more consistent estimates with computational cost of O ( n 2 ) , where n is the number of samples [11]. For RMMD, the con vergence of the test statistic to a Normal distribution enables a fast, consistent and straightforward estimation of the null distribution within O ( n 2 ) time without the need of using an estimation method. The results of power comparison between these tests are reported in section 4. C. Asymptotic Relative Efficiency of Statistical T ests T o assess the power control we use the asymptotic relati ve ef ficiency . This criterion shows that RMMD is a better test statistic and obtains higher power rather than KFD A and MMD with smaller sample size. Relati ve efficienc y enables one to select the most effecti ve statistical test quantitativ ely [15]. Let T and V be test statistics to be compared. The necessary sample size for the test statistics T to achie ve the power 1 − β with the significance lev el α is denoted by N T ( α, 1 − β ) . The relati ve efficienc y of the statistical test T with respect to the statistical test V is gi ven by: e T ,V ( α, 1 − β ) = N V ( α, 1 − β ) / N T ( α, 1 − β ) . (7) Since calculating N T ( α, 1 − β ) is hard e ven for the simplest test statistics, the limit value e T ,V ( α ; 1 − β ) , as 1 − β → 1 , is used. The limiting value is called the Bahadur Asymptotic Relativ e Ef ficiency (ARE) denoted by e B T ,V . e B T ,V := lim 1 − β → 1 e T ,V ( α, 1 − β ) , (8) The test statistic V is considered better than T , if e T ,V is smaller than 1, because it means that V needs a lo wer sample size to obtain a power of 1 − β , for the giv en α . In [13], authors assessed the power control by means of analysis of local alternati ves which work when we hav e very large sample size or when n tends to infinity . In this article, we focus our attention on the small sample size case, which is more challenging. 6 In section 4, we compute e B MMD , RMMD = N RMMD N MMD , e B MMD , KFDA = N KFDA N MMD , and e B KFDA , RMMD = N RMMD N KFDA using artificial datasets and two types of kernels, and we obtain smaller ARE for RMMD rather than KFD A and MMD. This means RMMD gi ves higher power with much smaller sample size. Results for dif ferent data sets are reported in T able 2, Figure 2, and Figure 3. I V . E X P E R I M E N T S MMD [9] was experimentally sho wn to outperform many traditional two-sample tests such as the generalized W ald-W olfowitz test, the generalized Kolmogoro v-Smirnov (KS) test [2], the Hall-T ajvidi (Hall) test [12], and the Biau-Gy ¨ orf test. It was sho wn [13] that KFD A outperforms the Hall-T ajvidi test. W e select KS and Hall as traditional baseline methods, on top of which we compare RMMD, KFD A, and MMD. T o experimentally ev aluate the utility of the proposed hypothesis testing method, we present results on v arious artificial and real-world benchmark datasets. A. Artificial Benchmarks with P eriodic and Gaussian Distributions Our proposed method can be used for testing the homogeneity of structured data, which is an ad- v antage o ver traditional two-sample tests. W e artificially generated distrib utions from Locally Compact Abelian Groups (periodic data) and applied our RMMD-test to decide whether the samples come from the same distributions or not. Suppose the first sample is drawn from a uniform distribution P on the unit interval. The other sample is drawn from a perturbed uniform distribution Q ω with density 1 + sin( ω x ) . For higher perturbation frequencies ω it becomes harder to discriminate Q ω from P . Since the distributions have a periodic nature, we use a characteristic kernel tailored to the periodic domain, k ( x, y ) = cosh( π − ( x − y ) mod 2 π ) . For 200 samples from each distribution, the type II error is computed by comparing the prediction to the ground truth ov er 1000 repetition. W e av erage the results ov er 10 runs. The significance lev el is set to α = 0 . 05 . W e perform the same experiment with MMD, KFD A, KS and Hall. The powers of the homogeneity test for comparing P and Q 6 with the above mentioned methods are reported in T able 1 as Periodic1. The best power is achiev ed by RMMD, and as expected, the results of kernel methods are better than traditional ones. Since the selection of the kernel is a critical choice in kernel-based methods, we also in vestigated the usage of a dif ferent kernel and replaced the pre vious kernel with k ( x, y ) = − log(1 − 2 θ cos( x − y ) + θ 2 ) , where θ is a hyperparameter . W e report the best results achiev ed by θ = 0 . 9 as Periodic2 in T able 1. The reader is referred to [4], [8] for a detailed study on these kernels. W e also report the results on the toy problem of comparing two 25 -dimensional Gaussian distributions with 250 samples, both with zero mean vector but with cov ariance matrix 1 . 5 I and 1 . 8 I , respecti vely . This dataset is referred as Gaussian in T able 1. T ABLE I T H E P O W ER O B TAI N E D O N T H E P E R I OD I C DAT A , T H E G AU SS I A N , T H E M N I S T , C OV E RT Y PE , A N D F L A R E S O LA R D A TAS E T S , B Y A P P L Y I N G R M MD W I T H κ = 0 . 8 F O R T H E P E R I O DI C DAT A A N D κ = 1 F O R T H E O T HE R S , A N D K F DA W I T H γ = 10 − 1 . RMMD KFD A MMD KS Hall P E R I O D I C 1 0.40 ± 0.02 0 . 2 4 ± 0 . 0 1 0 . 2 3 ± 0 . 0 2 0 . 1 1 ± 0 . 0 2 0 . 1 9 ± 0 . 0 4 P R E I O D I C 2 0.83 ± 0.03 0 . 6 6 ± 0 . 0 5 0 . 5 6 ± 0 . 0 5 0 . 1 1 ± 0 . 0 2 0 . 1 9 ± 0 . 0 4 G AU S S I A N 1.00 0 . 8 9 ± 0 . 0 3 0 . 8 8 ± 0 . 0 3 0 . 0 4 ± 0 . 0 2 1.00 M N I S T 0.99 ± 0.01 0 . 9 7 ± 0 . 0 1 0 . 9 5 ± 0 . 0 1 0 . 1 2 ± 0 . 0 4 0 . 7 7 ± 0 . 0 4 C OV E RT Y P E 1.00 1.00 1.00 0 . 9 8 ± 0 . 0 2 0 . 0 0 F L A R E - S O L A R 0.93 0 . 9 1 0 . 8 9 0 . 0 0 0 . 0 0 7 An in vestigation of the effect of kernel selection and tuning parameters [22] showed that best results for MMD can be achie ved by those kernels and parameters that obtain supreme v alue for MMD. Our reported results agree. The results of kernel-based test statistics (RMMD, KFD A, and MMD) are improved by kernel justification and parameter tuning, and in all cases RMMD outperform KFD A and MMD. For instance, the result of periodic kernel with tuned hyper -parameter θ is better than the one of the first periodic kernel without hyper-parameter (reported in T able 1 as Periodic2 and Periodic1, respectiv ely). For Gaussian kernel-processed datasets, the median distance between data points provided the best results. W e used the 5-fold cross validation procedure to tune the parameters in our experiment. The ef fect of changing κ on the po wer is simulated in two tests: first, by testing the similarity between the uniform distribution and Q 4 , and second with Q 6 . In both cases, the best power is obtained for κ = 0 . 8 . The results slightly differ from the theoretical value ( κ = 1 ) because of the relativ ely small sample sizes ( n 1 = n 2 = 200 ) used for the tests. For samples with larger sizes we obtained maximal po wer with κ = 1 . The results are depicted in Figure 1. Fig. 1. Effect of κ on the po wer of the test. The alternati ves are Q 6 in the left and Q 4 in the right figure. T o assure that the statistical test is not aggressiv e for rejecting the null hypothesis, we reported the results of type I error for RMMD, KFD A, and MMD with dif ferent sample sizes in Figure 2. Both samples are supposed to be drawn from Q 6 . W e used Gaussian kernel with a variance equals to medium distance of data points. The results av eraged over 100 runs and the confidence interv al obtained by 10 replicates. RMMD obtains zero type I error with smaller sample sizes, and the results of KFD A and MMD are comparable. T o assess the po wer control of the test statistics we also compared e B MMD , RMMD , e B MMD , KFDA , and e B KFDA , RMMD under H 1 when P is a uniform distribution and the alternati ve is Q 6 . W e obtained smaller ARE for RMMD rather than for KFD A and MMD. This means RMMD giv es higher power with fe wer samples. T able 2 sho ws the results, av eraged ov er 1000 runs, for periodic data (Periodic1 and Periodic2). Figure 3 depicts the detailed results of the type II error for RMMD, MMD, and KFD A based on dif ferent sample sizes n . AREs are also calculated for more complex tasks. Consider the first sample is drawn from a uniform distribution P on the unit area. The other sample is drawn from the perturbed uniform distribution Q ω with density 1 + sin ( ω x ) sin ( ω y ) . For increasing v alues of ω , the discrimination of Q ω from P becomes harder (Figure 4). The range of ω changes between 1 to 6. W e call these problems Puni1 to Puni6, respectiv ely . The best results for all statistical kernel-based methods are achie ved by using a characteristic kernel tailored to the periodic domain, k ( x, y ) = Π 2 i =1 1 / (1 − 2 θcos ( x i − y i ) + θ 2 ) , with θ = 0 . 9 tuned using the 5-fold cross v alidation procedure. The results reported in T able 2 sho w much smaller values of ARE for RMMD rather than for KFD A and MMD. Figure 5 sho ws the detailed results of the type II error for RMMD, MMD, and KFD A based on dif ferent sample sizes n and dif ferent frequencies ω . As displayed in Figure 5, RMMD obtains the rob ust result of zero type II error for 100 samples ov er all different frequencies. Instead KFD A and MMD need much larger samples for the more dif ficult cases with larger ω to obtain a power of one. 8 Fig. 2. T ype I error changed based on different sample size n . T ABLE II T H E A R E O B T A I N E D O N T H E P E R I O D IC D A TA , B Y A P P L Y I N G R M M D W I T H κ = 1 , A N D θ = 0 . 9 I N P E R I O D I C K E R N E L S , A N D K F DA W I T H γ = 10 − 1 . e B MMD , RMMD e B MMD , KFDA e B KFDA , RMMD P E R I O D I C 1 0.71 0 . 7 5 0 . 9 3 P R E I O D I C 2 0.75 1 0.75 P U N I 1 0.11 0 . 7 8 0 . 1 4 P U N I 2 0.09 0 . 8 2 0 . 1 1 P U N I 3 0.09 0 . 8 2 0 . 1 1 P U N I 4 0.08 0 . 8 5 0 . 0 9 P U N I 5 0.07 0 . 8 8 0 . 0 6 P U N I 6 0.05 0 . 8 1 0 . 0 6 B. MNIST , Covertype, and Flar e-Solar Datasets Moving from synthetic data to standard benchmarks, we tested our method on three datasets: 1) the MNIST dataset of handwritten digits (LibSVM library: 10 classes, 5000 data points, and 784 dimensions); 2) the Cov ertype dataset of forest cover types (LibSVM library: 7 classes, 1400 instances, and 54 dimensions); 3) the Flare-Solar dataset (mldata.or g: 2 classes, 100 instances, 10 dimensions). W e compare the performance of RMMD with κ = 1 , KFD A with γ = 10 − 1 and MMD, using the pairwise approach and testing for dif ferences between the distributions of the classes, see T able 1. W e average the results over 10 runs. The family wide le vel is set to α = 0 . 05 (resulting in ¯ α = 0 . 0011 , ¯ α = 0 . 0024 and ¯ α = 0 . 05 for each indi vidual comparison for MNIST , Covertype and Flare-Solar datasets, respectiv ely). The RMMD-based test achiev es higher po wer than the other methods (see T able 1). C. Electr oencephalography Data W e recorded EEG from four subjects performing a visual task. A checkerboard was presented in the subject’ s left visual field. W e refer to [25] for details on data collection and preprocessing. In our learning task, for each subject we hav e 64 signal distrib utions assigned to 64 electrodes. The data contain 360 9 Fig. 3. T ype II error change based on different sample size n. On the left, the results with Periodic kernel 1 and on the right, the results with Periodic kernel 2. Fig. 4. The probability density function of Puni1 with ω = 1 on the left and the probability density function of Puni6 with ω = 6 on the right. As ω increases the probability density function looks more similar to the uniform distribution and the discrimination of P and Q ω becomes more difficult for the test statistics. instances of a 200 dimensional feature vector for each distrib ution. The goal of hypothesis testing is to disambiguate signals recorded from electrodes corresponding to early visual cortex from the rest. This is dif ficult because of the low signal-to-noise ratio and the similarity of the patterns of all electrodes. Moreov er , the high number of electrodes makes this experiment a good candidate to assess the multiple comparison part of our method. In the one-vs-all approach the normalized distribution of each electrode is compared to the normalized combined distribution of the other 63 electrodes. RMMD with κ = 1 with Gaussian kernel is used as our hypothesis test. The parameter σ of the Gaussian kernel is set to the median distance of data points. The results of our hypothesis test reject the null hypothesis and confirm the dissimilarity of distributions in 63 electrodes. The results of the pairwise approach with RMMD and MMD are depicted in Figure 6. Neuroscientists usually subjectiv ely assess the results obtained from imaging techniques and inferred from machine learning. For instance, in the current experiment the expectation is that electrodes in 10 Fig. 5. On the left, different sample sizes n for dif ferent frequencies ω are shown. The type II error changes based on dif ferent sample sizes n and different frequencies ω , in the middle for the KFD A-based test, and on the right for the MMD-based test. Fig. 6. The results of RMMD and MMD as hypothesis tests on the EEG data recorded from 64 electrodes per subject in the top row and the bottom row , respecti vely . Categorized electrodes recognized by the two methods as related to the visual task are colored. region A1 are categorized together by means of EEG imaging techniques and multiple comparisons. But electrodes of other area (such as A 2 and A 3 , see Figure 7) can be confused as belonging to A 1 due to the high noise. Figure 7 describes the categorization of the electrodes. W e assess our results quantitativ ely by means of False Discovery Rates (FDR), using the following FDRs to compare the results of RMMD to those of MMD: F DR 0 = ( no. of electrodes categorized for the visual task in A 2 ∪ A 3 ∪ B ) U , F DR 1 = ( no. of electrodes categorized for the visual task in A 3 ∪ B ) U , F DR 2 = ( no. of electrodes categorized for the visual task in B ) U , where U is the total number of electrodes categorized for the task. The results are depicted in Figure 7. RMMD obtained more robust and better results than MMD with smaller FDRs. 11 Fig. 7. The reference image of the EEG electrodes is shown on the left. W e categorized electrodes into four groups as follo ws: A1, the electrodes corresponding to visual cortex in the region of interest, A2, the peripheral electrodes that can be wrongly detected due to noise, A3, the electrodes in the left visual cortex often detected due to noise or interrelation between brain areas, and B, all the remaining electrodes. On the right, the results of RMMD and MMD are quantitatively compared based of the FDRs defined in the text. The smallest and most robust FDRs are obtained by RMMD. V . C O N C L U S I O N Our novel regularized maximum mean discrepancy (RMMD) is a kernel-based test statistic generalizing the MMD test. W e proved that RMMD overpo wers MMD and KFD A; power consistency is obtained with higher rate. Power control makes RMMD a good hypothesis test for multiple comparisons, especially for the crucial case of small sample sizes. In contrast to KFD A and MMD, the con ver gence of RMMD- based test statistics to the normal distribution under null and alternati ve hypotheses yields fast and straightforward RMMD estimates. Experiments with goldstandard benchmarks (MNIST , Cov ertype and Flare-Solar dataset) and with EEG data yield state of the art results. V I . A C K N O W L E D G E M E N T This work was partially funded by the Nano-resolved Multi-scale Inv estigations of human tactile Sensa- tions and tissue Engineered nanobio-Sensors (SINERGIA:CRSIK O 122697/1) grant, and the State repre- sentation in reward based learning from spiking neuron models to psychophysics(NaNoBio T ouch:228844) grant. R E F E R E N C E S [1] Borgwardt, K, Gretton, A., Rash, M., Kriegel, H. P ., Sch ¨ olkopf, B, Smola, A. J.: Integrating structured biological data by kernel maximum mean discrepancy . Bioinformatics, vol.22(14), pp. 49-57, (2006) [2] Freidman, J, Rafsky , L.: Multiv ariate generalizations of the W ald-W olfo witz and Smirnov two-sample tests. The Annals of statistics, vol.7, pp. 697-717, (1979) [3] Fuglede, B., T opsoe, F .: Jensen-Shannon diver gence and Hilbert space embedding. In Proceedings of the International Symposium on Information Theory (ISIT), (2004) [4] Danafar , S., Gretton, A, Schmidhuber , J.: Characteristic kernels on structured domains excel in robotics and human action recognition. ECML: Machine Learning and Knowledge Discov ery in Databases, pp. 264-279, LCNS, Springer, (2006) [5] Erdogmus, D, Principe, J., C.: From Linear adaptive filtering to nonlinear information processing. IEEE Signal Processing Magazine, vol.23(6), pp. 14-23, (2006) [6] Fukumizu, K, Bach, F ., R., Jordan, M., I.: Dimensionality reduction for supervised learning with reproducing kernel Hilbert Spaces. Journal of Machine Learning, vol.5, pp. 73-99, (2004) [7] Fukumizu, K., Bach, F . R., Gretton, A.: Statistical consistency of kernel canonical correlation analysis. Journal of Machine Learning, vol.8, pp. 361-383, (2007) [8] Fukumizu, K., Sriperumbudur , B., Gretton, A. Sch ¨ olkopf, B.: Characteristic kernels on groups and semigroups. In Advances in Neural Information Processing Systems. K oller , D., D. Schuurmans, Y . Bengio, L. Bottou (eds.), vol. 21, pp. 473-480, Curran, Red Hook, NY , USA, (2009) 12 [9] Gretton, A, Borgw adt, B., K., Rasch, M., Sch ¨ olkopf, B., Smola, A.: A kernel method for the two-sample-problem. In Advances in Neural Information Processing Systems. Sch ¨ olkopf, B., J. Platt, T . Hofmann (eds.), vol.19, pp. 513-520, MIT Press, Cambridge, MA, USA, (2007) [10] Gretton, A., Fukumizu, K., T eo, C. H., Song, L., Sch ¨ olkopf, B, Smola, A.: A Kernel Statistical T est of Independence. In Advances in Neural Information Processing System. Platt, J. C.,D. K oller, Y . Singer , S. Roweis (eds.), vol.20, pp. 585-592, MIT Press, Cambridge, MA, USA, (2008) [11] Gretton, A., Fukumizu, K.,Harchaoui, Z., Sriperumbudur , B.: A Fast, Consistent Kernel T wo-Sample T est. In Advances in Neural Information Processing Systems, vol.22, (2009) [12] Hall, P ., T ajvidi, N.: Permutation tests for equality of distributions in high-dimensional settings. Biometrika, vol.89, pp. 359-374, (2002) [13] Harchaoui, Z., Bach, F ., R., Moulines, E.: T esting for homogeneity with kernel fisher discriminant analysis. In Advances in Neural Information Processing Systems, vol.20, pp. 609-616, (2008) [14] Hoeffding, W . A class of statistics with asymptotically normal distributions. The Annals of mathematical Statistics, vol.19(3), pp. 293-325, (1948) [15] Nikitin, Y .: Asymptotic efficiency of non-parametric tests. Cambridge Univ ersity Press, (1995) [16] Renyi, A.: On measures of entropy and information. In Proc. Fourth Berkeley Symp, Math, Statistics and Probability , pp. 547-561, (1960) [17] Rubner , Y ., T omasi, C., Gubias, L., J.: The earth movers distance as a metric for image retriev al. International Journal of Computer V ision, vol.40(2), pp. 99-121, (2000) [18] Scheff ´ e, H.: The analysis of variance. W iley , Ne w Y ork, (1959) [19] Serfling, B.: Approximation Theorems of Mathematical Statistics. W iley , New Y ork, (1980) [20] Smola, A., J., Gretton, A., Song, L, Sch ¨ olkopf, B.: A Hilbert Space Embedding for Distributions. In Algorithmic Learning Theory . Hutter , M., R. A. Servedio, E. T akimoto (eds.), vol.18, pp. 13-31, Springer , Berlin, Germany , (2007) [21] Sriperumbudur , B. K., Gretton, A., Fukumizu, K.,Lanckeriet,G., Sch ¨ olkopf, B.: Injective Hilbert space embeddings of probability measures. In proceedings of the 21st Annual Conference on Learning Theory . Servedio, R. A., T . Zhang (eds.), pp. 111-122, Omnipress, Madison, WI, USA, (2008) [22] Sriperumbudur , B., K., Fukumizu, K., Gretton, A., Lanckeriet, G., Sch ¨ olkopf, B.: K ernel choice and classifiability for RKHS embeddings of probability distributions. In Advances in Neural Information Processing Systems 22, (2009) [23] W alsh, B.: Multiple Comparisons: Bonferroni Corrections and False Discovery Rates. Lecture Notes for EEB, vol.581, (2004) [24] W ¨ achter , A., Biegler , L., T .: On the implementation of a primal-dual interior point filter line search algorithm for large-scale nonlinear programming. Mathematical Programming, vol.106(1), pp. 25-27, (2006) [25] Whittingstall, K., Dough, W ., Matthias, S., Gerhard, S.: Correspondence of visual evok ed potentials with fMRI signals in human visual cortex. Brain T opogr, Servedio, R. A., T . Zhang (eds.), v ol.21, pp. 86-92, Omnipress, Madison, WI, USA, (2008)
Original Paper
Loading high-quality paper...
Comments & Academic Discussion
Loading comments...
Leave a Comment