Markovian models for one dimensional structure estimation on heavily noisy imagery
Radar (SAR) images often exhibit profound appearance variations due to a variety of factors including clutter noise produced by the coherent nature of the illumination. Ultrasound images and infrared images have similar cluttered appearance, that mak…
Authors: Ana Georgina Flesia, Javier Gimenez, Elena Rufeil Fiori
Mark o vian mo dels for one dimensional structure estimation on hea vily noisy imagery . Ana Georgina Flesia Ja vier Gimenez and Elena Rufeil Fiori F aMAF-UNC Ing. Medina Allende s/n, Ciudad Univ ersitaria CP 5000, C´ ordoba, Argen tina. Marc h 12, 2022 Abstract Radar (SAR) images often exhibit profound app earance v ariations due to a v ariety of factors including clutter noise pro duced b y the coherent nature of the illumination. Ultrasound images and infrared images hav e similar cluttered app earance, that make 1 dimensional structures, as edges and ob ject b oundaries difficult to lo cate. Structure information is usually extracted in t w o steps: firstly , building and edge strength mask classifying pixels as edge p oin ts by h yp othesis testing, and secondly computing on pixel wide connected edges. With constant false alarm rate (CF AR) edge strength detectors for sp ec kle clutter, the image needs to b e scanned by a sliding windo w comp osed of sev eral differently orien ted splitting sub-windows. The accuracy of edge lo cation for these ratio detectors dep ends strongly on the orientation of the sub-windows. In this work we prop ose to transform the edge strength detection problem into a binary segmen tation problem in the undecimated wa v elet domain, solv able using parallel 1d Hidden Mark ov Mo dels. F or general dep endency mo dels, exact estimation of the state map b ecomes computationally complex, but in our mo del, exact MAP is feasible. The effectiv eness of our approac h is demonstrated on sim ulated noisy real-life natural images with a v ailable ground truth, while the strength of our output edge map is measured with Pratt’s, Baddeley an Kappa proficiency measures. Finally , analysis and exp eriments on three different types of SAR images, with differen t p olarizations, resolutions and textures, illustrate that the prop osed metho d can detect structure on SAR images effectiv ely , providing a v ery go o d start p oint for active con tour metho ds. Keyw ords:Haar w a velet edge detection; Graphical mo dels, SAR images; undecimated w av elet transform 1 1 In tro duction Satellite b orn Syn thetic Ap erture Radar (SAR) images represent the complex reflectivity map of a scene, and unlike optical images, the in terpretation is not consistent with common visual p erception. F urthermore, the direct application of conv en tional image pro cessing to ols conceiv ed from an optical p oint of view usually giv es sub optim um results on SAR data. Among the most imp ortant differences b et ween optical and SAR images are the appropriate noise models. In sp ecial, a complex SAR image ma y be represented as the conv olution of the lo cal complex reflectivity of the observ ed area with the impulse resp onse of the SAR system. Hence, the SAR data pixels are roughly the low pass filtered version of the complex lo cal scattering prop erties of the observed scene. A usual mo del for the complex image is obtained considering its real and imaginary parts as independent, zero mean and equally distributed random v ariables. Consequently , the intensit y of a SAR image follo ws a negativ e exp onential distribution, and can b e further modeled as a pro duct of the radar cross section and a noise term called sp ec kle, which is exp onen tially distributed with mean equal to one, T ello Alonso et al. (2011). In the framew ork of SAR pro cessing, it is useful to tak e the logarithm of the original signal in order to manage the multiplicativ e speckle; thus, after this transformation, the speckle is not only additive and signal independent, but also appro ximately Gaussian. Moreo ver, the logarithm operation is helpful in reducing the large dynamic range of SAR data. A crucial p oint for SAR image automatic in terpretation is the lo w level step of scene segmen tation, i. e. the decomp osition of the image in a tessellation of uniform areas. Edge- based segmentation sc hemes aim to find out the transitions betw een uniform areas, rather than directly iden tifying them. The related algorithms generally w ork in tw o stages: they firstly compute an edge strength map of the scene and finally extract the lo cal maxima of this map. The first stage is usually achiev ed using an statistical edge detection filter. It consists in scanning the image with a sliding tw o-region windo w and ev aluating for eac h p osition if there is a c hange betw een the tw o regions by h yp othesis testing. The test are dep endan t of the true underlying conditional distributions that are emitted by the states (classes) of the segmen tation field. Our algorithm for edge strength mask detection in heavily noisy images, like log-amplitude satellite b orn Synthetic Ap erture Radar (SAR) images, whic h is prop osed in this pap er, relies on the difference of statistical behavior along the wa v elet scales of the Gaussian noise in fron t of the edges. The discon tinuities are highligh ted by the w av elet transform, and they tend to p ersist o v er scales. These tw o k ey prop erties, very well known in the optical image pro cessing literature, were describ ed b y Romberg et al. (2001) as: 1. Tw o Populations: Smo oth signal/image regions are represen ted b y small wa velet co effi- cien ts, while edges, ridges, and other singularities are represented by large co efficien ts. 2. P ersistence: Large and small wa velet co efficient v alues cascade along the scale/space represen tation. In terpreting these prop erties statistically , Two Populations imply that wa velet co efficien ts ha ve non-Gaussian marginal statistics, with a large p eak at zero (many small co efficien ts) 2 and heavy tails (a few large coefficients), while Persistence implies that w av elet coefficient v alues are statistically dep endent along the scale/space representation. Nevertheless, the critical sub-sampling in the Discrete W a velet transform (D WT), which discards every second w av elet co efficien t at each decomp osition lev el, results in wa v elet co efficients that are highly dep enden t on their lo cation in the sub-sampling lattice. Small shifts in the input wa v eform ma y cause large changes in the wa v elet co efficien ts, large v ariations in the distribution of energy at differen t scales, and p ossibly large changes in reconstructed w a veforms. In T ello Alonso et al. (2011), the authors advocate for the use of the undecimated w av elet transform for detecting and enhancing edges on SAR images. They prop ose a deterministic m ultiscale thresholding scheme to pro duce an edge strength mask that single out edge candidates to apply snak e algorithms in order to get one pixel wide contin uous edges. This com bination algorithms, in the radiometric domain, are p opular in the literature of SAR edge detection. Radiometric edge strength masks are usually obtained b y h yp othesis testing, using the likelihoo d ratio filter, the robust rank order or the Wilco xon test, or costume made maxim um lik eliho o d ratio tests (see Lim et al (2006), Germain et al (2001), Giron et al (2012) and references therein). Our approach is more automatic than the one in tro duced by T ello Alonso et al (2011), since we estimate all parameters from the data using a Ba y esian mo del in the undecimated w av elet domain. W e mo del each string of pixel related wa velet co efficients as indep endent 1d Hidden Mark ov Mo del with Laplacian and Gaussian marginal distributions, related to “edge” and “no-edge” states, resp ectiv ely , as in W ang et al (2009). W e derive our o wn MAP equations to compute the mo del parameters in order to predict intrascale and interscale edge strength maps. Then w e com bine these maps into one edge strength map that can b e pro cessed with standard Gradien t based edge detection algorithms, watershed algorithms or activ e con tour algorithms. Algorithm 1: Ba yesian edge detector - Compute W ( m, n ) undecimated wa v elet transform, obtaining T matrices of co efficients with the same size that the original image I p er directional band. - Separate the V ertical and Horizon tal Bands to mo del them independently . - Within eac h band, mo del eac h c hain of pixel related co efficien t as a 1d Hidden Marko v Chain with hidden states “edge” and “no-edge”. - Compute the mo del and ev aluate the most lik ely state map for eac h chain. - Com bine the resulting maps with the in tra-scale and inter-scale op erators, producing an edge strength map. - Refine the edge strength map to pro duce a one size pixel edge map. In Sections 2 and 3 w e introduce wa velet transforms and the Bay esian mo deling of 3 w av elet co efficients, lea ving the pro of of the theorems to App endix A. In Section 4 we discuss pro cessing of the obtained esge strenght mask, and develop some synthetic exp eriments, adding noise to go o d quality optical images with av ailable ground truth. Edge quality is measured with three differen t sup ervised edge measures, Pratt’s F OM, Baddely and Kappa. W e also pro vide exp eriments with benchmark SAR images, that compare with other results from the literature. The conclusions and prospects are left for for Section 5. 2 Undecimated Haar w a v elet transform The undecimated discrete w a velet transform (UD WT) has b een indep endently disco v ered sev eral times for differen t purp oses and under different names, shift/translation inv ariant w av elet transform, stationary wa vele t transform or redundant wa v elet transform. The key p oin t is that it is redundant, shift in v arian t, and gives an appro ximation to the con tinuous w av elet transform denser than the appro ximation giv en b y the discrete wa velet transform (D WT), Guo et al. (1995). The most cited implementations of this idea are Mallat’s ` a tr ous algorithm and Beylkin’s algorithm; for details, see Starc k et al. (2007) and references therein. In our implementation, w e use an algorithm based on the idea of no decimation. The size of the co efficients array do not diminish from lev el to lev el, so b y using all co efficients at each lev el, w e get very w ell allo cated high-frequency information. In the UD WT algorithm, the n umber of pixels in v olved in computing a giv en co efficien t grows slow er and so the relation b et w een the frequency and spatial information is more precise, Gy aourov a et al. (2001). The undecimated w av elet transform can b e defined with all types of wa velet filters, but we use the Haar wa v elet since its analyzing filter (the shortest p ossible) gives go o d lo calization and p o or suppression of discon tin uities. T ello Alonso et al. (2011) consider Beylkin’s stationary Haar w av elet transform for edge detection on SAR data. Thresholding Beylkin’s algorithm pro duces very smo oth results, whic h makes the images to lo ok a little blurred. On the other hand, it makes the regions of constant intensit y lo ok almost noise clean. In the case of SAR imagery , we preferred to denoise first with a Wiener filter, applying the undecimated w av elet transform next, with the Haar filter. In Figure 1 w e can see plots of 3 level Haar UDWT co efficients of a natural image taken form the Berkeley Database, Martin et al. (2001). The undecimated w av elet transform allows to link the pixel with the co efficien t, b eside giving b etter edge lo calization than the D WT. 3 W a v elet Reduced Ba y esian Net Mo del The 2d undecimated w av elet transform consists of three bands of detail co efficien ts and one appro ximation band p er level (see Figure 1), each of whic h has the same size as the original image. T o statistically match the tw o-p opulation prop erty of the wa velet transform, we consider the collection of small/large wa velet co efficients from an edge detection p ersp ective. Rom b erg et al. (2001), in a denoising context, mo deled the wa velet co efficien ts as outcomes emitted by a Gaussian mixture that approximates the marginal p df. In our case, “small” 4 Appro ximation coefficients Horizont al coefficients V ertical coefficien ts Diagonal coefficients Figure 1: UD WT of “mountain” image with maximum decomp osition level equal to three. The undecimated wa v elet transform allo ws to link the pixel with the co efficient, b eside giving b etter edge lo calization than the DWT. and “large” mean differen tly . W e con tinue to expect most of the no des to b e “small”, since smo oth regions pro duce c hains of small co efficien ts, while singularities are c hains of “large” co efficien ts. But w e also exp ect large coefficients in close regions near the edges, so Gaussian distributions will give p o or lo calization, making the algorithm return thick edges instead of thin ones. A more heavy-tailed distribution, lik e the Laplacian, will b e b etter suited for mo deling the state “edge”, while the Gaussian will b e kept as a marginal for the “no-edge” state. Thus, the conditional densities of the co efficients w will b e f ( w | no-edge) = 1 √ 2 π σ exp( − w 2 2 σ 2 ) f ( w | edge) = 1 √ 2 φ exp( − √ 2 | w | φ ) The Reduced Bay esian Net of our detector in volv es t wo indep endent Hidden Mark o v mo dels (HMM) for the v ertical and horizon tal bands, each of maximum decomp osition level T . Th us, for eac h pixel ( x, y ) w e ha ve tw o sequences of hidden states S V x,y = { S V x,y , 1 , S V x,y , 2 , . . . , S V x,y ,T } , and S H x,y = { S H x,y , 1 , S H x,y , 2 , . . . , S H x,y ,T } , H and V represen t the horizontal and v ertical bands resp ectiv ely , and where each S V x,y ,t and S H x,y ,t tak e the “edge” or “no-edge” v alues. The hidden 5 state sequences hav e a 1d Mark ov chain prop ert y that mo dels the Persistence prop erty of the wa velets transforms. In this mo del, the observ ed wa velet co efficien ts sequence has b een emitted by the hidden state sequence. The conditional distribution of the co efficien ts, as w e said, is a Laplacian-Gaussian mixture. The edge detector finds the t wo hidden state sequences for eac h pixel given the observ ed sequences of v ertical and horizontal co efficien ts and combine them in tw o different wa ys: 1. The T edge maps from each directional band are com bined with the ma jority v ote rule, generating Horizontal and V ertical edge maps. 2. The Horizontal and V ertical maps are com bined with the b o olean “or” operator, see Figure ?? . [median { s V x,y , 1 , . . . , s V x,y ,T } ] ∨ [median { s H x,y , 1 , . . . , s H x,y ,T } ] Edge maps ma y b e obtained with another choices of deterministic combinations. The Horizon tal and V ertical edge maps ma y be obtained com bining the T lev els of the undecimated w av elet transform with the “and” op erator, decision that lab els a pixel as edge p oint only if it is lab eled as an edge p oint in all levels of the w av elet decomp osition. Applying the median op erator inside each band allows us to repair sequences brok e due to noise, if there is enough evidence that they are edge related. The final com bination with the “or” op erator allo ws us to k eep indep endent horizontal and vertical edges, as well as corner p oin ts. The redundance of the undecimated w av elet transform keeps the information of the diagonal edges in the v ertical and horizon tal co efficients, suppressing the need of a third HMM mo del for the Diagonal band. 3.1 Mo del’s parameters Eac h of the HMM mo dels has a set of parameters θ = { a ij , π i , φ, σ } , which has to b e determined from the data. The parameters are the transition probabilities b etw een the t w o hidden states a ij , the initial probabilities in each state π i , and the v ariance parameters φ and σ of the emission densities, Laplacian and Gaussian, resp ectiv ely . The means of the emission densities are set to zero, following the sparsity hypothesis of the mo del. W e will tie the mo del for eac h pixel in the same band, considering all sequences of co efficients in eac h band as indep enden t observ ations of the same mo del. Thus for the sample of sequences of random v ariables W = { W ( x, y ) } (where W ( x, y ) = { W ( x,y ) 1 , . . . , W ( x,y ) T } mo del the noisy w av elet co efficien ts), our estimated parameters are the v alues that maximize P ( W | θ ): θ M L = arg max θ P ( W | θ ) , 3.1.1 EM algorithm for HMM parameter estimation W e will compute the parameters using the w ell known Exp ectation Maximization paradigm, th us w e will iterate un til con vergence the steps 6 Step E: compute the conditional exp ectation E z | X,θ ( n ) [ln ( P ( X , z | θ ))], Step M: maximize the ab ov e expression on θ . Theorem 3.1 The EM estimation scheme for our wavelet mo del c onsists on the fol lowing steps: in the ( n + 1) -th step, the forwar d and b ackwar d variables α ( x,y ) i ( t ) and β ( x,y ) i ( t ) , ar e c ompute d as α ( x,y ) i (1) = π ( n ) i f ( W ( x,y ) 1 | S ( x,y ) 1 = i ); β ( x,y ) i ( T ) = 1; α ( x,y ) i ( t ) = " X j α ( x,y ) j ( t − 1) a ( n ) j i # f ( W ( x,y ) t | S ( x,y ) t = i ) , t = 2 , .., T β ( x,y ) i ( t ) = X j a ( n ) ij f ( W ( x,y ) t +1 | S ( x,y ) t +1 = j ) β ( x,y ) j ( t + 1) , t = T − 1 , .., 1 , wher e i, j = e dge, no-e dge, r esp e ctively. The state pr ob ability variables, L and H , b e c ame: L ( x,y ) i ( t ) = α ( x,y ) i ( t ) β ( x,y ) i ( t ) P ( W ( x, y )) H ( x,y ) ij ( t ) = α ( x,y ) i ( t ) a ( n ) ij f ( n ) ( w t +1 | S ( x,y ) t +1 = j ) β ( x,y ) j ( t + 1) P ( W ( x, y )) ; wher e P ( W ( x, y )) = P j α ( x,y ) j ( t ) β ( x,y ) j ( t ) for any t . Thus the new p ar ameters θ ( n +1) ar e : π ( n +1) i = 1 n m X x,y L ( x,y ) i (1); a ( n +1) ij = P x,y P T − 1 t =1 H ( x,y ) ij ( t ) P x,y P T − 1 t =1 L ( x,y ) i ( t ) ; φ ( n +1) = √ 2 P x,y P T t =1 L ( x,y ) 1 ( t ) | W ( w,z ) t | P x,y P T t =1 L ( x,y ) 1 ( t ) σ ( n +1) = P x,y P T t =1 L ( x,y ) 0 ( t )( W ( x,y ) t ) 2 P x,y P T t =1 L ( x,y ) 0 ( t ) wher e n × m is the size of the image. The pro of of the theorem is left to App endix A. The EM algorithm is a lo cal descen t algorithm that can b e trapp ed in lo cal minim um, but as w e use it to construct an edge strength mask. W e need to v erify that the mask con tains the true edges of the image, even if it provides, as all statistical edge detectors do, thic k edges. 7 3.2 Sequence of hidden states Giv en the sequence of observ ed co efficien ts w = { w ( x, y ) } on a given image, and the estimated parameters ˆ θ of the mo del ov er the image, we are in terested in finding the optimal sequence of hidden states s ( x, y ) = { s ( x,y ) 1 , . . . , s ( x,y ) T } that explains w ( x, y ), for eac h pixel lo cation ( x, y ). That is to sa y , w e wan t to find the sequence s ∗ ( x, y ) for whic h s ∗ ( x, y ) = arg max s P ( s ( x, y ) | w ( x, y ) , ˆ θ ). s ∗ = arg max s P ( s | o, ˆ θ ) (1) Viterbi algorithm solv es this problem, (see Appendix B). W e apply this algorithm for eac h pixelwise sequence of co efficien ts, in the vertical and horizon tal band, using their respective estimated parameters, obtaining 2 × T binary maps of edge p ositions, T maps for each band, horizon tal and v ertical. 3.3 Edge strengh t Mask In Sun et al. (2004), strings of T lab eled co efficien ts pro duce a lab el “edge” only if they ha ve all the evidence in fav or of b eing an edge, that is, the string pro duced by a branch in the w av elet tree is an un broken sequence of E states. In our case, we compute the most likely state maps that may ha ve emitted the observ ed image, and decide that a pixel is a candidate to edge p oint if it is flagged as one in more than one half of the state maps of any of the directional bands considered. The final edge strength map has a constan t rate of false alarms but a lo w misclassification rate, so the second stage in edge detection, that is made usually with active contours, can successfully lo cate the real edges. 4 Exp erimen tal Results The appropriate noise mo del for sp ec kled images is the multiplicativ e one. W e apply the logarithmic transformation to obtain an image with the appropriate additiv e mo del, in order to consider Laplacian Gaussian mixtures as the correct emission distributions. Natural optical images with high v ariance Gaussian noise added are examples that fit the additive noise model and hav e edges on all scales, providing go o d challenge for our algorithm. Also, there are sev eral classical databases of images for edge detection which provide b enchmark images with ground truth. In Figure 3 w e sho w three different Ground T ruth images, made b y differen t p eople, that show the different scales that edges of natural images ha ve. The database was made adding seven levels of Gaussian noise, σ = 0 , 5 , 10 , 20 , 30 , 40 , 50, to the test images, do wnloaded form the Berkeley Database [13]. W e will compare our edge detector, WBND, with a simple but effectiv e wa v elet based thresholding scheme (HTHW), also based on the undecimated Haar w av elet transform, and Cann y edge detector, the usual c hoice among practitioners. The deterministic algorithm HTHW w as included to show the implicit p ow er for edge detection that the pro jection in 8 w av elet space p ossesses, and to show the reducing p erformance effect that noise pro duces on its detection capabilit y . In a second exp eriment, w e will work with several SAR images obtained from differen t sensors, sho wing different kinds of textures at differen t resolutions. W e will work with an ESAR PRI (high resolution SAR image) of ice land, pro duced to study seasonal p olyn y as, regions of op en water inside the Artic casquet, an ESAR VV three lo oks (mo derate resolution SAR image) of a region outside the city of Munic h, pro duced to study automatic generation of road maps, and finally , an ESAR full polarimetric complex image without an y pro cessing, with sev eral kinds of textures, from a coun try-side region of Germany , whic h has b een extensiv ely studied in other recen t edge detection prop osals, Giron et al. (2012). W e will b egin detailing the HTHW algorithm w e use for making the comparison’s sim ulation. 4.1 Hard Thresholding Haar w a v elet detector (HTHW) Man y w ell-known edge detectors, lik e Prewit, Rob erts, Sob el and Cann y , are based on the principle of matching lo cal image regions with sp ecific edge patterns. These edge patterns are in fact impulse resp onses of high-pass filters that suppress homogeneous and smo oth regions while emphasizing discontin uities. The edge detection is p erformed b y con volving the image with a set of directional patterns, follow ed b y thresholding, Kitanovski et al. (2009). W a v elet based edge detectors also inv olv e these ideas. W e implemen ted a simple edge detector thresholding the undecimated Haar w a velet decomp osition at the first lev el, whic h is roughly lik e computing the first deriv ativ e in three directions, horizontal, vertical and diagonal. W e lab el a pixel lo cation as edge if the maximum of the sizes of its related three co efficients surpass a given threshold. W e also k eep the information ab out the orien tation of the biggest co efficient to apply non-maximal suppression as Canny’s metho d do es. Our statistical algorithm, WBND, select the co efficients as b eing in the state “edge” or “no-edge” not only when their amplitude is large (as HTHW do es), but also when it is mo derately large but still has high probability of b eing pro duced by the “edge” emission distribution. 4.2 Initial v alue selection The thresholds for Canny and HTHW metho d are image dep endent, and chosen using the Pratt-qualit y curv es metho d discussed on F ernandez-Garcia et al. (2004). W e mov ed the parameters in a one dimensional fashion, 100 steps, and let the quality measures c ho ose the b est map. In the case of Cann y , we fixed the noise smo othing parameter to the default, and mov ed only the threshold, using the Matlab function “edge”. In the case of HTHW, there is only one parameter to mov e, since it does not ha ve a built-in smoothing pro cedure. Nev ertheless, we applied a median filter to the image b efore computing the edge map, in order to comp ete in a fair w ay with Cann y . 9 F or our metho d, WBND, w e choose non-informativ e priors for the state v alues, and transition probabilities that strongly p enalize the c hange from one state to the other. π (0) = [0 . 5 0 . 5] 0 , A (0) = [0 . 95 , 0 . 05; 0 . 2 , 0 . 8] . The initial v ariance parameters of the conditional emission distributions, φ (0) and σ (0) , were carefully chosen from histograms of the coefficients of eac h image. 4.3 Qualit y measures In this section we define three qualit y measures w ell known in the computer vision literature. These measures need ground truth maps to pro duce the comparison output, whic h are alw ays a v ailable when working with artificial images. 0 5 10 20 30 40 50 Canny WBND HTHW σ 0 5 10 20 30 40 50 original ground truth 0,6 0,7 0,8 0,9 PRA TT Figure 2: Edge maps of Building image with 7 lev els of noise added: σ = 0 , 5 , 10 , 20 , 30 , 40 , 50, made with Cann y , WBND and HTHW metho ds. On top, Pratt’s qualit y curv e o ver noisy images, for all three metho ds. The edge maps of Cann y and HTHW metho ds w ere selected b y Pratt measure, as the p eak of the curv e made mo ving the threshold parameter 100 times. The edge maps of WBND metho d w as the automatic output of the algorithm for eac h noisy input image. 10 4.3.1 Pratt’s quality measure Let us consider V the ground truth of an image I , and B another computed edge map ov er the same image, E V and E B the set of edge p oints of b oth maps and ρ b e the Euclidean distance. Thus, Pratt’s measure is defined b y P V ( B ) = 1 max { # E V , # E B } X s ∈ E B 1 1 + α ρ ( s, E V ) 2 with α = 1 9 . 4.3.2 Baddeley’s error measure Baddeley’s distance is defined by ∆ p ω ( V , B ) = " 1 nm X s ∈ E V | ω ( ρ ( s, V )) − ω ( ρ ( s, B )) | 2 # 1 / 2 . with ω ( t ) = min { t, 5 } . 4.3.3 Kappa’s quality measure The index Kappa is defined b y κ = P o − P e 1 − P e where P 0 is the observ ed prop ortion of edges and P e is the exp ected proportion of edges in the image, one computed o v er the estimated edge map B and the other computed o v er the ground truth map V . 4.4 Results on optical images W e compute 50 edge maps p er image sampling the parameter space of Canny and HTWD. W e add 7 lev els of noise to each of these images, and compute the distance from them to the Ground T ruth, generating a 100 p oin t quality curv e for each image. The edge map that mak es the maximum v alue ov er such curv e is the map c hose to comp ete with WBND. In Figure 3 and 2 w e plot the maxim um v alue of the measure (ov er the 100 edge maps) as a function of the noise level. In Figure 3 w e can see plots of the three qualit y measures as functions of sev en lev els of noise, computed o v er three images: a simple synthetic image, Star, and t wo natural images, Gian t and Building, with detailed hand made ground truth. The images has v ery differen t scaling b ehavior in their structural edge system. Star, the first panel of Figure 3, is a v ery simple artificial image, with v ery thin edges and no texture. The other tw o images were natural images that depict man made constructions, with edges in sev eral resolutions. 11 PRA TT BADDELEY KAPP A GROUND TRUTH 0 0,2 0,4 0,6 0 5 10 20 30 50 0,3 1 1,7 2,4 3,1 0,3 0,6 0,9 0 5 10 20 30 40 50 0 5 10 20 30 40 50 Figure 3: Quality curves of Cann y , WBND and HTHW metho ds, computed ov er edge maps of Star, Building and Gian t image with 7 lev els of noise added: σ = 0 , 5 , 10 , 20 , 30 , 40 , 50. The measures are Pratt’s qualit y measure, Baddeley’s error measure and Cohen’s Kappa qualit y measure. All these measures need knowledge of Ground T ruth to deliver an output. The p ositiv e qualit y measures, Pratt and Kappa, score maximum quality with the 1 v alue. Baddeley is an error measure, scoring maximum quality with zero. Keeping in mind these ideas, the measure curves hav e different interpretations from image to image. In general, with low level of noise, the optimized Canny found the b oundaries of the ob jects almost p erfectly , but with high level of noise, errors add up and quality worsens. The edges outside the boundary , as well as the texture, are not w ell resolv ed by Cann y’s method in an y image. This edge strength maps are the first step in b oundary and structure detection. The next step w ould b e to apply an activ e contour metho d to deliv er a one pixel wide, contin uous edge structure. In Figure 2 w e can see that WBND gives a strong set of lines to follo w. The other t wo metho ds give to o many false alarms outside the b oundary of the ob ject. W e should stress again that the maps shown are the b est maps c hosen b y the quality measures con trasting them against the Ground T ruth. T able 1 sho ws v alues of the three measures computed o ver edge maps of 9 images selected from the Berk eley database with the maxim um level of noise added, to sim ulate signal to 12 Pratt Baddeley Kappa BD Id Image HTHW Cann y WBND HTHW Canny WBND HTHW Cann y WBND 86000 building 0,427 0,529 0,629 1,908 1,734 1,757 0,098 0,173 0,222 119082 gian t 0,563 0,537 0,649 1,846 1,721 2,257 0,190 0,269 0,230 69015 k oala 0,454 0,494 0,606 2,298 2,177 1,985 0,077 0,172 0,281 187071 moun tain 0,391 0,488 0,655 1,740 1,911 1,459 0,109 0,204 0,307 24077 monk 0,508 0,473 0,558 2,031 2,153 2,605 0,133 0,139 0,177 42049 bird 0,517 0,473 0,928 1,235 1,182 0,795 0,342 0,391 0,606 106024 p enguin 0,262 0,327 0,476 1,584 1,682 2,051 0,094 0,155 0,229 300091 surf 0,311 0,436 0,745 1,141 1,347 0,921 0,153 0,227 0,423 108082 tiger 0,156 0,193 0,208 1,493 2,261 1,916 0,017 0,046 0,064 T able 1: Maximum qualit y measurements of edge maps made with images from the Berk eley segmen tation database, obtained by mo ving the parameters in a wide range as explained in F ernandez-Garcia et al. (2004). noise ratios similar to a SAR image. Qualit y v alues are computed referring to the most detailed segmentation that the Berkeley database can provide for the selected image, which is usually the b oundary of the main ob jects, with few details. W e selected pictures of animals with different textures, fur and feathers, pictures of landscap es and sea wa v es, and pictures of man made constructions, as buildings, statues and cars. WBND consistently sho ws b etter v alues than the other t wo metho ds. 5 Sar image data 5.1 ERS SAR PRI image data of Artic Ice In this section, we will apply our edge detector to a p ortion of a high resolution ERS SAR PRI image (25 m spatial resolution), VV p olarization, tak en on F ebruary 15, 1994, on the southern part of the coastal Artic, the F ranz Josef Land. This image of ice land includes a p olyn y a visible diagonally from the top left to the b ottom right of the image, see Dokk en et al.(2002) for details of the imagery and this imp ortan t en vironmen tal problem. A p olyny a is a geographical term for an area of op en water surrounded b y sea ice, i.e. unfrozen sea within the ice pac k. Kno wledge of the distribution and frequency of coastal p olyn y as and leads is imp ortan t in understanding large-scale climate pro cesses in the Arctic Basin. T raditionally , satellite passive microw a ve sensors are used for p olyn yas studies due to their temp oral and spatial cov erage. Due to the t ypical size of p olyny a features (on a v erage 6 km in width) a relativ ely high spatial resolution of the satellite sensor is required. The active syn thetic ap erture radar (SAR) enables high resolution imaging (25 m spatial resolution) of the geographic region of in terest during nigh t and da y and through the often-o ccurring cloud co ver ab ov e these features. In Dokk en et al. (2002), sev eral algorithms for segmen tation of 13 Artic ice images were compared with a new segmen ter, called the SAR p olyn ya algorithm, to delineate op en w ater, new ice, and y oung ice, and to define the size and shap e of p olyny as. This algorithm uses wa v elet pro jection in tw o different w ays, to reco ver texture signatures and to extract edges. Such a complex type of algorithm is v ery common in SAR pro cessing studies, since region detection in the images is v ery difficult. (c) WBND (d) Canny (a) (b) Figure 4: First ro w, panel (a), an ERS SAR PRI image taken on 15 F ebruary 1994 of the southern part of the F ranz Josef Land including a p olyny a diagonally visible from the top left to the b ottom righ t of the image. P anel (b) on the righ t, a small region of the top left part of the image. Second ro w, P anel (c) WBND edge map of the region selected, (d) Cann y’s edge map of the same selected region, with optimized parameter to reduce noise related artifacts. WBND final parameters hav e b een selected automatically b y the EM algorithm, initial parameters set with histogram quan tiles. Dokk en et al. (2002) suggest that enhancemen ts of the SAR p olyn ya algorithm could b e to com bine differen t image represen tations (e.g. curvelets and ridgelets) in order to improv e the delineation of y oung ice types inside the p olyny a region. W e may suggest replacing the last lo op of the algorithm, the deterministic w av elet based edge detection, b y our Hidden Mark ov Mo del approach based on our simulations, where w e clearly outp erform w av elet thresholding techniques using statistical mo dels. In Figure 4 we can see one of the images 14 studied in Dokken et al. (2002), with a the p olyn y a in it. In that image we selected a small region and computed Canny’s edge map and WBND edge map. W e can rep ort that our algorithm delineate the region of thin ice m uch b etter than Cann y’s algorithm, allowing a segmen tation of the region where the p olynia should lay . 5.2 ERS SAR image data from cit y In this section w e apply our algorithm to an ERS SAR image con taining urban and w o o dland areas. W e selected a 373 × 722 subimage, tak en from a 1500 x 4000 ERS-1, L band, HH p olarization image with an estimated num b er of lo oks equal to 2.95, corresp onding to Munic h, German y . In Figure 5 we sho w the image, and the resulting edge map estimating only one mo del for the whole piece. The image shows sev eral highw a ys and roads, which are reasonably w ell detected by the algorithm. Pixel resolution is low, around 100 square meters, since it w as av eraged three times to reduce sp eckle, so an accurate road map could only b e made p ostpro cessing the edge map with subpixel accuracy . Canny’s and Sob el edge maps ha ve thinner lines than the WBND edge map, but do not isolate the regions accurately . In Figure 5 w e can see a small p ortion of woo dland whic h was only w ell detected b y our prop osed algorithm. 5.3 F ull Polarimetric Complex ESAR imagery In the previous examples we w orked with images with only one p olarization band av ailable. In many cases, com bination of p olarization signatures is imp ortan t to reveal differences in texture, Mortin et al. (2012). In this section w e will w ork on a full p olarimetric E-SAR image that shows three different textures, agricultural land, cities and woo dland. The image considered is a ra w C 4 complex, E band SAR image from a zone near the cit y of W ebling, Ba yern, Germany . The image has 1499 × 4000 pixels, and sho ws a v ariety of textures and man-made constructions, as w e can see in Figure 6. W e divided the image in 16 pieces, in order to compute the map in a parallel implementation with the same initial parameters. In Figure 6 w e can see the whole map computed o ver the HH p olarization band of the image, and as we found out in the previous subsection, the cit y roads and w o o dland regions, corresp onding to heterogeneous and extremely heterogenous textures, w ere w ell detected by the algorithm. Cann y’s algorithm pro duces thinner edges than our’s, but misses a large part of the b oundary of heterogeneous regions. In Figure 7 w e can see another region selected in the original image, a piece of a long run wa y , and the same region remarked on Cann y’s and WBND edge maps. Non of the algorithms could detect that long runw ay . An explanation for this is that the logarithmic transformation considerably reduces the natural contrast of the HH image. In the t wo other examples w e ha v e sho wn, the images had a b etter resolution, so the logarithmic transformation did not diminish the detection p ow er of the algorithm. This image has three other p olarizations a v ailable, but it has not b een pro cessed to reduce sp eckle, has no n um b er of lo oks, so it is the noisiest product a v ailable. 15 woodland urban Sobel Canny WBND Figure 5: In the first row, HH band of an appro ximated 3 lo oks real ERS SAR image showing an urban area from the city of Munic h. In the second ro w, Sob el, Canny and WBND edge maps. W e hav e remark ed a w o o dland region that were well segmented by our algorithm, but that were not isolated by the other tw o detectors. W e selected the region of the runw a y we sho w ed in Figure7, in all polarizations av ailable, and re-run the algorithm. In the second column of the Figure 7, w e can see the run wa y found, in all images. Nevertheless, the runw a y is muc h b etter defined in the edge map corresp onding to VV p olarization. Nev ertheless, k eeping edges from all the different maps made with differen t p olarizations images increases noise in the final map, so com bination should b e made with a p enalization. Man-made constructions w ere w ell detected with HH p olarization images, lo w contrast regions (or natural homogeneous areas as the p olyny as), w ere b etter detected fine tuning VV p olarization regions, and VH ha ve not w ell defined edges. The prop osal of a full p olarimetric edge detector is b ey ond the scop e of this pap er, but the use of a multidimensional complex w av elet transform could b e the wa y to av oid the logarithmic transformation, main taining the contrast range of the image in all p olarizations. T o our b est kno wledge, no statistical model has b een fitted to the co efficients of a multidimensional complex wa velet transform, relating edge and no-edge states, and we are curren tly studying differen t transformations and algorithmic implemen tations, searc hing for the b est suited for 16 original WBND Canny Figure 6: First column, first panel, log-amplitud from the HH p olarization band of a E frequency band SAR image from a zone near the cit y of W ebling, Ba y ern, German y , 4000 × 1499 pixels, with an urban region selected. Second and third panels: WBND map of the whole image, computed in parallel fashion with the same initial parameters, and Cann y edge map computed with optimized parameters. Second column: enlarged image of selected region and WBND and Cann y’s edge maps. W e should notice that our prop osal generate closed thic k edges around regions, while Canny’s fail to close region b oundaries. edge detection. 6 Conclusion and Discussion In this w ork w e described a new approac h to edge map construction in SAR images using hidden Marko v Models on the undecimated wa velet domain. Most Hidden Marko v mo dels on the w av elet domain hav e b een defined for denoising applications, and they traditionally fa vor orthogonal transformations. F or edge detection, shift in v ariant transforms are b etter suited for the task than orthogonal ones, since redundance allo ws better edge lo calization and trac king along the wa v elet representation. Also, mo deling co efficien ts with a Laplacian- Gaussian mixture implies that an implicit denoising is taking place at the same time edge 17 HH polarization VV polarizati on HV polarizati on (e) (b) (c) (a) (d) (f) Figure 7: First column, first panel, log-amplitud from the HH p olarization band of a E frequency band SAR image from a zone near the cit y of W ebling, Ba y ern, German y , 4000 × 1499 pixels, with a region of a low con trast run wa y selected. First column, second and third panel: WBND map of the whole image, computed in parallel fashion with the same initial parameters, and Cann y’s edge map made with optimized parameters. Second column: HH-band, VV-band and VH band region of the runw ay , after histogram equalization, and related WBND edge map, in that order. related co efficien ts are selected. This explains the reason why our algorithm main tains a go o d p erformance in our sim ulations when Gaussian noise with high v ariance w as added. Our algorithm is based on mo deling the co efficients of three consecutiv e lev els of the horizon tal and v ertical detail bands of the undecimated w a velet transform with a three step Mark ov c hain with tw o p ossible hidden states, “edge” and “no-edge”, which jointly fit a Laplacian-Gaussian mixture with zero mean. This tw o indep endent mo dels conformed a reduced Bay esian Net on the undecimated w av elet domain, which is simple but effective in capturing the t wo main prop erties of edge related wa v elet co efficients, p ersistence and non gaussianit y . The final edge map is pro duced com bining the most likely sequence of states giving the estimated mo dels, keeping all v ertical, horizon tal and corner edges. W e inv estigated the p erformance of a deterministic wa velet thresholding detector, and the 18 w ell-known Canny edge detector along with our WBND algorithm for edge detection in b oth syn thetic images and natural images with a v ailable ground truth. F rom the exp erimen tal results on the artificial image, it was observ ed that Cann y detector p erformed slightly b etter than WBND and HTHW when mo derated Gaussian noise was added, and that our metho d had an increasingly b etter p erformance when higher levels of noise w ere added. The p erformance w as measured using Pratt’s, Baddeley and Kappa classical qualit y measures. On natural images with considerably more edges at differen t resolution sizes than syn thetic images, our WBND detector app eared to b e the most robust to v ariations in noise, p erforming w ell in all noise configurations tested. W e also rep ort resulting edge maps on three different resolution and p olarization SAR images: a VV p olarization high resolution ERS SAR PRI image of iced land, an HH p olarization L frequency ERS image with three lo oks of a region outside the cit y of Munic h, and a low resolution SRC raw complex image, the noisiest kind of pro duct, with the HH, VV and VH bands a v ailable. Edge detection was successful in all extremely heterogeneous textured regions, but the logarithmic transformation flatten the contrast on the SR C image, in tro ducing detection errors in the homogeneous regions. Increasing contrast on homogeneous regions, and considering all p olarizations, we can rep ort that edge maps were b etter formed on the VV band than on the HH band, and com binations of the t w o edge maps resulted in v ery noisy outputs. The prop osal of a full p olarimetric edge detector is b eyond the scope of this pap er, but the use of the undecimated or stationary complex wa v elet transform could b e the wa y to a void the logarithmic transformation, main taining the con trast range of SR C images. W e are aw are of Choi et al. (2002) work on Hidden Mark ov T rees mo del for Kingsbury’s dual complex wa velet transform, but to our b est kno wledge, no statistical mo del has b een fitted to the coefficients of the complex w a velet transform of a multidimensional complex image, relating edge and no-edge states, and w e are curren tly studying differen t transformations and algorithmic implementations, searching for the b est suited transform for edge detection. References [1] Argen ti, F., Bianc hi, T., Lapini, A.; Alparone, L., 2012. F ast MAP Desp eckling Based on Laplacian Gaussian Mo deling of W av elet Coefficients. IEEE Geoscience and Remote Sensing Letters, 9(1), 13–17. [2] Bianc hi, T.; Argenti, F.; Alparone, L., 2008. Segmentation-Based MAP Desp ec kling of SAR Images in the Undecimated W av elet Domain, Geoscience and Remote Sensing, IEEE T ransactions on, 46(9), 2728–2742. [3] Choi, H., Romberg, J.; Baraniuk, R.; Kingsbury , N., 2002. Hidden Mark ov tree mo deling of complex wa v elet transforms. Acoustics, Sp eech, and Signal Pro cessing, 2000. ICASSP ’00. Pro ceedings. 2000 IEEE In ternational Conference on, 1, 133–136. 19 [4] Crouse, M., Now ak, R. and Baraniuk, R., 1998. W a velet-based statistical signal pro cessing using hidden Mark o v mo dels, IEEE T rans. Signal Pro c., 46(4), 886–902. [5] Dokk en, S., Winsor, P ., Markus, M.,Askne, J., Bjork,G., 2002. ERS SAR characterization of coastal p olyn yas in the Arctic and comparison with SSM/I and numerical mo del in vestigations. Remote Sensing of En vironment, 80, 321 - 335. [6] F ernandez-Garcia, N., Medina-Carnicer,R., Carmona-P oy ato, A., Madrid-Cuev as, F., Prieto-Villegas, M., 2004. Characterization of empirical discrepancy ev aluation measures, P attern Recognition Letters, 25, 35–47. [7] Giron, E., F rery , A.C., Cribari-Neto, F., 2012. Nonparametric edge detection in sp ec kled imagery , Mathematics and Computers in Simulation, in press. [8] Guang, B., Sun, H., 2005. T urb o Iterative Estimation of State Parameters in W av elet- Domain Hidden Marko v Mo dels of SAR Image. Acta Electronica Sinica ,33(6), 1039–1043. [9] Gy aourov a, A., C. Kamath, and I. K. F o dor, 2001. Undecimated W a v elet T ransforms for Image De-Noising, LLNL T echnical rep ort, UCRL-ID-150931. [10] Guo, H., 1995. Theory and Applications of the Shift-In v ariant, Time-v arying and undecimated wa velet transforms. Master Thesis. Rice Universit y . [11] Joshi, D.; Jia Li; W ang, J.Z., 2006. A computationally efficient approac h to the esti- mation of t wo- and three-dimensional hidden Marko v mo dels. Image Pro cessing, IEEE T ransactions on, 15(7), 1871– 1886. [12] Kitano vski, V., T ask ovski, D., P anovski, L., 2008. Multi-scale Edge Detection Using Undecimated W a v elet T ransform. ISSPIT 2008, 385 - 389. [13] Martin, L., F owlk es, C., T al, D., Malik, J., 2001. A Database of Human Segmented Natural Images and its Application to Ev aluating Segmen tation Algorithms and Measuring Ecological Statistics, Pro c. 8th Int. Conf. Computer Vision, 2, 416. [14] Mortin, J., Sc hro der, T., Hansen, A., Holt, B. and McDonald, K., 2012. Mapping of seasonal freeze-thaw transitions across the pan-Arctic land and sea ice domains with satellite radar, J. Geoph ysical Res. Oceans, in press. [15] Rabiner, L., 1989. A tutorial on hidden Marko v mo dels, Pro c. IEEE, 77(2), 257–286. [16] Rom b erg,J., Choi, H., Baraniuk, R., 2001. Bay esian T ree-Structured Image Mo deling Using W av elet-Domain Hidden Mark ov Mo dels IEEE transactions on image pro cessing, 10(7), 1056–1068. [17] Starc k, J., F adili,J., and Murtagh, F., 2007. The Undecimated W a v elet Decomp osition and its Reconstruction. IEEE transactions on image pro cessing, 16 (2), 297–309. 20 [18] Sun, J., Gu, D., Chen,Y., Zhang,S., 2004. A multiscale edge detection algorithm based on wa v elet domain vector hidden Mark ov tree mo del. Pattern Recognition, 37, 1315 – 1324. [19] T ello Alonso, M.; Lop ez-Martinez, C.; Mallorqui, J.J.; Salembier, P ., 2011. Edge En- hancemen t Algorithm Based on the W a velet T ransform for Automatic Edge Detection in SAR Images. Geoscience and Remote Sensing, IEEE T ransactions on, 49(1),222–235. [20] Zhang, R., Ouyang, W., Cham, W.K., 2009. Image multi-scale edge detection using 3-D hidden Marko v mo del based on the non-decimated w av elet. Pro ceeding ICIP’09, 2149–2152. 21
Original Paper
Loading high-quality paper...
Comments & Academic Discussion
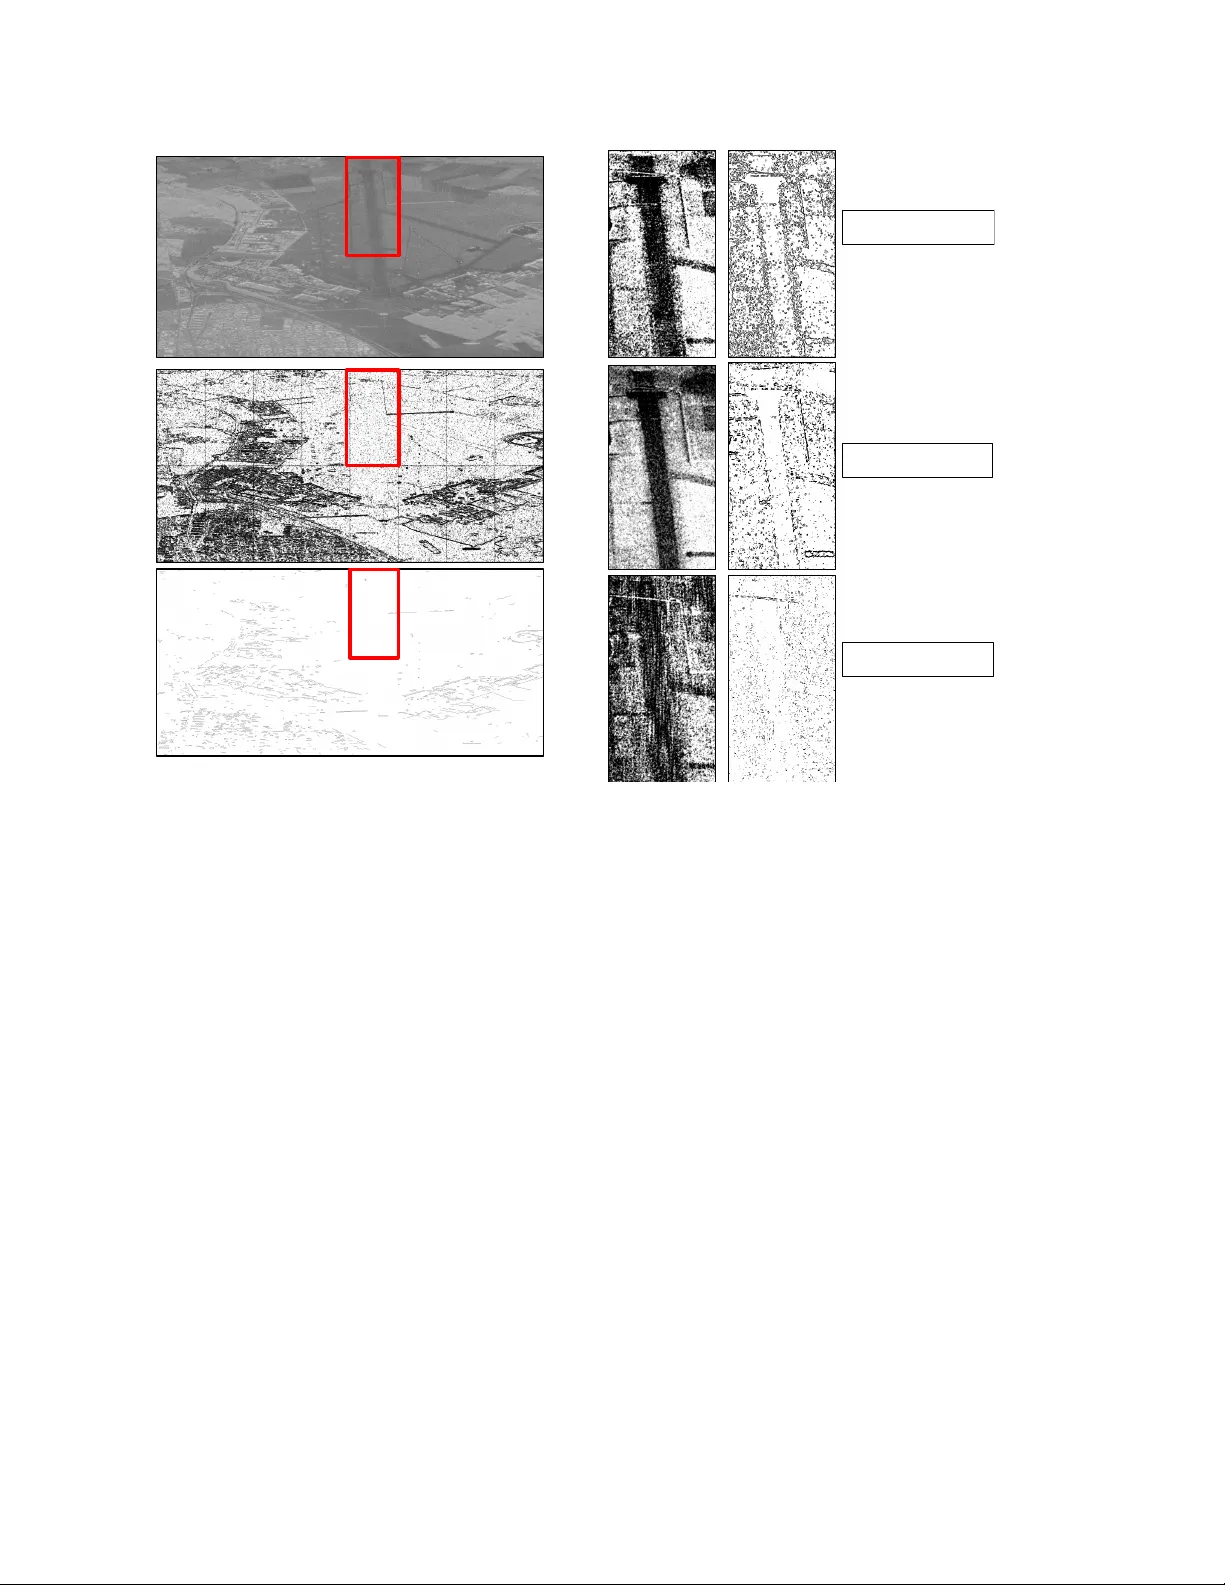
Loading comments...
Leave a Comment