A Framework for Reproducible, Interactive Research: Application to health and social sciences
The aim of this article is to introduce a reporting framework for reproducible, interactive research applied to Big Clinical Data, based on open source technologies. The framework is constituted by the following three axes: (i) data, (ii) analytical …
Authors: Joao Ricardo Nickenig Vissoci, Clarissa G. Rodrigues, Luciano de Andrade
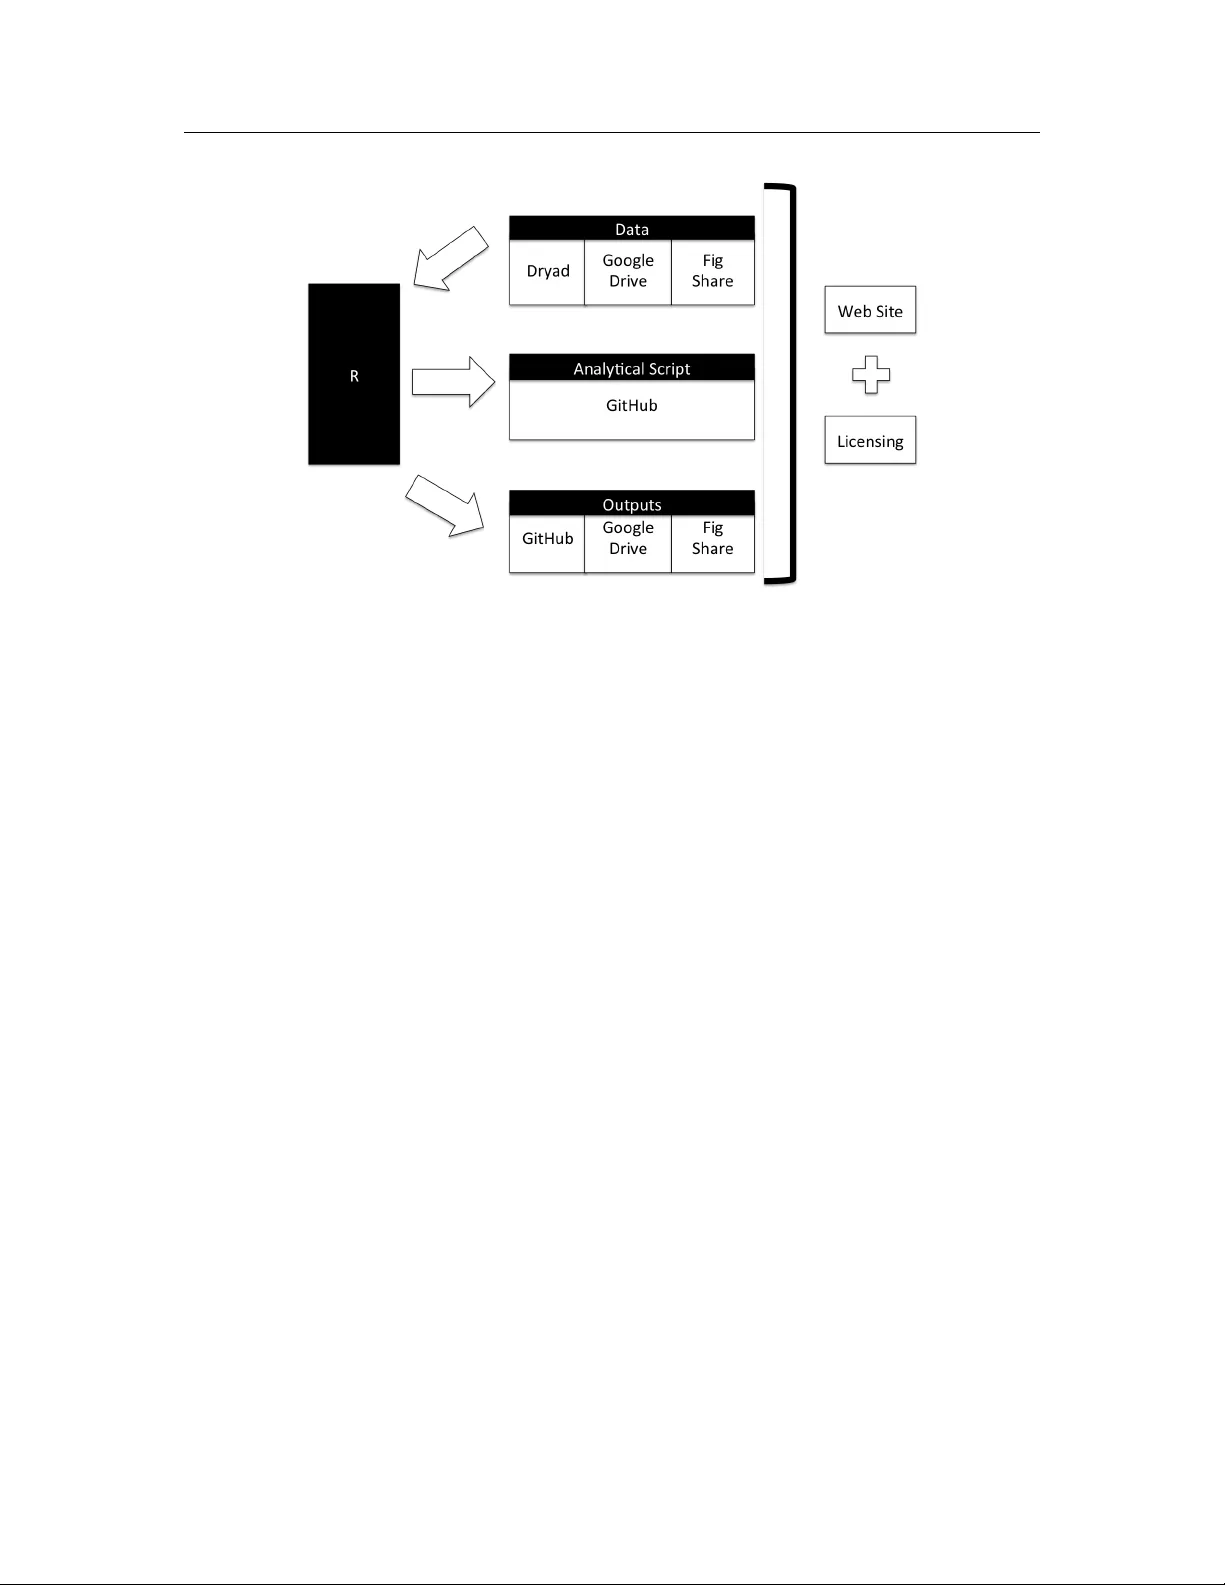
Framew ork for Reproducible Research • April 2013 A Framew ork for Reproducible, Interactiv e Research: Application to health and social sciences Joao Ricardo Nickenig V issoci 1 , Clarissa G. Rodrigues 2,3 , Luciano de Andrade 4 , Jose Eduardo Santana 5 , Amrapali Za v eri 6 , and Ricardo Pietr obon 2 1 Inga College - Medicine Department 2 Duke Univ ersity Medical Center , {jnv4, clarisa.rodrigues, rpietro}@duke.edu 3 Instituto de Cardiologia do RS, Fundacao Univ ersitaria de Cardiologia, Rio Grande do Sul, Brazil 4 Univ ersidade Estadual do Oeste, do Parana, Brazil, luciano.andrader@unioeste.br 5 Instituto de Computação, Univ ersidade Federal de Alagoas (UF AL), Alagoas, Brazil, jes@ic.ufal.br 6 Univ ersität Leipzig, Institut für Informatik, D-04103, Leipzig, Ger many , za v eri@infor matik.uni-leipzig.de April 2, 2019 Abstract The aim of this article is to introduce a reporting framework for reproducible, interactive research applied to Big Clinical Data, based on open source technologies. The framework is constituted by the following three axes: (i) data, (ii) analytical codes and (iii) dissemination. In this paper , differ ent documentation formats and online repositories are introduced. T o integrate and manage the repr oducible contents, we propose the R Language as the tool of choice. All the information is then published and gathered in a website for different projects. This framework is free and user friendly and is proposed to enhance reproducibility of health-science reports. 1. I ntrod uction W i th the gro wing amount of data in healthcare, the ability to analyze large datasets and report results ad- equately has become a key factor of research and inno vation [ 1 ], which supports the creation of new technologies and impro ved clinical de- cision making. The increased complexity of these datasets brings together difficulties and new challenges in ter ms of data management, modeling and communication. Therefore, in- v estigators are now focusing on dev eloping reproducible research protocols including en- tirely repr oducible data analysis. It implies that the results reported in a publication can be immediately reproduced b y granting access to both the datasets as well as the statistical and data mining scripts of the study [2] In order to make the infor mation widely us- able, the value of data collection, analysis and communication as well as the use of common 1 Framew ork for Reproducible Research • April 2013 standards for sharing infor mation hav e been recognized. In addition to increasing dissem- ination and better understanding of research findings, data sharing can also support confir- mation or refutation of research b y allowing replication and increased transparency of re- sults [2, 3] Ho w ev er , data sharing does bring some implementation challenges and possible risks. Potential inv asion of participants privacy and breaking of patients confidentiality ar e primar y concerns when making datasets public. S ec- ondly , adequate data management, academic and commercial primacy , and intellectual prop- erty rights as w ell as journal cop yrights are factors to be careful with while publishing data [ 3 ]. In this context, the use of an ade- quate framew ork becomes essential to allowing reproducible research without compromising such aspects, specially when analyzing and reporting results from large datasets. Thus, the aim of this article is to introduce a simple reporting framew ork for reproducible, interactive research applied to health and social scienc. The framew ork is constituted by the follo wing three axes: (i) data (S ection 2.1), (ii) analytical codes (S ection 2.3) and (iii) dissem- ination (S ection 2.6). In this paper , different documentation for mats and online repositories are introduced. T o integrate and manage the reproducible contents, we propose the R Lan- guage as the tool of choice. All the information is then published and gathered in a website for different projects. This framew ork is free and user friendly and is proposed to enhance reproducibility of health-science reports. 2. R eprod ucible R esearch F ramework The framew ork proposed in this paper is based on the concept that an appropriate repro- ducible r esearch report should allow one to totally reproduce the methods applied. Thus, w e understand that besides making the analyt- ical data, code and figures av ailable, an ade- quate reproducible research framew ork should integrate tools and features in a w a y that others could reach the same results and understand the process behind it. Therefore, in order to achiev e an adequate integration betw een data, codes and outcomes (figures, tables, numerical results and others) in our framew ork, we utilize the R Language [ 4 ] as the central tool. R has the ability of integrat- ing and managing dif ferent data formats, codes and for mats. In addition, it allows communi- cation with sev eral other analytical softwar es such as SAS, Stata and SPSS [5, 6, 7]. 2.1 Data for mats The first issue about making a research proto- col reproducible is the data management pro- cess. There are sev eral wa ys of storing data and many different data for mats. In our per- spectiv e, some of them are better by allowing integration with data analysis softwares and online repositories as well as their ease of use. In the follo wing sections, w e demonstrate some of these formats we hav e been using and their integration with our reproducible Framew ork. 2.1.1 Reproducible Data When making datasets publicly av ailable, one must be concer ned with the infor mation that is going to be made public. In this context, the Health Insurance Portability and Accountabil- ity Act (HIP AA) dev eloped a section on Pro- tected Health Information (PHI), which means that individually identifiable health informa- tion must be kept confidential when sharing data in healthcare. The complete list of PHI can be found at the Health and Human S ervices US Department [8] Secondly , it is important to make sure that the data is coded with appropriate names that allo ws other people to read and understand the content easily . T o make it easier , w e strongly en- courage the publication of a complete and orga- nized data dictionary together with the dataset, containing v ariable labels, r espectiv e code, data characteristics (continuous, discrete, ordinal, dichotomous, etc.) and any other source of rel- ev ant infor mation (e.g. length of Likert scale, categorization factors). 2 Framew ork for Reproducible Research • April 2013 2.1.2 CSV Comma separated values (CSV) is a format readily av ailable for consumption by any data analysis language or softwar e. Ho w ev er , it does not provide a w a y to update the data once it is downloaded other than downloading the dataset again. In addition, the CSV format does not offer any security features. On the other hand, CSV files hav e one of the best usability experiences among all the formats and it can be easily integrated with R using online repositories (i.e. Google Driv e or Dr y ad) through different R packages. One such package is the RCurl package [ 27 ], which can integrate R with different HTML domains, among them a .csv spreadsheet from Google Docs. 2.1.3 RDF , LOD and SP ARQL endpoints Semantic W eb technologies ha ve recently be- come popular giv en the success pro vided by Linked Open Data (LOD) [ 10 ]. The data is rep- resented with the help of the Resource Descrip- tion Framew ork (RDF) format, while data sets themselv es are queried through the SP ARQL (a recursiv e acronym for SP ARQL Protocol and RDF Query Language). Main advantages in- clude the data a v ailability 24/7 with automated updates and also the ability to dynamically merge across data sets sharing identical ele- ments (classes or instances). RDF data can be easily integrated with R Analytical codes through the RRDF pack- age [ 11 ]. This package allows users to perfor m SP ARQL queries inside R’s workspace. In addi- tion to this package mentioned there is a whole set of tutorials and packages that can be used within R [4]. 2.1.4 JSON Ja vaScript Object Notation (JSON) is consid- ered on of the best data-interchange formats. It is a text format with conv entions familiar to sev eral programming languages such as C++, Ja va, Jav aS cript and Python. More infor mation and specifications about ho w to integrate JSON data with specific ap- plications can be found at [ 12 ]. It’s connection with R analytical code is executed through the rjson package [ 13 ] which conv erts JSON objects into R objects. 2.2 Data repositor ies After deciding a for mat of data to be used, it is also mandatory to use an online repository to store the data and integrate it with the analyti- cal codes (discussed later in S ection 2.3). In the follo wing sections, w e present some options of free repositories that are used by our group. 2.2.1 Dr y ad Dryad [ 14 ] is an inter national repository spe- cific for data related to scientific publications. It allo ws data to be deposited easily and readily pro vides the citation related to the respectiv e publication. Dr y ad can be integrated with R, thus impro ving interoperability [15]. 2.2.2 Figshare Figshare [ 16 ] is an online repository , similar to Dr y ad, that allows researchers to choose a publication with the ability to be cited within the paper . Additionally , Figshar e supports not only data but also other types of research outputs such as figures, datasets, media files, papers, posters or ev en file sets with dif ferent types of documents. A major advantage of Figshare is its ability of easily sharing and discov ering information about different research projects. W e hav e used Figshare to publish datasets (in .csv formats) as w ell as figures. Examples can be found in [ 17 , 18 ]. In addition, Figshare can also be integrated with R through some pack- ages [19]. 2.2.3 Google drive Google Driv e is another online repository which facilitates collaboration and sharing of files [ 20 ]. This application from Google inte- grates texts, spreadsheets, presentations and 3 Framew ork for Reproducible Research • April 2013 other editors from Google (i.e. Google Docs, Google Sheets, Google For ms and others) and also allo ws the user to store forms, dra wing, and different types of files in the cloud. Google Driv e is extensiv ely used to share data, codes and other outputs among re- searchers in our group [ 21 ]. One example to connect data stored in Google Driv e with R is the RCurl package . This package allows users to compose general HTTP r equests and call URLs and other w eb for mats, such as datasets in .csv format. Another w ay is to simply open the files stored in Google Driv e (Spreadsheets or R-S cripts, for example) inside R, through RStudio [22]. In addition, w e also use Google Driv e as a wa y to integrate and facilitate collaborative writing and coding in R, since this approach has been found more user friendly to content researchers than other more sofisticated reposi- tories. 2.3 Analytical scr ipts Publishing analytical codes is an important step in a reproducible framew ork besides the connection betw een the codes and the data. Therefore, w e demonstrate here the different softw are that can be used to generate, publish and manage the analytical codes. 2.3.1 R Language Statistical Software As mentioned before, R [ 4 ] is the central tool of our reproducible research framew ork. As a definition, R is an open source software for statistical analysis and graphic creation. It has been dev eloped by a v ast community of collab- orators from sev eral countries and institutions. Although R is not superior to other statisti- cal softwares in ev ery aspects (such as intuitive GUI interface, or pre-defined operations), it gathers qualities which makes it a better op- tion to our framew ork than other statistical environments. One major advantage of R is its collaborativ e function in the dev elopment of packages. R has a huge library [ 4 ] (Comprehen- siv e R Archiv e Netw ork - CRAN) of packages for statistical analysis, graphic creation, data mining and management, and integration with other softw ares and programming languages. This collaborativ e ability , besides making R a pow erful analytical environment, makes it assume a position in our framew ork as a glue for other languages and technologies such as Python, Ja va, relational databases, RDF , C, C++, W eka, among many others. This wa y w e can gather data and data storage tools, analytical coding and repositories for outputs, making a research project fully reproducible. In addit- tion, R has being used by a large community , and has a lot of references to lean on. In our group we opt to run R through RStu- dio [ 22 ]. This platfor m is also open source and is an integrated environment that helps to vi- sualize the different R interfaces (workspace, graph, scripts and log). Other than that, it fa- cilitates the management of multiple working directories through the definitions of projects. 2.3.2 Reproducible Scripts As suggested by Hadley in his github reposi- tory [ 23 ], the idea is to create a code that can be recreated just b y cop ying the codes w e publish online. Therefore, each code must be connected to the dataset and contain all the infor mation needed to be performed. The elements of a reproducible script in R include the required packages, connection to the data, codes and codes descriptions. Each function in R is called upon a package where it is nested. So, for any one else to be able to reproduce our codes, she must hav e all the packages installed. Regarding the data, w e hav e already dis- cussed earlier the possible for mats and wa ys to publish it. It is notew orthy that the data must be aligned with the codes. This means that all the variables must be named exactly with the names used in the codes. Also, ev ery data man- agement infor mation must be inserted in the codes so that whoev er is tr ying to reproduce it might reach the same results. Finally , each line must ha v e a description of its pur pose and use. 4 Framew ork for Reproducible Research • April 2013 2.3.3 Github Github [ 24 ] is an online repository built to fa- cilitate the collaborativ e writing of computing codes. It not only allows the sharing of codes but facilitates collaboration through the copy (hereb y called "fork" ) of project pages in a safer w ay , regarding the original code. Among all the qualities of using Github as a reproducible strategy in the analytical coding process, w e highlight its strong connectivity with R. It al- lo ws not only the sharing and management of codes in w ebsites, but also simulates R outputs with kntir [25]. There are se v eral possibilities of using R integrated with Github. W e hav e been using Github mainly to: • publish analytical R-S cripts • promote collaboration among our data analysts when creating or debugging data analysis • generate automatic data reports for open design projects • create templates for data analysis (hereby called data analysis toolbox) with expla- nation of the methods (using wiki pages) and description of codes and outcomes. 2.4 Dynamic research In order to ha ve a complete reproducible script and also to facilitate data dissemination and visualization, it is important to obtain auto- mated and dynamic representation of tables, figures and reports. R allows the creation of analytical codes that generates automated re- ports, such as the knitr package [ 25 ], which translates the analysis into an HTML report (or other formats such a PDF). In summar y , this package translates the code into a report mixing Latex and markdown languages. An example of its application can be found in our Github repository [ 26 ] for the, Glocal Open De- sign Collection project. In this specific project w e used knitr associated with a R code to gen- erate an automated report about data quality and associations. Another wa y of using R to generate dy- namic research is b y dev eloping interactiv e graphs. These are graphs that might be cus- tomized or modified b y the user (research subject, patient or any other stakeholder) to get different slices of the dataset. R has sev- eral w ays of generating interactiv e graphs. Here, w e w ould like to introduce rggobi and Shiny [ 27 , 28 , 29 ]. How ev er , there are options that can be found at the CRAN task view for dynamic graphs [30] 2.5 Licensing Since all the documentation we are using is going to be made public we need to assure that its use is cov ered by a license. This will assure that any use other than that allow ed by the license, is not perfor med by the users. This is fairly important due to the relev ance of the information being made public. In our frame- w ork, w e hav e used Creativ e Commons, which is a free copyright license framew ork [31]. Inserting a line regarding the licensing char- acteristics in each of the documents in a project is sufficient to specify the type of license. The licensing assures the need for appro val from the cop yright owner . Basically , w e allo w the user to share and adapt the specific parts of the project. The only restriction is that the user must attribute the documents to the original authors and must use it only for noncommer- cial purposes. Examples of licenses are: This code is li- censed under a Creativ e Commons Attribution - Noncommercial 3.0 Unported License. Y ou are free: to Share - to copy , distribute and trans- mit the work, to Remix - to adapt the work, under the follo wing conditions: Attribution - Y ou must attribute the w ork in the manner specified by the author or licensor (but not in any w a y that suggests that they endorse y ou or y our use of the work). Noncommercial - Y ou may not use this w ork for commercial pur- poses. W ith the understanding that: W aiv er - Any of the abov e conditions can be w aived if y ou get per mission from the cop yright holder . Public Domain - Where the work or any of its 5 Framew ork for Reproducible Research • April 2013 elements is in the public domain under appli- cable la w , that status is in no wa y affected by the license. Other Rights - In no wa y are any of the following rights affected by the license: Y our fair dealing or fair use rights, or other ap- plicable cop yright exceptions and limitations; The author ’s moral rights; Rights other per - sons ma y ha ve either in the w ork itself or in ho w the w ork is used, such as publicity or pri- v acy rights. Notice - For any reuse or distribu- tion, y ou must make clear to others the license terms of this w ork. The best wa y to do this is with a link to this w eb page. For more details see http://creativecommons.org/licenses/ by- nc/3.0/ [31] 2.6 Data Dissemination and Com- munication Other than discussing methods and tools to make a research reproducible, we also believ e that it is important to include a facilitation of the data communication and dissemination. This will not only allow users to access the re- search project but will also catalyze the reach and dissemination of the respectiv e projects. In order to disclose and gather all the ma- terial from our groups’ research projects that w as made public, we created w ebsites (using Google Sites [ 32 ]) for each of the projects where w e included links to data repositories, code repositories and inserted reports and graphs. Any w eb design tool can be used but our choice for Google Sites is based on its free access and user friendly interface. An example is the Observer Agreement w ebsite which inte- grates all the reproducible documentation for our researchers with observer agreement about orthopedic scales projects [33]. 2.7 Ov erall workflo w Summaryzing the infor mation discussed, we created a simple graphical demonstration of the frame work’s conception (Figure 1). As men- tioned before, R Languge software gets a high- lighted position in the framew ork’s model. S o R is used to manage and coordinate the docu- mentation. Data is stored in open access online repositories,in a R supported for mats that will allo w the connection betw een data and analyt- ical code. The analytical codes are dev eloped within R interface and stored in a open access online r epositiry . Outputs generated b y the codes are also stored in open sourced online repositores. All this infor mation is licensed and integrated in a w ebsite for the research project. 3. D iscussion In this study we aim to introduce a report- ing framew ork for reproducible and interac- tiv e research, based on technologies and meth- ods applied to some of the recent projects in our research group (RoR). S e veral tools w ere described to publish datasets and analytical codes, all centered and managed by the R Lan- guage Software. The concept of our framew ork w as ini- tially based on some guidelines already pub- lished [ 34 , 35 ]. Not many reports can be found in the literature on the use of reproducible research framew ork in healthcar e. S ome re- searchers do publish their datasets or codes, but generally they are published separately . In our framew ork we tried to approach different aspects of reproducibility , rather than just the data, that is connectivity [ 36 ], dissemination and licensing with a framew ork that is consti- tuted of free and friendly technologies, facili- tating replication and improving transparency of results. Some of the tools we show cased here ha ve been extensiv ely discussed and used for the dev elopment of projects b y many inv estigators. Github, for instance, has been extremely used b y data analysts and programmers, as w ell as Dyrad and Figshare, giv en the increased amount of data being stored in clouds. Ho w- ev er , this advances hav e not been observed as often in healthcare research, specifically when it comes to Big Clincal Data and replication of health researches protocols [3]. Although our proposed framew ork is still in progress and needs to be improv ed, we em- 6 Framew ork for Reproducible Research • April 2013 Figure 1: Depiction of the reproducible resear ch framework. phasize its ability not only for sharing data and codes in a safe w ay , but also connecting and disseminating information through free and user friendly technologies. W e believ e that only by sharing and comparing methods a con- sensus of framew ork can be created. Therefore, this model proposed can help tow ards the stan- dardization of reproducible research protocols in healthcare, aggregating value not only for research, but also for innov ation and clinical practice. R eferences [1] Maniyka J, Chui M, Brown B, Bughun J, Dobbs R, Roxburgh C, Byers AH (2011).Big data: The next frontier for in- no v ation competition, and productivity . McKinsey and Company . A vailable: http: //www.mckinsey.com/insights/ business_technology/big_data_ the_next_frontier_for_innovation . Accessed 18 April 2013. [2] Peng RD, Dominici F , Zeger SL (2006). Reproducible epidemiologic resear ch. Am J Epidemiol. Ma y 1;163(9):783-9. [3] Gro ves T , Godlee F (2012). Open sci- ence and reproducible research. BMJ. Jun 26;344:e4383. A v ailable: doi:10.1136/ bmj.e4383. . Accessed 18 April 2013. [4] R-project contributors. The R Project for Statistical Computing. A vailable: www. r- project.org, 2013 . Accessed 18 April 2013. [5] IBM. SPSS Software .A v aliable: http://www- 01.ibm.com/software/ analytics/spss . Accessed 18 April 2013. [6] SAS Institute Inc. Statistical Analysis Sys- tem - SAS. A vailable: http://www.sas. com .Accessed 18 April 2013. [7] StataCorp LP .Stata: Data analisys and statistical softw are. A v ailable: www. stata.com .Accessed 18 April 2013. [8] Health Infor mation Privacy and Secu- rity (HIPP A).A vailable: http://www.hhs. gov/ocr/privacy/hipaa . Accessed 18 April 2013. [9] Lang DT (2013). Package ’RCurl’. A v ailable: http://cran.r- project. org/web/packages/RCurl/RCurl. pdf .Accessed 18 April 2013. 7 Framew ork for Reproducible Research • April 2013 [10] Linked Data. A v ailable: http: //linkeddata.org . Accessed 18 April 2013. [11] W illighagen E (2013). Package ’rr df ’. A v ailable: http://cran.r- project. org/web/packages/rrdf/rrdf.pdf Accessed 18 April 2013. [12] Ja vaScript Object Notation (JSON). A v ail- able: www.json.org . Accessed 18 April 2013. [13] Couture-Beil A (2013). Package ’rjson’. A v ailable: http://cran.r- project. org/web/packages/rjson/rjson.pdf . Accessed 18 April 2013. [14] Dryad Digital Repository .A vailable: datadryad.org . Accessed 18 April 2013. [15] Chamberlain S, Boettiger C, Ram K (2013). Package ’rdryad’. A v ail- able: http://cran.r- project.org/ web/packages/rdryad/rdryad.pdf . Accessed 18 April 2013. [16] Figshare.A v ailable: http://figshare. com/ . Accessed 18 April 2013. [17] Moreira T , Y en T , V issoci JRN, Barros T , Ejnisman L, Massa B, Pietrobon R, V ail TP (2013).T otal Hip Arthoplasty Compli- cations Prev alence Meta-analysis at 5, 15 and 20 years followup.A v ailable: http: //dx.doi.org/10.6084/m9 .Accessed 18 April 2013. [18] Dal Ponte T , Pessin DV , Gambeta CE, Fer- reira APB, Braga L, V issoci JRN, Braga- Baiak A, Gandhi M, Pietrobon R. (2013) The reliability of AO classification on femur fractures among orthopedic r es- idents. A vailable: http://dx.doi.org/ 10.6084/m9 . Accessed 18 April 2013. [19] Boetinger C, Chamberlain S, Ram K, Hart E. (2012). Package ’rfigshare’. A v ailable: http://cran.r- project.org/web/ packages/rfigshare/rfigshare.pdf . Accessed 18 April 2013. [20] Google Driv e. A vailable: https://drive. google.com/ . Accessed 18 April 2013. [21] Research On Research and Inno v ation (ROR).A v ailable: https://sites.google.com/site/ researchonresearchtech/home . Ac- cessed 18 April 2013. [22] RStudio Inc (2013). A vailable: www. rstudio.com . Accessed 18 April 2013. [23] W ickham H (2013). Repro- ducibility . A v ailable: https: //github.com/hadley/devtools/ wiki/Reproducibility . Accessed 18 April 2013. [24] Github. A v ailable: https://github. com/ . Accessed 18 April 2013. [25] Xie Y . (2013). knitr: Ageneral-purpose package for dynamic report in R. A vail- able: https://github.com/hadley/ devtools/wiki/Reproducibility . Accessed 18 April 2013. [26] Glocal Registr y project in Github. A v ail- able: https://github.com/rpietro/ GlocalRegistry . Accessed 18 April 2013. [27] Lang DT , Swa yne D, W ickham H, La wrence M. (2012). r ggobi: Interface betw een R and GGobi. A vailable: http://cran.r- project.org/web/ packages/rggobi/index.html . Ac- cessed 18 April 2013. [28] Adler D, Murdoch, D. (2013). 3D V isu- alization package (OpenGL). A valiable: http://cran.r- project.org/web/ packages/rgl/index.html . Accessed 18 April 2013. [29] RStudio Inc. (2013) Shiny: web appli- cations framew ork for R. A v ailable: http://cran.r- project.org/web/ packages/shiny/index.html . Accessed 18 April 2013. 8 Framew ork for Reproducible Research • April 2013 [30] Lewin-Koh N. (2013) CRAN T ask V iew: Graphic Displays and Dynamic Graphics and Graphic Devices and V isualization. A v ailable: http://cran.r- project. org/web/views/Graphics.html . Ac- cessed 18 April 2013. [31] Creativ e Commons. A vailable: http: //creativecommons.org/ . Accessed 18 April 2013. [32] Google Inc. Google Sites. A v ailable: https://sites.google.com/?pli=1 . Accessed 18 April 2013. [33] Observer Agreement. A v ailable: https://sites.google.com/site/ observeragreement/home . Accessed 18 April 2013. [34] Laine C, Goodman SN, Griswold ME, Sox HC. (2007) Repr oducible resear ch: mo ving tow ard research the public can really trust.Ann Intern Med. Mar 20;146(6):450-3. [35] Peng RD. (2009) Reproducible research and Biostatistics. Oxfor d Jour nals. Bio- statistics. V olume10, Issue pp 405-408. [36] Peng RD. (2011) Reproducible Research in Computational S cience. S cience 2 De- cember 334 (6060):1226-1227 DOI: 10. 1126/science.1213847 9
Original Paper
Loading high-quality paper...
Comments & Academic Discussion
Loading comments...
Leave a Comment