A quantitative evaluation of health care system in US, China, and Sweden
This study is mainly aimed at evaluating the effectiveness of current health care systems of several representative countries and improving that of the US. To achieve these goals, a people-oriented non-linear evaluation model is designed. It comprise…
Authors: Qixin Wang, Menghui Li, Hualong Zu
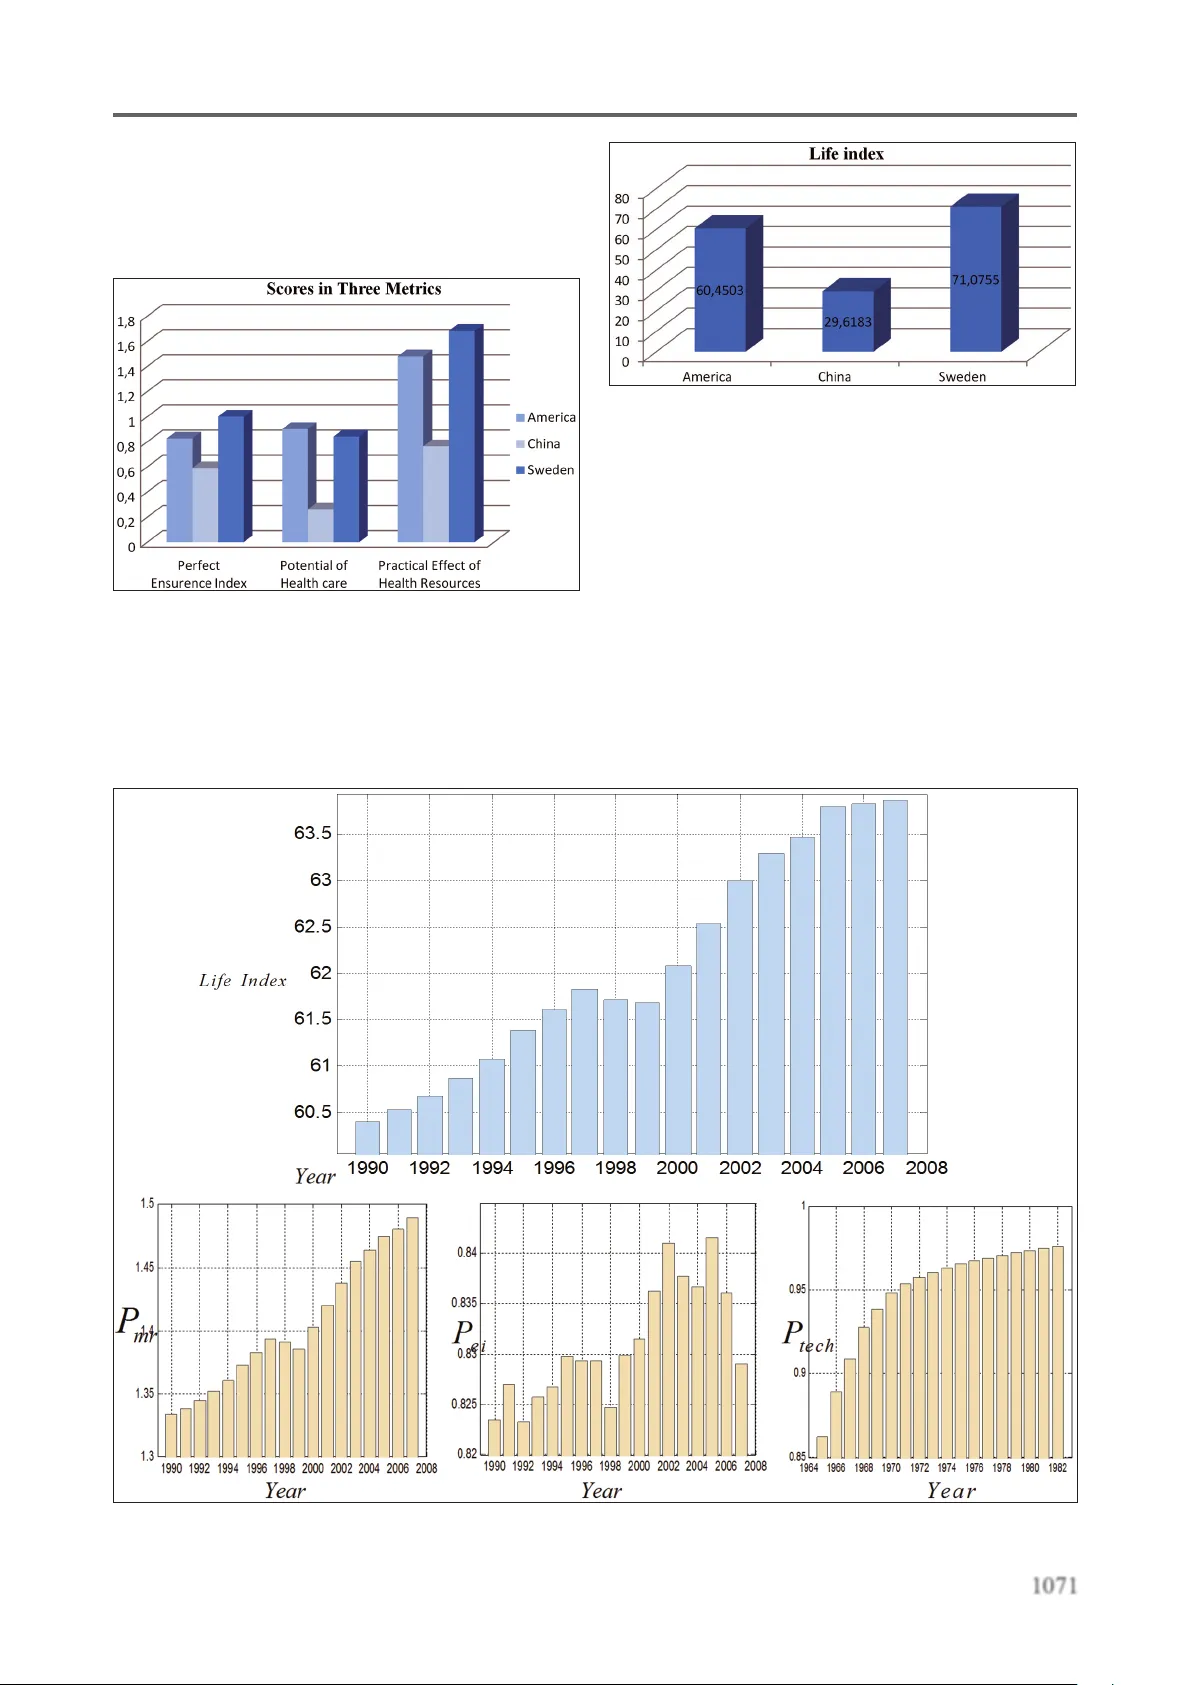
1064 Health MED - V olume 7 / Number 4 / 2013 Journal of Society for development in new net envir onment in B&H V ersion for pr eview Abstract This study is mainly aimed at evaluating the effectiveness of current health care systems of several representative countries and improving that of the US. T o achieve these goals, a people- oriented non-linear evaluation model is designed. It comprises one major evaluation metric and four minor metrics. The major metric is constituted by combining possible factors that most signicantly determine or affect the life expectancy of people in this country . The four minor metrics evaluate less important aspects of health care systems and are subordinate to the major one. The authors rank some of the health care systems in the world according to the major metric and detect problems in them with the help of minor ones. It is concluded that the health care system of Sweden scores higher than the US and China’ s system scores lower than that of the US. Especially , the health care system of US lags behind a little bit compared with its economic power . At last, it is reasonable for the American government to optimize the arrangement of funding base on the result of goal programming model. Key words: Health care system, evaluation. Introduction A satisfactory health care system of one country is supposed to provide its residents with effective health care, so that a majority of citizens can enjoy a security and high-quality life, with maximized so - cial equality and minimized total medical expendi - ture. The complexity of the health care systems ma - kes it difcult to evaluating the health care system by taking into account only a few factors. The considerations of previous research tend to emphasize the nancial efciency of health care systems. Controlling of the cost has been reported as the key factor of this system [1,2]. However , health care system is slightly dif ferent from nan - cial system [3,4]. Medical care is a necessity rather than a commodity for citizens of a country . The quality of medical care of patients is much more important than controlling of cost in health care system [5]. In health care system, health insurance covers most large medical expenses, but there is no institution in a nancial system would insuran - ce the high consumption. Thus, we developed a people-oriented comprehensive evaluation system and pay more attention to make sure quality of he - alth care of people. In this evaluation system, the quality of health care to the patient has a higher priority rather than the nancial efciency . In addition, previous researchers fail to consider the relationship between health care system and medical research institution [1-3]. The health care system is heavily inuenced by the development of biomedical research. The investment to the medi - cal research institution can improve the operational efciency of the health care system, discover new drugs, revise the therapies, and improve the life qu - ality of patients. It is no doubt that increase of inves - tments on medical research has positive impact on health care system in developed country . However , for a developing country , it seems reasonable to pay more attention on other part of health care system such as development medical insurance system, bu - ilding new hospitals and medical education [6]. Several studies described the qualitative analysis of patient satisfactory of health care and A quan t av e e v alua on of health car e s ys t em in US, China and Sw eden Qixin W ang 1 , Menghui Li 2 , Hualong Zu 3 , Mingyi Gao 4 , Chenghua Cao 5 ,Li Charlie Xia 6 1 Department of Mathematics, University of Southern California, Los Angeles, United States of America, 2 Department of Biomedical Engineering, Peking University , Beijing, PR China, 3 Department of Electrical Engineering, University of Southern California, Los Angeles, United States of America , 4 Department of Chemical Engineering and Materials, University of Southern California, Los Angeles, United States of America , 5 School of Medicine, University of California Irvine, Los Angeles, United States of America , 6 Department of Biological Sciences, University of Southern California, Los Angeles, United States of America . Health MED - V olume 7 / Number 4 / 2013 Journal of Society for development in new net envir onment in B&H 1065 V ersion for pr eview government investment to medical system [7, 8]. However , since there is a complex non-linear relati - onship between increase of government investment and improvement patient satisfactory of health care system[9,10,1 1], it is hard to optimize the amount of investment to current health care system; a qu - antitative analysis model is highly desired. In this study , we are going to conduct a quantitative mo - del to evaluate the health care system of the United States, Sweden, and China. W e will also develop a goal programming model to evaluate the best go - vernment funding allocation to health care system. Denitions and Key T erms A health car e system is the organization and the method by which health care is provided. The potential of health car e ( P hc ) of a country shows the power of medical researches and devel - opment supported by the government at the pres - ent time. It is positively correlated with the size of medical research staff and the quantity of funding from the government. The health of a citizen is perfectly ensur ed , if his/her income plus aid from the government (plus the nancial compensation from medical in - surance system if he/she is covered by it) is lar ge enough to prevent and/or cure diseases, ignoring the irreversible damage to health that is beyond the ability of current medical technology . The quality index of life represents the relief from possible diseases or accidentally physical injury based on economic aid offered by medical insurance, and a certain quantity of medical re - sources provided by current health care system, as well as scientic potential of medicine realized by government-funding researches. This index can approximately imply the quality of life. The life expectancy represents the average life span of a newborn and is an indicator of the over - all health of the population of a country . Practical effect of medical r esour ces is the quantity of all categories (medical doctors, nurses, beds) of medical aid that is practically distributed to each citizen in a country on average. The medical care resources are divided into essential health car e and complementary health car e r esources . Complementary car e is the kind of services that offer holistic benets that comple - ment or enhance the health care received from the physicians or hospital, and essential health care embraces all the other kinds. The matching degree of a health care system in a country measures whether the system is mas - sive enough to keep up with the development of the country . The health of a citizen is perfectly ensur ed , if his / her income plus aid from the gov - ernment ( plus the nancial compensation from medical insurance system if he / she is covered by it) is lar ge enough to prevent and / or cure diseases , ignoring the irreversible damage to health that is beyond the ability of current medical technology . The fairness index represents how well a health care system distributes its resources to everyone who needs it, both rich and poor , urban and rural residents . The life index of a nation is a general and com - prehensive gure that describes how much life of high quality is enjoyed by all the citizens in one country . It is positively correlated with quality in - dex of life and average life expectancy . Universal health car e refers to delivery by a com - bination of public and private systems. In most cases , the law says that everyone must have access to health care. Germany and Sweden, for example, has uni - versal coverage, and social insurance plans cover the majority of people. Symbols are listed in T able 1 . Assumptions People around the world have the same suscep - tibility to diseases, whichever country they are in. - Medical personnel and scientic researchers are all competent for their job. - The per capita GDP of one country can denote how rich and developed the country is. - Every health care system possesses appro- ximately equal ability of emergency management. - Every type of disease occurs to people in all countries with the same possibility . - If a resident is covered by the health care insurance, he/she will be able to af ford his/ her medical expenditure. - The investment into scientic medical researches is always effectively used. - The investment into science researches will pay off (be transformed into applied technology) 25 years later averagely . 1066 Health MED - V olume 7 / Number 4 / 2013 Journal of Society for development in new net envir onment in B&H V ersion for pr eview Model Design The Major Evaluation Metric General Analysis Since the service object of the health care sys - tem is people, we perceive that the evaluation met - ric should reect how well the length and qual - ity of people’ s life are guaranteed by the system through providing health care, which is repre - sented by a general concept called life index . Then we decompose life index into two parts that are mutually independent: quality index of life and life expectancy , which measure the quality and quan - tity of residents’ life, respectively . W e whereafter keep breaking down quality index of life into con - crete concepts and simple factors. In so doing, the evaluation system model is concretized and op - erationalized, because: 1) life index is quantied and hence computable; 2) it is easier to search and identify associated sources of data. As we attach great emphasis on the practical effectiveness of health care systems, the life index ( L index ) is the nal metric that decides whether a health care system is good or not. According to our denition, we have: index life life L QE = × , ..................... (1) where Q life is standardized life quality index, and E life is the average life expectancy of the population in one country . E life of countries in the world, as a basic and use - ful kind of data, can be easily found from more than one reliable sources of information, but Q life is com - paratively abstract and complicated to measure. Since it is unreasonable to limit E life to a xed range, L index is not standardized here. Obviously , a health care system can help pro - mote Q life in many different ways, but we notice T able 1. Symbols of evaluation model Symbols Denitions & Descriptions index L Life index life E Life expectancy life Q Life quality index mr P Practical effect of medical resources ei P Perfect ensurence index tech P The current power of medical technology hc P Potential of health care e R Essential health care resources c R Complementary health care resources un D Unnecessary degree ne D Necessity degree in N Number of residents who are covered by medical insurance gov k The proportion of government reimbursement in medical expense , med i X One’ s medical expenditure which is submitted to Poisson distribution , inc i X one’ s net income which is submitted to normal probability distribution e E A verage essential expenditure to maintain everyday life , inc i X one’ s income which is submitted to normal probability attribution ( ) s Nt Number of medical researchers ( ) s Mt Quantity of funding going to medical research t T ime delay Health MED - V olume 7 / Number 4 / 2013 Journal of Society for development in new net envir onment in B&H 1067 V ersion for pr eview that almost every way is realized through one of the following three channels: I every country organizes and provides health care resources to its citizens; II medical insurance and government offer economic aid so that the patients have access to medical care service; and III the government invests money into medical researches so that we will have more advanced medical technology that can cure the currently incurable diseases and prevent unpredictable diseases in the future. Using three corresponding variables P mr , P ei and P tech to measure the effectiveness of the above three channels, we nd that Q life is positively cor - related with each one of them. Therefore, it is rea - sonable to dene: Q life =( P mr + P ei + P tech )/ k q , ................... (2) where P mr is the practical effect of medical r esour ces , P ei is perfect ensur ence index , P tech is the current power of medical technology (all of them are standardized indexes), and k q is a coefcient to standardize Q life . T o get Q life , we have to obtain the value of P mr , P ei and P tech one by one. Quantify and Calculate P mr Since the medical care resources are divided into essential health care and complementary health care resources, P mr should be broken down into two corresponding parts: the practical effect of essential health care and that of complementary health care. Thus, we get 33 ,, 11 ,, ,, ei ci mr ii ei ei ci ci RR P Rk Rk = = = + ++ ∏∏ , ......... (3) Where 1 R , 2 R and 3 R respectively refer to the number of medical doctors, nurses and the beds in hospitals, R e is a standardized index that denote the es - sential health care resources, R c is a standardized index that denote the complementary health care resources, k e,i and k c,i are empirical coefcients, and the re - lationship among them is expressed by ,, ,, ei ei ci ci Rk Rk ×= × Note that: when , 0 ei R → , we have , , ,, , 1 ei ei ei ei ei R R Rk k → + , which means the practical effect of medical resources is decided by the quantity of medical resources completely (directly proportional to it); when , ei R →∞ , we get , ,, 1 ei ei ei R Rk → + , which means excessive medical resources contrib - utes little and will cause a great waste; we multiply the monomial i ii R Rk + ( i =1, 2, 3) because the lack of any one of R i will bring serious difculty to any health care system. Calculate P ei The population of one country can be divided into two categories: those who are covered by medical care insurance ( N in ) and those who are not ( N un ). So the proportion of insured people ( P insur e ) is given by , in in insure in un NN P population N N = = + ............ (4) The perfect ensurence index ( P ei ) actually mea - sure how many people have their health well en - sured through either joining health care insurance or paying by their sufcient income. Thus, it is reasonable to nally dene P ei as 1, ei uninsure total medical expenditure shortage PP total medical expenditure = -× ........................................ (5) which in fact is 1068 Health MED - V olume 7 / Number 4 / 2013 Journal of Society for development in new net envir onment in B&H V ersion for p r evi ew ( ) ( ) { } , ,, ,, 1 , 1 , 1, 0, , (1 ) (1 ) 1 (1 ) , (1 ) , , un Au A M i inc i M i gov N med i gov inc i e A i ei insure n med i gov i inc i e iA I iA AX X X k X k X EI PP Xk XE = = ∈ = ∉ = ×- > ×- - - × = -- × ×- - ∑ ∑ ........................................ (6) where k gov is the proportion of government reimburse - ment in medical expense, E e is the average essential expenditure to main - tain everyday life, X med,i is the medical expenditure of someone in the country , which is submitted to Poisson distri - bution, and X inc,i is the net income of someone in the coun - try which is submitted to normal distribution. Calculate P tech The current power of medical technology ( P tech ) can be well deduced by the potential of health care ( P hc ) years ago, which means P tech can be estimat - ed as P hc with a time delay ( t ), because it takes a period of time to transfer scientic investment into scientic products. Some scholars believe that t=20-30 years and we make it 25 [6] years here. Firstly , we calculate P hc based on its denition: ( ) ( ) ( ) ( ) ss hc Ns M s Nt M t P k Nt k M t = × ++ .............. (7) where N s ( t ) is the number of medical researchers, and M s ( t ) is the quantity of funding going to medical research. Note that both of the two factors, medical re - searchers and money , can enhance P hc , but exces - sive investment (medical researchers and money) gives only limited effect to P hc . This truth supports our idea to dene P hc this way . Secondly , we incorporate t into P hc to get P tech ( ) ( ) ( ) ( ) ss tech Ns M s Nt M t P k Nt k M t tt tt -- = × +- + - .......... (8) Medical research plays an important role to im - prove the math expectation of residents’ life in future. E life =E 0 + k lt 0 l i f e l t h c E Ek P = + × P hc ........................ (9) where E 0 , k lt are coefcients. W ith Eq (1), (2), (3), (4), (6), and (8), L index can be expressed by a complicated equation which in - volves a series of variables. Figur e 1. The diagram showing the or ganization of evaluation of health car e system Subordinate Metrics Potential of Health Care (P hc ) Eq(7) gives the expression of P hc which is actu - ally a standardized index that predicts the power of medical technology ( P tech ) in the future. Matching Degree T o get matching degree of each health care system, two factors need to be taken into account: the how well residents’ health is ensured and how wealthy the country is. A rich country has the abi - lity to maintain a large scale of health care system that provide abandon health care resources, whi - le a developing country can only afford a smaller and cheaper one. This fact implies that it is harder for a developed country to maintain a matching health care system, because the country has to in - vest more (money , etc) into its health care system. Therefore, matching degr ee is given by ( ) ( ) 10 ln ln index Matching Degree per capita GDP L = - (10) Health MED - V olume 7 / Number 4 / 2013 Journal of Society for development in new net envir onment in B&H 1069 V ersion for pr eview where R e is the essential health care resources, R c is the complementary health care resources, and Per capita GDP is per capital Gross Domestic Product. Fairness Degree The attribution of medical resources cannot po - ssibly be absolutely fair . W e tend to believe that wealthy people have more chance to accept medi - cal aid then the poor . Here we compare urban pe - ople with those living in rural areas by measuring the quantities of health care resources attributed to them respectively . rural medical resouces Fair ness Degree urban medical resouces = .. (1 1) Luxury Degree Considering some parts of a health care sys - tem may not play the most essential role or can - not bring immediate benets to the residents, we dene Complementary health care resources and potential of health care to be “unnecessary”, while essential health care resources and perfect en - surence index to be “necessary”. Thus, if we con - tinue to dene unnecessity degr ee ( D un ) and neces - sary degr ee ( D ne ) as: D un =R c +P hc ............................ (12) D ne = R e + P ei ........................... (13) we will arrive at: un ne un D Luxury Index DD = + ........... (14) Revise the spending plan for US Although the health care system of US ranked considerably high in the world, is still far from ideal. In this part, we try to revise the previous model to optimize the health care system of US to give more detailed suggestions, as we realize that improving such a complicated system requi - res further investigation. Suppose the government has already given it the funding shortage (the health care system of U.S. needs extra 300 billion dollars to push its matching degr ee to as high as Sweden’ s) and the - refore the total budget expands, how shall the he - alth care system spend the extra 300 billion dollars wisely? W e argue that a wise spending plan should maximize the life index . As we have stated above, life index is positively correlated with quality in - dex of life and average life expectancy . However , life expectancy varies very slightly as time elapses, hence we prescribe that an ideal spending plan is the one that maximizes quality index of life . Now our aim is to revise the previous model to solve this non-linear programming problem. W e identify nine symbols representing nine major expenditures in T able 2: T able 2. Symbols repr esenting major expenditur es Symbols Denition , gov 1 F Economic aid to patients , gov 2 F Salary of research staff , gov 3 F Funding to support medical researches 4 gov, F Salary of medical doctors in essential medical source 5 gov, F Salary of medical nurses in essential medical source 6 gov, F Equipment in essential medical source 7 gov, F Salary of medical doctors in complementary medical source 8 gov, F Salary of medical nurses in complementary medical source 9 gov, F Equipment in complementary medical source The Objective function is Max L index = ( P ei + P mr + P hc ) x ( E 0 + k lt 0 l i f e l t h c E Ek P = + × P hc )/ k q ...................................... (15) subject to 9 , 1 gov j total j FF = = ∑ where 1070 Health MED - V olume 7 / Number 4 / 2013 Journal of Society for development in new net envir onment in B&H V ersion for pr eview ,1 ,2 ,3 ,2 ,3 3 ,3 ,6 1 , 3 ,1 ,1 , 6 ,1 , 1 1 income ei uninsure A med gov gov gov hc N salary gov M gov gov i gov i mr i gov i e e gov i c c F P P EI FF FF P kS F k F FF P F nk F nk ++ = ++ = + -× - = × ++ = + ++ ∏ 3 1 1 i = ∏ The process of deduction shown as following: ,, 1 , 1 ,, , ,, , ( (1 ) ) 1 (1 ) (1 ) ) 1 (1 ) (1 ) 1 (1 ) Au Au n M i gov F i A i ei uninsure n M i gov i A Au M i gov Au F i ei uninsure Au M i gov A M i gov F i ei uninsure M i gov e X k XI PP Xk EI n EX k n EX PP n EX k EI EX k EX PP EX k P = = ×- - × = -× ×- × × ×- - × ⇒= - × × ×- × ×- - ⇒= - × ×- ⇒ ∑ ∑ ,, , , , (1 ) 1 (1 ) 11 (1 ) A M i gov F i i uninsure M i gov Fi ei uninsure A M i gov EI EX k EX P EX k EX P P EI EX k × ×- - = -× ×- ⇒= - × - ×- ,1 ,1 ,1 11 (1 ) 1 (1 ) 1 () 1 ei uninsure A gov med uninsure A ei uninsure A gov med Au uninsure A med ei uninsure A Au med gov A ei uninsure A u P P EI F F uP EI P P EI F F n uP EI F P P EI n FF n P P EI λ λ λ ⇒= - - - ⇒= - - ×- × ⇒= - - ×× - ⇒= - + ,1 ,1 () 1 () u uninsure A med Au med gov income uninsure A med ei uninsure A Au med gov med Au uP EI F nF F F P EI F P P EI nF F Fn λ λ λ - ⇒= - + - = ,1 1 income uninsure A ei uninsure A med gov F P EI P P EI FF = -+ - ∴ 33 ,, 11 ,, ,, ,3 ,6 33 ,1 ,1 ,3 ,6 11 ,1 ,1 ,1 ,1 33 ,3 ,6 11 , 3 ,1 ,1 , 6 ,1 ,1 ei ci mr ii ei ei ci ci gov i gov i ec mr gov i gov i ii ec ec gov i gov i mr ii gov i e e gov i c c RR P Rk R k FF nn P FF kk nn FF P F nk F nk = = ++ ++ = = ++ = = ++ = + ++ ⇒= + ++ ⇒= + ++ ∏∏ ∏∏ ∏∏ ,2 ,3 ,2 ,3 ,2 ,3 ,2 ,3 ss hc N sM s gov salary gov hc gov M gov N salary gov gov hc N salary gov M gov NM P k Nk M F SF P F kF k S FF P kS F k F = × ++ ⇒= × + + ⇒= × ×+ + ⇒ ( ) 0 ,1 ,2 ,3 ,2 ,3 33 ,3 ,6 11 , 3 ,1 ,1 , 6 ,1 ,1 max ( ) 11 index ei mr hc lt hc q income ei uninsure A med gov gov gov hc N salary gov M gov gov i gov i mr ii gov i e e gov i c c L PP P EkP F P P EI FF FF P kS F k F FF P F nk F n k k ++ = = ++ = + + × +× = + -× - = × ++ = + ++ ∏∏ 9 , 1 gov j total j subj ect t o F F = = ∑ Results and Discussion Compare the Effectiveness of Health Care Systems W e had the ability to express Q life with variables that are supported by sufcient data. Figure 2 shows the scores of America, China and Sweden in P mr , P ei and P tech . Note that the perfect ensurence index of Sweden is 1 (the largest possible value), because, the Sweden has a universal health care system that Health MED - V olume 7 / Number 4 / 2013 Journal of Society for development in new net envir onment in B&H 1071 V ersion fo r pr evie w impose medical insurance to every citizen. More - over , the power of medical science exceeds that of Sweden, which, we perceive, is an inevitable result of large investment into it in the past several decades. Figur e 2. Thr ee countries’ scores of P mr , P ei and P tech Figure 3 provides the comparison of life indexes of US, China and Sweden. V ery clearly , the health care system of Sweden is the best among them and the system of China lags behind extremely . Figur e 3. The curr ent life index of U.S., China and Sweden The analysis of life index of US Figure 4 shows the life index of US and the change of P mr , P ei and P tech from 1990 to 2008; all of the four variables were roughly increasing except for a bit of ramp-down at the end of the 20 th century . The perfect insurance index uctuates with time, but the general trend is rising, presumably pushed by the development of domestic economy . Since the year 1992, the index rose but dropped Figur e 4. The history tr end of life index, P mr , P ei and P tech of US 1072 Health MED - V olume 7 / Number 4 / 2013 Journal of Society for development in new net envir onment in B&H V ersion for pr eview drastically in 1998, [14] which is a rather puzzling phenomenon. If we take a look back on history of America, we will nd that in the 1993, President Clinton issued a new policy about medical insur - ance aiming at popularizing medical insurance so that every citizen is covered[16]; in 1998, [15] he declared that this policy was suddenly ceased be - cause of some reason. The data coincide with his - toric changes amazingly . Figur e 5. Revised spending plan of US by gr eedy algorithm Analyses of Subordinate Metrics W ith the most general metric life index, we are able to evaluate and rank the health care systems in the world (e.g. the health care system of US is better than that of China but not as good as that of Sweden), but a considerable amount of informa - tion is lost or neglected at the same time, which will bring much difculty in identifying exiting limitations and problems with these health care systems. In order to crack this, we pick out and re - arrange some factors to constitute new metrics as complementary metrics (potential of health care, matching degree, fairness degree, & luxury de - gree). W ith the help of these complementary me - trics, different aspects of one health care system can be evaluated and its limitations become de - tectable and predictable. A low matching degr ee may suggest the ne - cessity of investing more money into the health care system so that its scale can be enlarged, whi - le a high one implies that the current health care system is massive enough considering the limited economy scale. Figure 7 implies that the health care system of U.S. should be stronger to match the massive scale of its economy [9]. If we want the matching degree of U.S. to be promoted to 1.66, the government must invest more money into health care system [10]. The matching degr ee implies a slight lack of government investment into health care system [1 1]. Since it is difcult to obtain all the data to de - cide their precise quantities, we consider it to be feasible to substitute them with numbers of beds in hospitals in urban and rural areas [12, 13]. The information delivered by Figure 8 is clear: China did a very poor job in health care fairness while that of US could be better . W e consider luxury index to be tolerant of subtle conceptual ambiguity , because the slight lack of preciseness in dening concepts may wea - ken its competence in give an absolute evaluation, but still allows it to serve as a metric to compare different health care systems. (Note that the word ‘unnecessary’ doesn’t mean ‘redundant’.) Figur e 6. All the Subor dinate metrics It is never easy to give a complicated system properly and a precise evaluation [17], as the result is connected with multiple factors that are interwo - ven with each other [18]. However , if we establish a model that based on reasonable assumptions and tolerate a certain degree of ambiguity , satisfactory result could be achieved [19]. On the other hand, limitations of our model also mainly originate from the assumptions and ambiguity [20-23]. It is well admitted that few things are perfect in the world, whereas we never stop pursuing ideal health care systems, even though it takes a lot of money , manpower , time and ener gy to improve, because they are our safe guard that relieve our fear of diseases [24-31]. Health MED - V olume 7 / Number 4 / 2013 Journal of Society for development in new net envir onment in B&H 1073 V ersion for pr eview References 1. Perleth M, Jakubowski E, Busse R, What is ‘best prac - tice’ in health care? State of the art and perspectives in improving the effectiveness and efciency of the Eu - r opean health car e systems. Health Policy , 2001(56), 235-250 2. Ros CC, Gr oenewegen PP , Delnoij DM, All rights r eserved, or can we just copy? Cost sharing arran - gements and characteristics of health car e systems, Health Policy , 2000(52), 1-13 3. Abelson J, Miller F A, Giacomini M, What does it mean to trust a health system?: A qualitative study of Canadian health car e values, Health Policy 2009(91), 63-70 4. Calnan M, T owards a conceptual framework of lay evaluation of health car e, Social Science & Medicine, 1988(27), 927-933 5. Petersen I, Swartz L, Primary health car e in the era of HIV/AIDS. Some implications for health systems r eform, Social Science & Medicine, 2002(55), 1005- 1013 6. Chang C, Zhang Y , Deng D, Xiao Y , A compr ehensive evaluation model of health car e system, Networking and Information T echnology (ICNIT), 2010 Internati - onal Confer ence, 535 -539 7. K. Claxton The irr elevance of infer ence: a decision- making appr oach to the stochastic evaluation of he - alth car e technologies, J Health Econ. 1999(18), PP . 341-64. 8. Y ang T , Matthews SA, Understanding the non-sta - tionary associations between distrust of the health car e system, health conditions, and self-rated health in the elderly: A geographically weighted r egr ession appr oach, Health & Place, 2012(18), 576-585 9. Smith PC, Stepan A, V aldmanis V , V erheyen P , Princi - pal-agent pr oblems in health car e systems: an inter - national perspective, Health Policy . 1997(41), 37-60 10. Pons-V igués M, Puigpinós-Riera R, Rodríguez D, Sanmamed M J., Pasarín MI, Pér ez G, Borr ell C, Casamitjana M, Benet J, Country of origin and pr e - vention of br east cancer: Beliefs, knowledge and barriers, Health & Place, 2012(18), 1270-1281 1 1. Hollander MJ, Miller JA, Kadlec H, Evaluation of Healthcar e Services: Asking the Right Questi - ons to Develop New Policy and Pr ogram-Relevant Knowledge for Decision-Making, Healthcar e Quar - terly , 2010(4), 40-47 12. Oliveira MD et al, Modeling hospital costs to pr odu - ce evidence for policies that pr omote equity and ef - ciency , European Journal of Operational Resear ch, 2008(16), 933-947 13. Rijsber gen MV et al. Managing the overow of in - tensive car e patients. Eur opean Journal of Operati - onal Resear ch, 2008 (16), 988-1010 14. B.X. Qin, Bill Clinton’ s health car e r eform. Ameri - can Resear ch 1994, 7-8 15. Congr essional Quarterly , Health Care’ s Hour , 1993, 19-20 16. Congr essional Quarterly , 1993, 2458-2459 17. W ang Q, Liu Y , Mo L, The evaluation and pr ediction of the effect of AIDS therapy , Pr oceeding of IEEE/ ICME International Confer ence, 2007, 1591- 1596 18. W ang Q, Liu Y , Pan X, Atmospher e pollutants and mortality rate of r espiratory diseases in Beijing, Sci - ence of the T otal Envir onment, 2008(391), 143-148 19. W ang Q, Liu Y , Zhang B, Economic strategies in the issue of contr olling AIDS, Pr oceeding of IEEE/ ICME International Confer ence, 2007, 1601- 1608 20. Shmueli A, Israelis evaluate their health car e system befor e and after the intr oduction of the national he - alth insurance law , Health Policy , 2003(63), 279-287 21. Kiil A, What characterises the privately insur ed in universal health car e systems? A r eview of the empi - rical evidence, Health Policy , 2012(106), 60-75 22. W ensing M, Baker R, Szecsenyi J, Grol R, On behalf of the EUROPEP Gr oup, Impact of national health car e systems on patient evaluations of general prac - tice in Eur ope, Health Policy , 2004(68), 353-357 23. Gu Xing-Y uan, T ang Sheng-Lan, Reform of the Chinese health care nancing system, Health Policy , 1995(32), 181-191 24. Y aesoubi R, Roberts SD, Payment contracts in a pre - ventive health car e system: A perspective fr om Ope - rations Management, Journal of Health Economics, 201 1(30), 1 188-1 196 25. A vgerinos ED, Koupidis SA, Filippou DK, Impact of the Eur opean Union enlar gement on health pr o - fessionals and health car e systems, Health Policy , 2004(69), 403-408 26. Zu H, W ang Q, Dong M, Ma L, Y in L, Y ang Y , Com - pr essed Sensing Based Fixed-Point DCT Image En - coding, Advances in Computational Mathematics and its Applications, 2012(2), 237-240 1074 Health MED - V olume 7 / Number 4 / 2013 Journal of Society for development in new net envir onment in B&H V ersion for pr eview 27. W ang Q, Li M, Xia LC, W en G, Zu H, Gao M(2013), Genetic Analysis about Differ entiation of Helper T L ymphocytes, Genetics and Molecular Resear ch, in pr ess 28. Xia L, Zhou C, Phase transition in sequence unique r econstruction, Journal of Systems Science and Complexity 2007(20), 18-29 29. Zhang SW , Li YJ, Xia L, Pan Q, PPLook: an automa - ted data mining tool for pr otein-pr otein interaction, BMC bioinformatics 201 1(1 1), 326 30. He P A, Xia L, Oligonucleotide pr oling for discri - minating bacteria in bacterial communities, Com - binatorial Chemistry & High Thr oughput Scr eening 2007(10), 247-255 31. Steele JA, Countway PD, Xia L, et al., Marine bacte - rial, ar chaeal and pr otistan association networks r e - veal ecological linkages, The ISME Journal 201 1(5), 1414-1425. Corr esponding Author Qixin W ang, Department of Mathematics, University of Southern California Los Angeles, United States of America, E-mail: qixin.wang@usc.edu
Original Paper
Loading high-quality paper...
Comments & Academic Discussion
Loading comments...
Leave a Comment