Central indexes to the citation distribution: A complement to the h-index
The citation distribution of a researcher shows the impact of their production and determines the success of their scientific career. However, its application in scientific evaluation is difficult due to the bi-dimensional character of the distributi…
Authors: Pablo Dorta-Gonzalez, Maria Isabel Dorta-Gonzalez
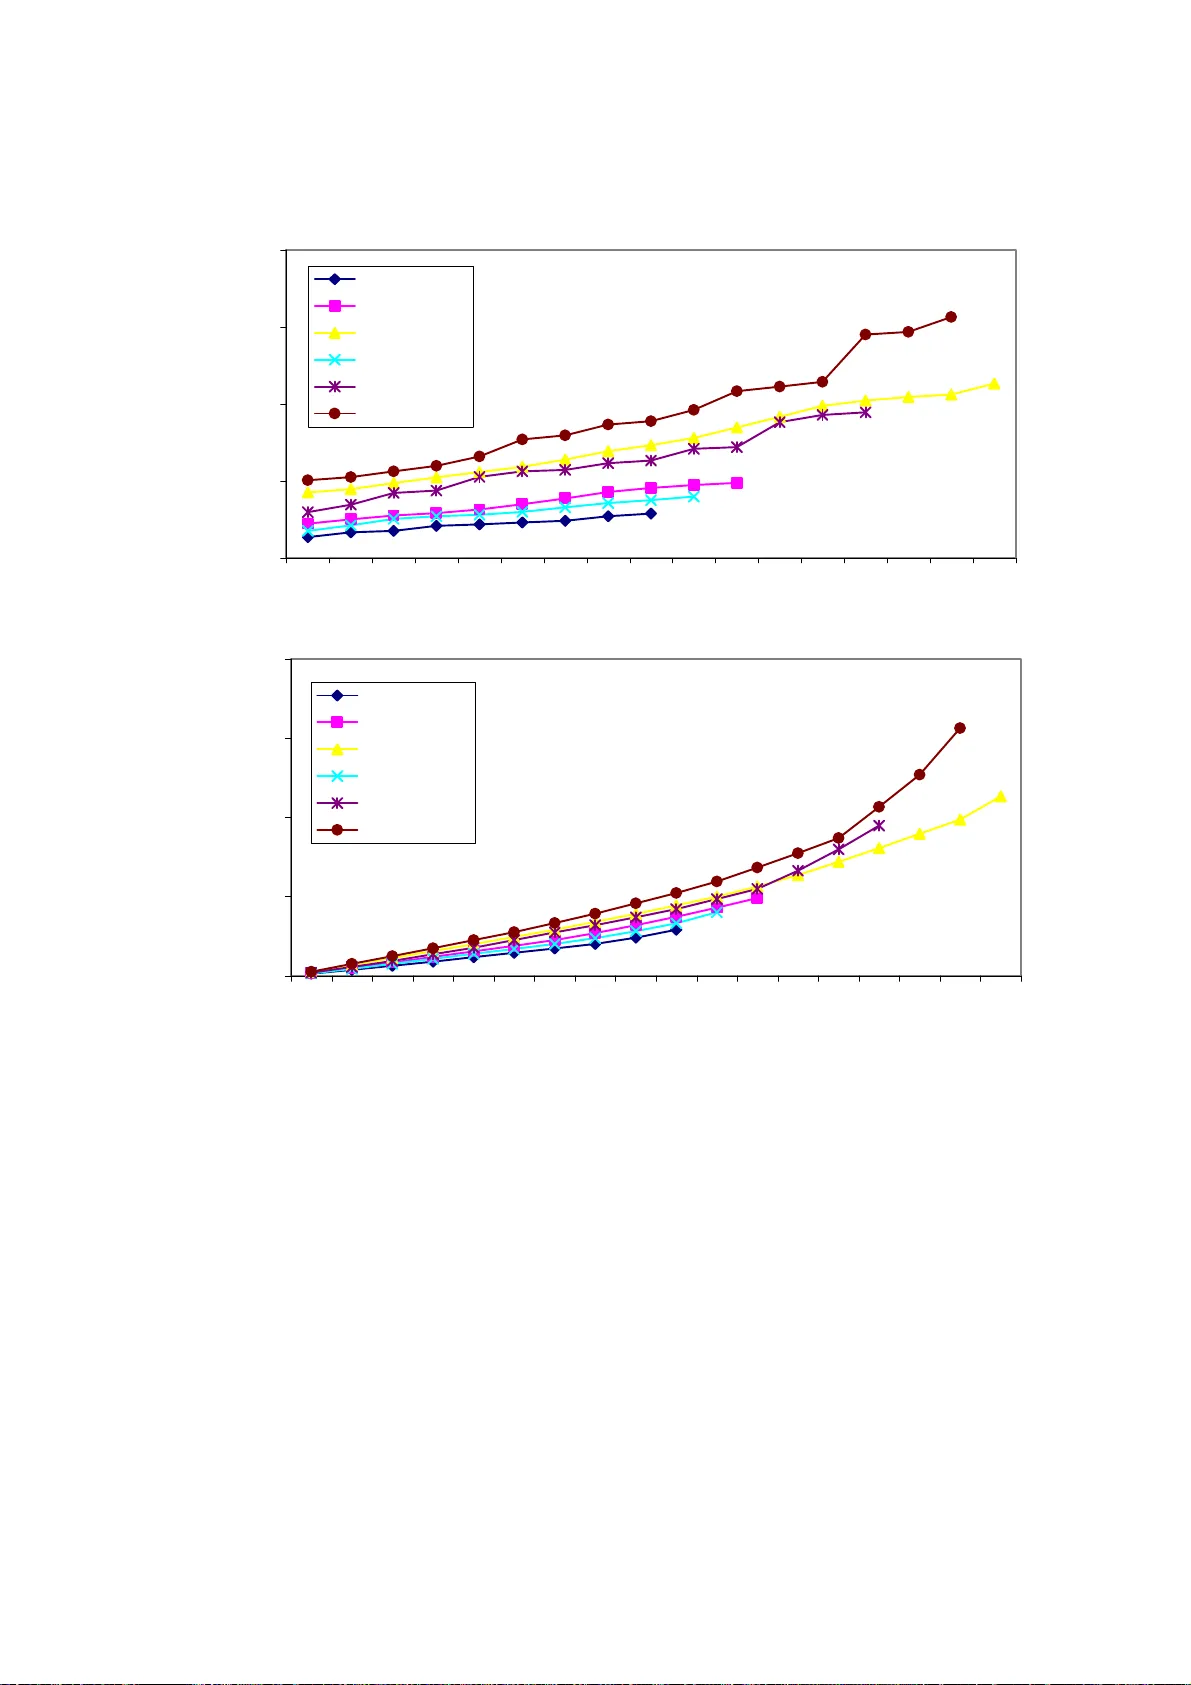
Central indexes to th e citation distribution: A complement to the h-index 1 P ABLO D ORTA -G ONZÁLEZ * M ARÍA -I SABEL D ORTA -G ONZÁLEZ † * Departamento de Métodos Cuan titativos en Economía y Gestión Universidad de Las Palmas de Gran Canaria, Gran Canaria, España pdorta@dmc.ulpgc.es † Departamento de Estadística, Investigación Operativa y Computación Universidad de La Laguna Tenerife, España isadorta@ull.es 1 This research was partially fin anced by th e Mini sterio de Ciencia e Innov ación, grant ECO2008- 05589. 2 Central indexes to th e citation distribution: A complement to the h-index ABSTRACT The citation distribution of a researcher shows the impact of their production and determines the success of their scie ntific care er. However, its appli cation in scientific evaluation is difficult due to the bi-dimen sional character of the distribution. Some bibliometric indexes that try to synthe size in a numerical value the principal characteristics of this distribution have been proposed recently. In contrast with other bibliometric measures, the biases that th e distribution tails pr ovoke, are reduced by the h -index. However, some limitations in th e discrim ination among researchers with different publication habits are presented in this index. This index penalizes selective researchers, distinguished by the large numbe r of citations received, as compared to large producers. In this work, two original sets of indexes, the central area indexes and the central interval inde xes, that complement the h -index to include th e central shape of the citation distribution, ar e proposed and compared. Keywords: h -index, Citation analysis, Bibliometric indexes, Research career evaluation. MSC Code: 62-07 Data analysis 3 1. Introduction There exists a genera l consensus among researchers abou t journal article s which are the most direct results of research, especially when journals with a selectiv e process that guarantees quality and origina lity are considered. Although expe rt op inion is believed to be the most appropriate method of valuing th e contribution of an ar ticle to a specific field of knowledge, this system presents some limitations, such as the subjective character and its high cost. In this contex t, bibliom etric indexes repre sent objective evidences that can be used to complem ent expert opinion. It is known that some works of limited success are publishe d by the best journals, and some works of great success are published in journals that are not top ranked accord ing to the impact factor. Therefore, th ere is so me rejection to evalua ting the impact of a work by the impact factor of the publishing journal. Most common indexes used to evaluate re searchers are based on counting publications and received citation s. The number of publications p (N ) is a quantitative indicato r that does not value the scientific advance of th e contribution. As qualitative indicators able to assess the impact, influence or visibility of a research, the total number of cita tions c (N ) and the average citations per article cc p (n N N ) are used . However, although these indicators show the success of a sc ientific career in many cases, som etimes isolated successes accumulate a high percenta ge of the to tal number of citations. In addition, important biases are introduced by large collaborations that collect m any citations derived from the work of a large num ber of researchers. The h- index [H IRSCH , 2005] tries to solve these li mitations. A researcher has an h -index when h of its publications have each received at least h citations, and the rest have h or less citations. The number of im portant artic les pertaining to a researcher is estim ated by this index, increasing their requirements at the s ame time as their value rises. Moreover, a lower bound 2 h of c N is provided. The value c N is generally much greater than 2 h (H IRSCH [2005] has estimated between 3 and 5 tim es greater). This amount underestimates the citations of the h mo st cited articles (Hirsch core) and ignores articles with less than h citations. A corre lation between the h -index and the success of 4 a researcher appreciated by his peers has been obtained [H IRSCH , 2005], and the future success of a researcher could be predicted by this value [H IRSCH , 2007]. The h -index has been extensively studied (see reviews by B ORNMANN & D ANIEL [2007]; A LONSO ET AL . [2009]; and the stochastic model by B URRELL [2009]) and important mathem atical properties have been f ulfilled [G LÄNZEL , 2006]. However, limitations have been found, some of which are shown below. This index depends on the scientific field and the number of collaborations. It is not appropriate, therefore, to compare researcher s from different scien tific fields, due to different habits of publication, citation, and collaboration. This problem may be corrected, since the maximum h value obtainable in each field strong ly correlates with the impact factors of the jour nals in the field, a reference h -index can be estimated in each scientific field [I MPERIAL & R ODRÍGUEZ -N AVARRO , 2007]. The b -index [B ORNMANN ET AL ., 2007] is an alternativ e that indica tes the num ber of articles in the 10% most cited publications in a field, cons idering IS I-ESI percentiles for exam ple. Multiple authorships and self-citations have been investig ated by S CHREIBER [2008a, 2008b]. Concerning the number of collaborators, the 1 h -index [B ATISTA ET AL ., 2006] obtained dividing h by the average number of authors of these h articles, can be used. This index correlates with the number of publications . The index tends to favor, therefore, those with more extensive scien tific careers and is less effective among those with a low number of publications [ C RONIN & M EHO , 2006; S AAD , 2006; V AN -R AN N , 2006]. To differentiate between active and in active researchers and compare scientists at different stages of thei r careers, the growth rate h' ( t ) has been proposed, being t the number of years since the publicatio n of the first article [L IANG , 2006; B URRELL , 2007; R OUSSEAU & Y E , 2008]. As an alternative, the h -index can be calcu lated for a certain period of time, instead of along the professional life of a researcher. All citations of the most cited articles are not considered in this index . These most cited works contribute to the h -index, but their value is not a ffected by the number of tim es these articles are cited, sin ce the tails of the citation distribution are no t considered. These tails correspond to those publications th at move away from the average impact, either because they have been highly cited ( upper tail), or less cited (lower tail). Based on the definition of the Hirsch core, severa l authors have proposed new indicators. The 5 g -index [E GGHE , 2006] considers all citations of the g most cited articles, and represents an average citation of these g articles. Once the articles have been sorted in decreasing order of citations, g is the largest value, such that the first g articles h ave at least 2 g citations. As a m atter of fact, the h -index and the g -ind ex are special cases of a family of Hirsch index variants [S CHREIBE R , 2010]. Similarly, the A -index (average citation) and the AR -index (considering the age of the articles) [J IN ET AL ., 2007] have the particularity of taking into acc ount the citations of the Hirsch core. However, as stated above, a heavy upper tail may correspond to the work of m a ny authors included in large research lines that generate many citations. This index penalizes sele ctive researchers , that is, those produc ing a moderate number of high impact articles as opposed to large producers of moderate impact articles. Although this index has proven to be useful in identifying relevant researchers in a field, empirical evidence has shown it does not di scriminate among researchers situated at intermediate levels and penalizes sele ctive producers versus large producers [C OSTAS & B ORDONS , 2007]. Cases with similar values of h, where citation curves are intersected, are especially questioned due to som e research ers presenting higher levels of citations at the beginning of the curve and lower levels at the end. Addition ally, this index is not consistent [W ALTMAN & V AN -E CK , 2009]. That is, the effect of incorporating a new paper with a given number of citations may be different between researchers, increasing the value of h in some cases and maintaining its value in others. Finally, some variants have been published in order to improve the accuracy of the h - index: the tapered h -index [A NDERSON ET AL ., 2008], the R m -index [P ANARETOS & M ALESIOS , 2009], the w -index [W OHLIN , 2009], and the e -in dex [Z HANG , 2009]. The h 2 lower, h 2 center, and h 2 upper as well as the sRM value [B ORNMANN ET A L ., 2010], represent new approaches providing additional information that increase the accuracy of the h -index. In this work, a comp lement to the h -index th at increases the c onsistency of the indicator and favors selective authors against large pr oducers is presented. This approach also increases the accuracy of the h -index giving information about the shape of the citation distribution. The main difference with respec t to the variants which have been proposed previously ( g -index, A -index, AR -index, h 2 upper, tapered h -index, R m -index, w -index, 6 and e -index) is that all of them are a function of all citations included in a core of most cited papers. By contrast, we establish an upper limit to the m aximum numb er of citations considered for each publication in order to reduce the effect that iso lated successes and/or large collabo rations may have on the fina l result (as was pointed out by Hirsh). This upper limit can be modified without further changing the radius of the central index. 2. Central indexes Given the published articles of an author in decreasing order of citations, let i c be the number of citations received by the pub lication i p 12 N (c c c ) , and let j j ci i1 Nc be the aggregated number of citations of the j most highly cited papers. The citation distribution is obtained plotting th e number of citations versus the position of the articles. Connecting these points, the citation curve is obtained. The h -index is the largest integer number tha t satisfies h ch , that is, i hm a x iZ : c i . Graphically, the intege r part of the intersec tion point between citati on curve and the first quadrant bisector is h . This is indicated in Figure 1. 2 Hh is a lower bound for the number of citations of those papers in the Hirsch core. The upper tail U is the excess citations received by the Hirsch core over the lo wer bound. The lower tail L is the number of citations received by those papers outsid e the Hirsch core. The following re lationships are satisfied: c h c h cc N HUL , UN H , LN N . The relative weight of the cita tion distribution tails is given by c NH . According to H IRSCH [2005] estimations, if c NH 3 the tails of the distri bution are light, while if c NH 5 the tails are heavy. The h - index penalizes those researchers who present heavy tails, especially those with a great tail ratio UL . 7 An example with the citation curves of two res earchers is shown in Figure 1 . The first researcher presents higher citation levels at the beginning and lower levels at the end of the curve. Therefore, two different profiles of researchers are appreciated , one more selective and another more massive in the production of papers. However, both scientists have the sam e h -index. A researcher may present less h -index than another, although it does not necessarily indicate the former presents a less successful career than the latter. The problem of discriminating between two distributions with sim ilar h- index but significantly differe nt distribution ta il ratios is presented in Figure 1 . As can be appreciated, the higher the rate between ta ils is presented, the better average citations per article is obtained. In the above cases, it seem s r easonable to measure part of U and L in order to comp le ment t he h -index with the area around H . Thus, the discrimination capacity is increased. This idea allows us to intr oduce the following index . Central area index Let E (F ) be the upper (lower) area next to H , that is, the part of the upper tail U (lower tail L ) in the citation distribution c losest to H . The lower area corresponds to those articles that will likely contribu te to increasing the value of h in the f uture, since they are closer to the Hirsch core. The upper area includes those citations that will form part of H at the time the h -index increases its value. Therefore, it seem s reasonable to include this area and increase, in this wa y, the discrim ination capacity of the index. The central area index of radius j is defined as the citations of the h+j most cited papers limited to the num ber of citations of paper h-j . That is, the citations of those papers in the Hirsch core, restricted by the citations of paper h-j , jointly with the citations of papers from h+1 to h+j . The geometrical representati on is showed in Figure 2. The arithmetic definitio n of the index of radius j is the following: hj jh j i ih j1 A (h j) c c , j 1 , . . . , h 1. Note that 2h 1 h1 c AN includes the total upper tail U . Although the radius could be defined for j h , in this case, it would only be adding part of the lower tail. 8 Figure 3 shows the central area index of radius j h/ 2 (integer part) for two citation distributions. In the case of distribution i D the central area index is i ji i AH E F , i 1 , 2 . As mentioned above, authors whose citation di stributions have heavy tails are penalized by the h -index . However, the central area index of these authors grows faster than those with less heavy tails, increasing its capacity of discrimination. Selective researchers are also penalized by the h -index . However, the central area index solves this problem. For example, suppose a re searcher has 10 publications, the least of which have 20 citations. Then h1 0 , which represents only 100 citations. However, 1 A2 0 0 , that is, twice the number of represented citations. Central interval index The central interval index of radius j is defined as the aggreg ated citations of the articles from h-j to h+j : hj ji ih j I c , j 1 ,..., h 1. That is, the citations at the in terval hj , h j . Note that 2h 1 h1 h1 c IAN . The geometrical representation is shown in Figure 2. The central interval index of radius j h/ 2 (integer part) for tw o citation distributions is shown in Figure 3. In the case of distribution i D the central interval index is i ji i IG F , i 1 , 2 . Comparison among central indexes. Both indexes have the same area in the lower tail. Howe ver, significant diff erences between both indexes are appreciated in the upper tail. T hus while central interv al indexes add citations of articles to the left of h , the central area i ndexes add zones of variable size in the upper tail. Lets now look at differences between both indexes for two authors with the same h , one more selective than the ot her. Increasing the radius in one unit and reducing the comparison to the upper tail, where differences exist, the central inte rval index adds to 9 the selective author the height of the rectangle R, as shown Figure 3. However, the central area index also adds to the selective author the area R . For this reason, the central area index is more beneficial for selective authors. As an author is more selective, the height of R increases and the area of R also increases in a greater proportion. In the following section, an empirical app lica tion determines an optimal radius of the central indexes, obt aining the value of j that best describes the central shape of the citation distribution. 3. Empirical application The behavior of central inde xes for researchers who have received the Price Medal is analyzed in this section. Data about these scientists was obtained from the ISI Web of Science database in February 2010. To estim ate the predictive capacity of indexes for five and ten years ahead, and their comparison with the h -index, the cited articles and the number of citations obtained in 1999, 2004, and 2009, have been considered. In order not to distort further analysis, especia lly regression analysis , only the 15 existing and currently productive scie ntists were considered. The objective consists in obtaining jj A , I , j 1 ,..., h 1 , at instant t and es timating the value of j (optimal radius) mo st correlated with kk A , I , k j ,..., h 1 , at instant t1 , t 1 , 2 , and t2 , t1 , that is, the future indexes. Table 1 shows, for each author, the year of the first article published in the database, the total number of cited articles and the tota l citations in 1999, 2004, and 2009. This table also shows the evolution of the h- index. Figure 4 shows the citation curv es of four researchers. Three cu rves are shown, the closest to the origin corr esponds to 1999, followed by 2004 a nd the farthest to 2009. The value 100 has been taken as maximum onl y for clarity. This plot allows us to observe the evolution of the h -index, and also to distinguis h between selective and la rge producer researchers. As an example, Mc Cain and Small show a m ore selective behavior than Egghe and Garfield, respectively. 10 Production-impact scatter plots ar e presented in Figure 5. As shown, linear correlation between the number of articles and the num ber of citations exists. Authors lo cated above the regression line show a more select ive behavior than those below this line. Thus, the more selective authors of the sa mple are Sm all and Garfield, respectiv ely. Table 2 shows the central indexes of the years consider ed. These indexes can be obtained up to a radius of 24 for some authors, bu t as the radius incre ases the num ber of data in each column of the table is reduce d. Data has b een shown until radius 10 to ensure that later the correlation coefficient is calculated with m ore than half of the sample data (at least 9 out of 15). This ta ble is useful in estimating future success. Lets see some examples using radius 7 as re feren ce, approximately half the average h -index for the first period. It will be shown later th at this indicator provides good estimations for five year predictions. As can be seen in the case of Leydesdorff, the area index varies from 1 A9 7 to 7 A 171 in 1999, a significant increment that reveals the evolution of the h -index in following periods (2004 and 2009). Indeed, this author has an h -index of 9, 13, and 21, respectiv ely. Something similar can also be seen in the case of McCain, among others. These exampl es suggest the area i ndexes obtained in a period, predict the increase in the following period. Lets now see a comparison between two authors with the same h . McCain and Vlachy have 1999 h1 1 . 6 A in the case of McCain (because 7 A is not defined) is greater than the case of Vlachy, which es timates a higher future h -index; which holds true (15 vs. 11) in Table 1. Something similar happens with Ingwersen and Vinkler, for which 1999 h7 . 7 A in the case of Ingwersen is greate r than in the case of Vinkler, which estimates a higher future h -index; which also holds true (12 vs. 10) in Table 1. The same conclusion can also be observed for a period of ten years. Although area indexes have been taken as reference, something simila r o ccurs in the case of interval indexes. Now, as an example, lets consider a cas e where the d iscrimination capacity of the central indexes compared to the h -index is appreciated. Braun has 1999 h greater than Small. However, the cen tral indexes from a cer tain radius are higher for the later author. Attending to these indicators, the second auth or seems more selec tive, which is true according to total citations and the p roduction-impact scatter plot. 11 Since the central index is an aggregation of citations, its representation with respect to the radius is an increasing f unction, as can be seen in Figur e 6. The first plot shows that McCain’s area indexes are higher than those of Egghe, indicating the first author is more selective than the second. Something simila r can be seen with th e interval index in the second plot. Table 3 shows the linear correlation coeffi cients among indexes for 5 and 10 years. Matrices of order 10 to ensure the correlati on coefficient is calculated with more than half of the researchers (at l east 9 out of 15) are shown. As can be seen, the area indexes for 1999 are strongly correlated with thos e for 2004, so they look like good estimators for 5 years. In all cases, correlations are higher than 0.94. The strongest correlations are located close to the main diagonal of the matr ix. From the fifth element, all coefficients on the diagonal are greater th an the correlation between h -indexes 1999 2004 corr ( h , h ) 0.977 . As can be seen, all elements in column 7 are also higher than this. Therefore, 7 A seems a good estimator for five year s and the radius is about half the average h -index of the sample. Area indexes for 1999 also show high correlat ions with 2009, alt hough slightly lower than those mentioned in the previous pa ragraph, making them also good estim ators for 10 years. All of the coefficients are greater than the correlation between the h -indexes 1999 2009 corr (h ,h ) 0.812 . As can be seen, all elements in column 7 are higher than 0.9. Finally, the area indexes for 2004 also presen t correlations with the year 2009. Most of the elements (including a ll of them in colum n 7) are higher than the correla tion between h -indexes 2004 2009 cor r (h , h ) 0.889 . With respect to interval indexes, something very sim ilar occurs. Correlations are also high in all cases. In order to better appr eciate what indicators provide the b est correlations, the differences between correlati ons for central indexes are also shown in Table 3. As can be seen, most of the elements of these matrices are positiv e, which means the correlations for the area index are gr eater than f or the interval index (only 10 out of 165 items are negative). 12 4. Conclusions The h -index is a bibliometric indicator that attem pts to measure the success of a researcher with just a part of the total am ount of publications and citations. Due to not considering all production and impact, this i ndex corrects biases of mass collaborations and punctual successes, which may not be sign ificant in the resear cher’s career as a whole. However, different citation distributi ons, like those of a selective resea rcher and a large producer, may cause sim ilar h -indexes, and in these cases , it is not possible to distinguish between thes e researchers using the h -index exclusively. In this paper two com plements to the h -index, the area and the interval indexes, have been proposed with the aim of increas i ng the capacity of discrimination among researchers with similar h, and improving the prediction of future successes. These indicators consider some areas that are la rger for sele ctive authors than for large producers. Thus, a problem describe d in the litera ture about the h -index, which penalizes selective researchers compar ed to large producers, is corrected. Both central indexes are good estimators and correlations are generally higher for the area index than for the interval index. Moreove r, a radius that well des cribes the shape of the citation distribution has been estimated empirically. This radius is about half the average h -index of researchers being evaluated. Finally, we would like to point out that the ar ea index is not considered a substitute, but a complement to the h -index, especially in an evaluation process where doubts am ong researchers might exist. Materials and Methods The publications and citations for those scien tists listed in Table 1 were obtained from ISI Web of Science data base in February, 2010. 13 References 1. A LONSO , S., C ABRERIZO , F. J., H ERRERA -V IEDMA , E., H ERRERA , F. (2009), h-Index: A review focused in its va riants, computation and sta ndardization for different scientific fields. Journal of Informetrics , 3(4), 273–289. 2. A NDERSON , T., H ANKIN , R., K ILLWORTH , P. (2008), Beyond the Durfee square: Enhancing the h-index to sc ore total publication output. Scientometrics , 76(3), 577– 588. 3. B ATISTA , P. D., C AMPITELI , M. G., K INOUCHI , O., M ARTINEZ , A. S. (2006), Is it possible to compare researchers with different scientific interests ? Scientometrics , 68(1), 179–189. 4. B ORNMANN , L., D ANIEL , H. D. (2007), What do we kn ow about the h-index? Journal of the American Society fo r Information Science and Technology , 58(9), 1381–1385. 5. B ORNMANN , L., M UTZ , R., D ANIEL , H. D. (2007), The b-index as a measure of scientific excellence. A promis ing supplement to the h-index? Cybermetrics , 11(1), paper 6. 6. B ORNMANN , L., M UTZ , R., D ANIEL , H. D. (2010), The h index research output measurement: Two approaches to enhance its accuracy. Journal of Informetrics , 4(3), 407–414. 7. B URRELL , Q. L. (2007), Hirsch index or Hirs ch rate? Some thoughts arising from Liang’s data. Scientometrics , 73(1), 19–28. 8. B URRELL , Q. L. (2009), On Hirsch’s Egghe’s and Kosmulski’s h(2). Scientometrics , 79(1), 79–91. 9. C OSTAS , R., B ORDONS , M. (2007), The h-index: advantages, limitations and its relation with other bibliometric indicators at the m icro-level. Journal of Informetrics , 1(3), 193–203. 10. C RONIN , B., M EHO , L. I. (2006), Using the h-index to rank influential information scientists. Journal of the American Society fo r Information Science and Technology , 57(9), 1275–1278. 11. E GGHE , L. (2006), Theory and practise of the g-index. Scientometrics , 69(1), 131– 152. 12. G LÄNZEL , W. (2006), On the h-index. A mathema tical approach to a new measure of publication activity an d citation impact. Scientometrics , 67(2), 315–321. 13. H IRSCH , J. E. (2005), An index to quantify an in dividual’s scientific research output. Proceedings of the National Academy of Sciences , 102(46), 16569–16572. 14. H IRSCH , J. E. (2007), Does the h-inde x have predictive power. Proceedings of the National Academy of Sciences , 104(49), 19193–19198. 15. I MPERIAL , J., R ODRÍGUEZ -N AVARRO , A. (2007), Usefulness of Hirsch’s h-index to evaluate scientific research in Spain. Scientometrics , 71(2), 271–282. 16. J IN , B. H., L IANG , L. M., R OUSSEAU , R., E GGHE , L. (2007), The R- and AR-indices: Complementing the h -index. Chinese Science Bu lletin , 52(6), 855–863. 14 17. L IANG , L. (2006), h-index sequence and h- index matrix: Constructions and applications. Scientometrics , 69(1), 153–159. 18. P ANARETOS , J., M ALESIOS , C. (2009), Assessing scientific research perform ance and impact with single indices. Scientometrics , 81(3), 635–670. 19. R OUSSEAU , R., Y E , F. Y. (2008), A proposal for a dynamic h-type index. Journal of the American Society for Information Science and Technology , 59(11), 1853–1855. 20. S AAD , G. (2006), Exploring the h-index at th e author and journal levels using bibliometric data of produc tive consumer scholars and business-related journals respectively. Scientometrics , 69(1), 117–120. 21. S CHREIBER , M. (2008a), A modification of the h-index: The h(m)-index accounts for multi-authored manuscripts. Journal of Informetrics , 2(3), 211–216. 22. S CHREIBER , M. (2008b), The influence of self-citation corrections on Egghe’s g- index. Scientometrics , 76(1), 187–200. 23. S CHREIBER , M. (2010), A new family of old Hirsch index variants. Journal of Informetrics , 4(4), 647–651. 24. V AN -R AAN , A. F. J. (2006), Comparisons of the Hirsch-index w ith standard bibliometric indicators and with peer judgment for 147 chem istry research groups. Scientometrics , 67(3), 491–502. 25. W ALTMAN , L., V AN -E CK , N. J. (2009), A taxonom y of bibliometric perform ance indicators based on the pr operty of consistency. http://repub.eur.nl/resource/pub_15182. Accessed January, 2 011. 26. W OHLIN , C. (2009), A new index for the citation curve of researchers. Scientometrics , 81(2), 521–533. 27. Z HANG , C. T. (2009), The e-index, complement ing the h-index for excess citations. PLoS ONE , 4(5), e5429. 15 h h U 2 H L 1 art icl es citati ons D 2 : Lar ge pro ducer researc her D 1 : S el ect iv e re sea r che r 12 12 1 2 20 30 100 150 50 150 50 3 300 20 15 50 150 0 33 300 30 10 12 Exam ple: , , h = h = 1 0 , , , , / ( / ) /, ( / ) pp NN HU L L U 11 2 2 12 12 1 c1 c2 (n n ) HU L HU L UU LL U 1 L 2 Figure 1. Two citation curves with the same h -index but different average citations per article. 16 G F articles cit ations h 2 3h 2 E F articles citations h h 2 3h 2 h h h (a) (b) I j =G+F A j =H+E+F H Figure 2. Central area index (a) and centr al interval index (b) of radius h j 2 . 17 G 1 G 2 F 1 F 2 D 1 D 2 arti cles citati ons h 2 3h 2 E 1 E 2 F 1 F 2 D 1 D 2 articles citations h h 2 3h 2 h h h (a) (b) I j 1 =G 1 +F 1 I j 2 =G 2 +F 2 I j 1 >I j 2 (G 1 -G 2 >F 2 -F 1 ) A j 1 =H+E 1 +F 1 A j 2 =H+E 2 +F 2 A j 1 >A j 2 (E 1 -E 2 >F 2 -F 1 ) H R Figure 3. Comparison between the central area index (a) and the central interval index (b) of radius h j 2 , for two citation curves with the same h -index. Table 1. The production and impact of the researchers. Year of Author the first art icle 1999 2004 2009 1999 2004 2009 1999 2004 2009 1999 2004 2009 Braun, T 1958 135 152 170 1966 2498 3116 24 27 30 576 729 900 Egghe, L 1978 47 78 122 299 571 1277 10 12 18 100 144 324 Garfield, E 1954 163 174 180 3687 4298 5294 25 26 29 625 676 841 Glänzel, W 1983 52 74 112 616 991 2228 14 18 28 196 324 784 Ingwersen, P 1982 18 27 35 239 686 1160 7 12 16 49 144 256 Leydesdorff, L 1981 38 54 107 235 477 1541 9 13 21 81 169 441 McCain, KW 1983 25 32 40 328 761 1261 11 15 17 121 225 289 Moed, HF 1985 31 50 64 386 804 1608 12 16 22 144 256 484 Rousseau , R 1986 40 76 122 165 494 1339 6 11 20 36 121 400 Schubert, A 1981 75 104 121 726 1126 1904 14 18 24 196 324 576 Small, H 1961 59 64 69 2947 3543 4296 21 24 25 441 576 625 Van-Raan, AFJ 1976 47 64 78 488 909 1750 13 17 24 169 289 576 Vinkler, P 1986 20 26 31 149 266 4 11 7 10 13 49 100 169 Vlachy, J 1963 41 42 43 361 374 382 11 11 11 121 121 121 Zitt, M 1991 6 12 23 17 78 267 3 6 10 9 36 100 Average 1977 53,1 68,6 87,8 840,6 1191, 7 1855,6 12,5 15,7 20,5 194,2 282,3 459,1 H=h 2 Cited articles Citations h-index Gar fie ld 0 20 40 60 80 100 1 2 14 16 18 1 1 0 1 articles citations Egghe 0 20 40 60 80 100 1 21 41 61 81 101 articles citations McCa i n 0 20 40 60 80 100 1 2 14 16 18 1 articles citati ons Small 0 20 40 60 80 100 1 2 14 16 18 1 1 0 1 articles citations Figure 4. Citation curves for some researchers in 1999, 2004, and 2009. 20 Year 199 9 0 1000 2000 3000 4000 0 20 40 60 80 100 120 140 160 180 articles citations Small Garfield Year 2004 0 1000 2000 3000 4000 5000 0 20 40 60 80 100 120 140 160 180 articles citations Sm all Garfield Year 2009 0 1000 2000 3000 4000 5000 6000 0 2 0 40 60 80 100 120 140 160 180 200 articles citations Sm all Gar field Figure 5. Production-imp act scatter plot. 21 Table 2. Central indexes up to radius 10. Author A 1 A 2 A 3 A 4 A 5 A 6 A 7 A 8 A 9 A 10 I 1 I 2 I 3 I 4 I 5 I 6 I 7 I 8 I 9 I 10 Braun, T 597 618 660 701 722 797 817 869 903 950 69 114 160 207 254 304 353 4 04 455 508 Egghe, L 109 134 142 168 175 185 194 218 231 - 29 50 70 93 115 137 160 192 231 - Garfield, E 870 917 985 1197 1 300 1379 1541 1694 1935 2086 88 147 208 277 350 425 504 590 690 798 Glänzel , W 237 275 298 330 341 352 369 384 398 411 45 77 1 08 141 173 205 237 269 302 336 Ingwersen, P 70 106 155 166 211 230 - - - - 25 46 77 110 163 230 - - - - Leydesdorf f, L 97 112 119 136 155 161 171 179 - - 27 46 64 84 107 129 153 179 - - McCain, K W 142 171 204 218 225 240 264 286 301 320 34 59 85 110 135 160 189 224 264 320 Moed, HF 1 67 186 221 228 249 267 283 293 297 315 37 60 85 109 135 162 191 221 249 284 Rousseau, R 53 63 69 80 88 - - - - - 21 36 51 68 88 - - - - - Schubert, A 223 248 282 324 336 355 372 388 403 428 43 72 102 135 168 201 234 268 303 341 Small, H 543 581 688 806 869 944 987 1066 1164 1187 68 113 161 214 269 328 389 454 526 597 Van-Raan, AFJ 182 194 226 255 265 274 283 302 315 335 39 64 91 119 146 172 198 226 255 287 Vinkler, P 87 96 119 124 132 140 - - - - 27 44 65 86 110 140 - - - - Vlachy , J 153 162 187 196 222 230 246 262 275 286 36 58 82 106 132 158 186 216 249 286 Z i t t , M 1 3 1 5 - ------- 9 1 5 -------- Braun, T 755 805 853 876 921 964 986 1046 108 5 1123 80 133 186 238 291 344 397 452 507 563 Egghe, L 179 201 222 234 252 280 310 344 365 380 39 66 94 122 150 180 214 254 297 343 Garfield, E 954 1004 1099 1586 1716 2001 2064 2105 2259 2389 90 153 219 305 396 500 606 711 819 934 Glänzel , W 342 376 393 423 464 491 505 549 571 583 54 91 127 163 200 238 275 315 355 394 Ingwersen, P 213 224 332 356 369 417 473 575 611 636 43 71 108 146 183 227 281 359 447 543 Leydesdorf f, L 178 209 22 8 2 54 262 284 298 306 318 328 35 59 84 110 136 164 193 222 252 282 McCain, K W 239 278 339 351 422 450 458 493 506 567 44 74 108 141 179 218 255 295 336 387 Moed, HF 3 18 348 375 388 434 447 469 513 585 605 52 88 123 157 194 231 269 310 357 405 Rousseau, R 142 152 162 179 195 209 222 231 248 258 34 56 78 101 125 149 174 199 228 258 Schubert, A 341 357 373 401 428 465 489 501 522 550 53 87 121 154 188 223 259 294 330 368 Small, H 623 666 686 726 897 1041 1091 1122 1211 1281 73 120 166 213 267 327 387 447 511 579 Van-Raan, AFJ 306 337 353 394 444 469 482 504 525 545 51 85 119 154 191 229 266 304 343 383 Vinkler, P 148 163 169 193 198 219 229 247 254 - 36 58 79 103 126 153 181 216 254 - Vlachy , J 153 171 188 197 223 236 252 268 279 294 36 59 83 107 133 160 189 220 253 294 Zitt, M 52 57 64 73 76 - - - - - 20 33 46 61 76 - - - - - Braun, T 958 986 1014 1067 1144 1218 1266 1312 1356 1379 90 149 208 267 328 390 452 514 576 638 Egghe, L 341 358 390 419 447 474 511 555 586 623 53 88 124 159 195 232 271 312 354 399 Garfield, E 985 1120 1146 1222 1368 1439 2124 2590 2674 2733 94 158 221 286 356 427 528 650 774 897 Glänzel , W 812 839 866 916 964 988 1033 1097 1120 1196 84 139 194 249 304 358 413 470 526 584 Ingwersen, P 301 342 394 417 504 523 577 586 649 733 49 82 118 153 194 235 281 327 379 443 Leydesdorf f, L 461 557 57 7 6 11 627 703 732 760 785 798 62 107 152 195 237 283 329 376 422 468 McCain, K W 404 420 450 479 528 616 637 693 711 769 59 98 138 179 220 266 313 365 417 475 Moed, HF 548 609 629 703 791 827 876 892 919 969 68 115 161 210 263 317 372 424 475 529 Rousseau, R 438 456 491 508 540 570 586 614 630 666 60 99 139 178 218 258 298 339 380 423 Schubert, A 623 647 712 734 755 793 813 833 868 901 73 122 172 221 269 317 365 413 462 511 Small, H 675 721 853 917 959 1132 1170 1309 1456 1502 77 127 181 237 294 358 422 493 571 648 Van-Raan, AFJ 648 671 715 758 856 896 934 955 990 1022 76 125 175 226 280 335 390 445 500 554 Vinkler, P 219 241 259 276 292 300 324 344 353 361 43 71 97 124 152 180 209 240 272 305 Vlachy , J 153 173 190 199 225 238 254 270 281 299 36 61 85 109 135 162 191 222 255 299 Zitt, M 137 161 169 193 204 221 230 237 261 - 33 56 79 103 128 155 182 211 261 - 2009 2004 1999 22 0 400 800 1200 1600 centr al a rea radi us citation s Egghe 1999 Egghe 2004 Egghe 2009 McCain 1999 McCain 2004 McCain 2009 0 400 800 1200 1600 159 1 3 1 7 central int erval rad ius citations Egghe 1999 Egghe 2004 Egghe 2009 McCain 1999 McCain 2004 McCain 2009 Figure 6. Comparison of central indexes for two authors. 23 Table 3. Indexes correlations. A 1 A 2 A 3 A 4 A 5 A 6 A 7 A 8 A 9 A 10 I 1 I 2 I 3 I 4 I 5 I 6 I 7 I 8 I 9 I 10 A 1 0,986 I 1 0,977 0,009 A 2 0,985 0,98 7 I 2 0,976 0,979 0,009 0,007 A 3 0,977 0,98 0 0,978 I 3 0,970 0,975 0,975 0,007 0,005 0,003 A 4 0,967 0,97 0 0,962 0,967 I 4 0,965 0,972 0,974 0,975 0,002 -0,001 -0,012 -0,008 A 5 0,973 0,977 0,973 0,979 0, 981 I 5 0,962 0,969 0,971 0,974 0,973 0,011 0,008 0,002 0,00 5 0, 007 A 6 0,964 0,96 9 0,967 0,978 0,981 0,977 I 6 0,947 0,956 0,966 0,970 0,973 0,962 0,017 0,013 0,002 0,00 7 0,008 0,016 A 7 0,961 0,966 0,966 0,977 0, 981 0,977 0,986 I 7 0,934 0,945 0,957 0,964 0,971 0,964 0,967 0 ,026 0,021 0,009 0,01 2 0,010 0,013 0,019 A 8 0,956 0,962 0,963 0,973 0,977 0,974 0,986 0,987 I 8 0,911 0,924 0,941 0,951 0,965 0,965 0,964 0,967 0,045 0,039 0,022 0,02 2 0, 012 0,009 0, 021 0,020 A 9 0,952 0,959 0,960 0,971 0, 976 0,972 0,985 0,986 0,988 I 9 0,884 0,899 0,920 0,933 0,954 0,961 0,961 0,964 0,963 0,068 0,060 0,040 0,03 7 0,022 0,012 0,024 0,022 0,024 A 10 0,948 0,955 0,957 0,968 0, 974 0,970 0,984 0,986 0,988 0,990 I 10 0,850 0,866 0,893 0,910 0,937 0,949 0,957 0,961 0,962 0,966 0,098 0,088 0,064 0,05 9 0, 037 0,021 0, 027 0,025 0,026 0,024 Average 0,967 0,96 9 0,966 0,973 0,978 0,974 0,985 0,986 0,988 0,990 Average 0 ,938 0,943 0,950 0,954 0,962 0,960 0,962 0, 964 0, 963 0,966 Sum 0,292 0,240 0,130 0,13 5 0,096 0,070 0,090 0,067 0,050 0,024 A 1 A 2 A 3 A 4 A 5 A 6 A 7 A 8 A 9 A 10 I 1 I 2 I 3 I 4 I 5 I 6 I 7 I 8 I 9 I 10 A 1 0,815 I 1 0,820 -0,005 A 2 0,836 0,84 1 I 2 0,820 0,826 0,016 0,014 A 3 0,843 0,84 9 0,830 I 3 0,818 0,825 0,770 0,025 0,024 0,059 A 4 0,846 0,85 2 0,833 0,826 I 4 0,822 0,829 0,777 0,768 0,024 0,023 0,056 0,05 8 A 5 0,853 0,859 0,842 0,835 0, 825 I 5 0,829 0,836 0,787 0,779 0,755 0,024 0,023 0,055 0,05 6 0, 070 A 6 0,864 0,87 1 0,860 0,853 0,843 0,840 I 6 0,836 0,843 0,797 0,790 0,767 0,732 0,029 0,028 0,062 0,06 3 0,076 0,108 A 7 0,914 0,920 0,905 0,913 0, 910 0,906 0,906 I 7 0,857 0,864 0,827 0,822 0,803 0,771 0,800 0 ,057 0,056 0,078 0,09 1 0,107 0,135 0,106 A 8 0,922 0,928 0,913 0,926 0,926 0,922 0,926 0,926 I 8 0,878 0,886 0,857 0,853 0,838 0,810 0,841 0,834 0,044 0,042 0,056 0,07 3 0, 088 0,112 0, 085 0,092 A 9 0,928 0,934 0,923 0,936 0, 937 0,933 0,937 0,937 0,943 I 9 0,888 0,897 0,877 0,876 0,865 0,840 0,869 0,864 0,858 0,040 0,038 0,046 0,06 0 0,072 0,092 0,068 0,073 0,085 A 10 0,916 0,924 0,918 0,931 0, 933 0,928 0,934 0,934 0,938 0,938 I 10 0,880 0,891 0,891 0,892 0,884 0,864 0,889 0,886 0,882 0,868 0,036 0,032 0,027 0,04 0 0, 048 0,064 0, 044 0,048 0,056 0,071 Average 0,874 0,88 6 0,878 0,889 0,895 0,906 0,926 0,933 0,940 0,938 Average 0 ,845 0,855 0,823 0,826 0,819 0,803 0,850 0, 862 0, 870 0,868 Sum 0,291 0,280 0,440 0,44 1 0,461 0,511 0,303 0,213 0,141 0,071 A 1 A 2 A 3 A 4 A 5 A 6 A 7 A 8 A 9 A 10 I 1 I 2 I 3 I 4 I 5 I 6 I 7 I 8 I 9 I 10 A 1 0,872 I 1 0,875 -0,002 A 2 0,889 0,89 3 I 2 0,873 0,879 0,016 0,014 A 3 0,896 0,89 9 0,883 I 3 0,872 0,878 0,871 0,023 0,021 0,012 A 4 0,899 0,90 3 0,886 0,842 I 4 0,877 0,883 0,875 0,857 0,022 0,020 0,011 -0,015 A 5 0,908 0,911 0,901 0,864 0, 865 I 5 0,886 0,892 0,886 0,869 0,856 0,022 0,019 0,015 -0,006 0,009 A 6 0,916 0,92 0 0,908 0,863 0,871 0,844 I 6 0,893 0,899 0,893 0,877 0,865 0,818 0, 023 0,021 0,015 -0,014 0,006 0,026 A 7 0,940 0,941 0,941 0,953 0, 953 0,943 0,940 I 7 0,909 0,916 0,913 0,903 0,894 0,858 0,839 0 ,031 0,025 0,028 0,05 0 0,059 0,085 0,100 A 8 0,934 0,934 0,936 0,967 0,968 0,963 0,960 0,956 I 8 0,921 0,929 0,929 0,926 0,921 0,896 0,881 0,856 0,013 0,005 0,007 0,04 2 0, 047 0,067 0, 079 0,100 A 9 0,939 0,939 0,941 0,969 0, 972 0,968 0,966 0,962 0,963 I 9 0,924 0,933 0,935 0,938 0,937 0,921 0,909 0,888 0,864 0,015 0,006 0,006 0,03 1 0,035 0,048 0,057 0,074 0,099 A 10 0,928 0,928 0,933 0,964 0, 967 0,966 0,965 0,962 0,963 0,962 I 10 0,917 0,928 0,934 0,941 0,943 0,939 0,931 0,913 0,893 0,870 0, 011 -0,000 -0,001 0,023 0,025 0,027 0,034 0,049 0,070 0,092 Average 0,912 0,91 9 0,916 0,917 0,933 0,937 0,958 0,960 0,963 0,962 Average 0 ,895 0,904 0,904 0,901 0,903 0,887 0,890 0, 886 0, 878 0,870 Sum 0,173 0,131 0,092 0,11 2 0,179 0,252 0,270 0,223 0,169 0,092 2004 2009 2009 2009 2004 2009 2009 1999 1999 2004 1999 1999 2004 2004 2009 1999 1999 subtraction of correlations ( area m inus interval) subtraction of correlations ( area m inus interval) subtraction of correlations ( area m inus interval) 2004
Original Paper
Loading high-quality paper...
Comments & Academic Discussion
Loading comments...
Leave a Comment