Friendship Paradox Redux: Your Friends Are More Interesting Than You
Feld's friendship paradox states that "your friends have more friends than you, on average." This paradox arises because extremely popular people, despite being rare, are overrepresented when averaging over friends. Using a sample of the Twitter fire…
Authors: Nathan O. Hodas, Farshad Kooti, Kristina Lerman
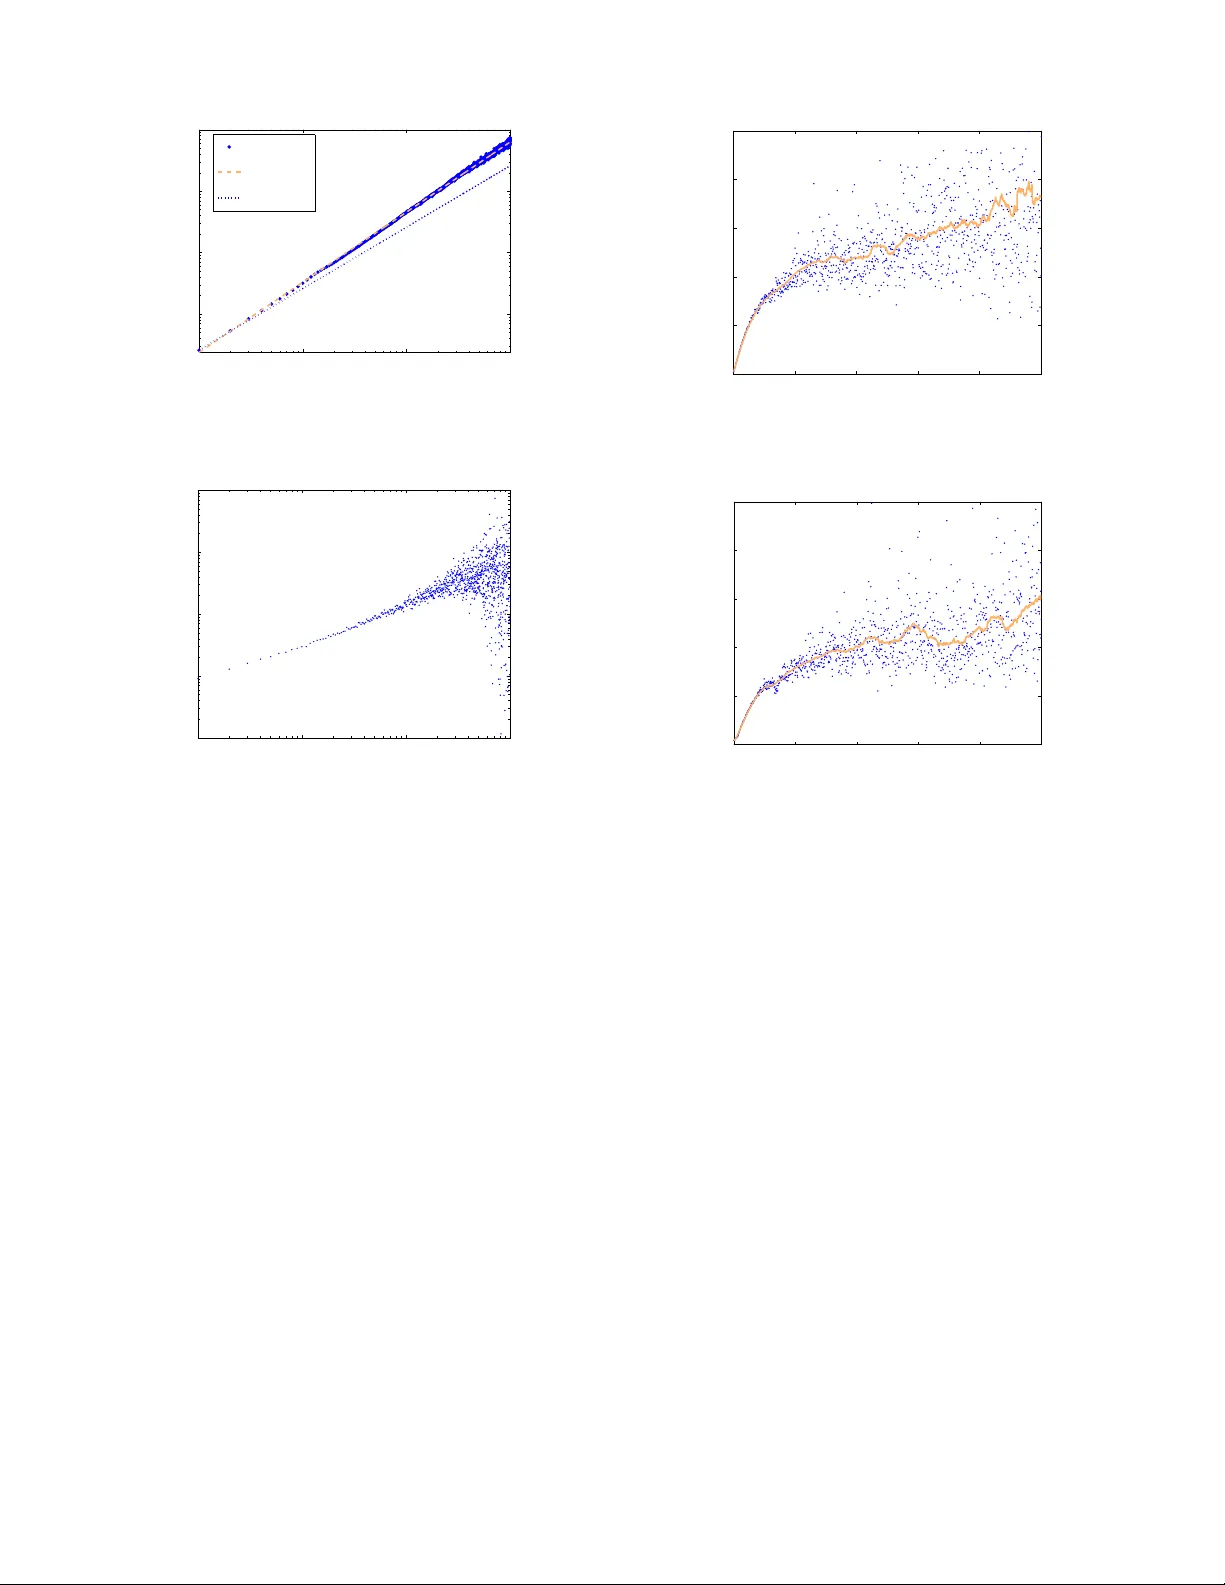
Friendship Paradox Redux: Y our Friends Ar e Mor e Inter esting Than Y ou Nathan O. Hodas USC Information Sciences Institute 4676 Admiralty W ay Marina del Rey , CA 90292 nhodas@isi.edu F arshad K ooti USC Information Sciences Institute 4676 Admiralty W ay Marina del Rey , CA 90292 kooti@usc.edu Kristina Lerman USC Information Sciences Institute 4676 Admiralty W ay Marina del Rey , CA 90292 lerman@isi.edu Abstract Feld’ s friendship paradox states that “your friends ha ve more friends than you, on a verage. ” This paradox arises because extremely popular people, despite being rare, are overrepre- sented when av eraging ov er friends. Using a sample of the T witter firehose, we confirm that the friendship paradox holds for >98% of T witter users. Because of the directed nature of the follower graph on T witter , we are further able to confirm more detailed forms of the friendship paradox: ev eryone you follow or who follo ws you has more friends and follo wers than you. This is likely caused by a correlation we demon- strate between T witter activity , number of friends, and num- ber of follo wers. In addition, we discov er two new paradoxes: the virality paradox that states “your friends receiv e more vi- ral content than you, on average, ” and the activity paradox , which states “your friends are more activ e than you, on av- erage. ” The latter paradox is important in regulating online communication. It may result in users ha ving difficulty main- taining optimal incoming information rates, because follow- ing additional users causes the volume of incoming tweets to increase super-linearly . While users may compensate for increased information flow by increasing their own activ- ity , users become information overloaded when they recei ve more information than they are able or willing to process. W e compare the av erage size of cascades that are sent and re- ceiv ed by ov erloaded and underloaded users. And we show that ov erloaded users post and recei ve larger cascades and they are poor detector of small cascades. Introduction The so-called “Friendship Paradox" or Feld’ s Paradox, states that, on a verage, your friends ha ve more friends than you do. This is due to the overrepresentation of extremely popular individuals in the average of friends (Feld 1991). The para- dox has been empirically demonstrated both online, such as Facebook (Ugander et al. 2011), and offline (Feld 1991; Zuckerman and Jost 2001) social networks. Because peo- ple use their local network to assess themselv es and as sources of information about the greater world (Zucker- man and Jost 2001; Sgourev 2006; W olfson 2000; Y og a- narasimhan 2012; Kanai et al. 2012a), the friendship para- dox leads to systematic biases in our perceptions. F or ex- ample, a majority of people belie ve they possess above av- Copyright c 2024, Association for the Adv ancement of Artificial Intelligence (www .aaai.org). All rights reserved. erage driving skill (McK enna, Stanier , and Lewis 1991; Groeger and Bro wn 1989). Furthermore, many personal characteristics correlate with high network degree, such as the incidence of drug and alcohol use (Tuck er et al. 2011; T ucker et al. 2012), wealth (Morselli and T remblay 2004; Amuedo-Dorantes and Mundra 2007; V an Groenou and V an T ilbur g 2003), and e xtrav ersion (Pollet, Roberts, and Dunbar 2011; Quercia et al. 2012), which may further ef- fect our perceptions. Interestingly , your friends’ superior social connectivity puts them at a greater risk, in aggre- gate, of an infection by a biological pathogen. This fact has been used as a principle for establishing epidemiological early-warning networks, because your friends will be more heavily exposed to pathogens in aggregate (Christakis and Fo wler 2010). Managing one’ s social network requires cog- nitiv e ef fort, which has been linked directly to physiological attributes within the brain (Dunbar 1993; Powell et al. 2012; Bickart et al. 2012; Kanai et al. 2012b). Howe ver , the effect of the friendship paradox on our cognitiv e limitations is not well examined. In online social networks, the friendship paradox has a surprising twist. If we wish to receiv e more information, we can usually choose to incorporate more indi viduals into our online social networks, e.g., by follo wing them on T wit- ter . Howe ver , as we grow our social network, we dramati- cally increase the volume of incoming information, since, as we show in this paper , not only are your friends better con- nected than you, they also tend to be more acti ve, producing more information on av erage than you are willing to con- sume. Thus, increase in information flo w collides with our innate cogniti ve limitations and does not increase our ability to appreciate the totality of our relationships. By increasing the incoming flow of information, we dilute our attention and reduce the visibility of any indi vidual tweet (Hodas and Lerman 2012). Receiving too much information may ex- ceed our ability and desire to maintain existing social con- nections, ev en if they are unreciprocated (Kwak, Chun, and Moon 2011). Thus, users will naturally attempt to regulate the amount of incoming information by tuning the number of users they follo w . In the present work, we consider the evidence for and the consequences of the friendship paradox on T witter , which, as a directional network, presents an opportunity to study the paradox in more detail. In the first part, we demonstrate the present e vidence that the friendship paradox holds, as expected, on T witter . W e expand this analysis to other prop- erties of the friendship network, presenting a full reciprocity friendship paradox: your friends (followees) and followers hav e more friends and follo wers than you do. W e then doc- ument ne w behavioral paradoxes. The friend activity para- dox states that your friends tend to be more activ e than you are. Thus, the behavioral traits that lead one to be well con- nected will also hav e direct influence on information over - load. Y our friends also send and receive content that has higher virality than you do, what we call the virality para- dox . These facts together suggest the glib expression “your friends are more interesting than you are”. In the second part, we explore how the relati ve information load caused by the acti vity paradox alters user behavior , comparing un- derloaded users with overloaded users. W e show that, com- pared to underloaded users, overloaded users both post and receiv e more viral URLs and are less sensiti ve to smaller outbreaks of less popular URLs. A V ariety of Paradoxes on T witter The friendship paradox, as formulated by Feld, is applica- ble to of fline relationships, which are undirected, and it has also been observed in the undirected social network of Face- book (Ugander et al. 2011). W e demonstrate empirically that the friend paradox also exists on T witter . Unlike the friendship relations of the offline world and Facebook, the relations on T witter are directed. When user a follows the activity of user b , he or she can see the posts tweeted by b but not vice versa. W e refer to user a as the follower of b , and b as a friend or followee of a . Note that here friendship is a directed relationship. Figure 1 illustrates a directed social network of a social media site, such as T witter . The user receives information from friends and, in turn, posts information to her or his followers . The friends may themselves recei ve broadcasts from their friends, whom we call friends-of-friends and post tweets to their own followers, whom we call followers-of- friends . Data W e use the T witter dataset presented by (Y ang and Leskov ec 2011), which contains 476 million tweets that are 20-30% of all tweets posted from June to December 2009. W e also used the T witter social network gathered by Kwak et al. (2010), which includes links between all users who joined T witter before August 2009. Since we need both tweets and social links, we only consider users who have posted at least one tweet. The subgraph of such users in- cludes 5.8M users and 193.9M links between them. This graph is used for showing the friendship paradox on T witter . Friendship Paradox The friendship paradox can be stated in four dif ferent ways on a directed graph: i ) On average, your friends (followees) have mor e friends than you do. user f r i e n d s f o l l o w e r s f r i e n d s - o f - f r i e n d s f o l l o w e r s - o f - f o l l o w e r s f r i e n d s - o f - f o l l o w e r s f o l l o w e r s - o f - f r i e n d s Figure 1: An example of a dir ected network of a social media site with information flow links. Users r eceive information fr om their friends and br oadcast information to their follow- ers. ii ) On average , your followers have more friends than you do. iii ) On average , your friends have mor e followers than you do. iv ) On aver age, your followers have mor e followers than you do. W e empirically validate each statement above. The first statement says that, on av erage, a user’ s friends are better connected than he or she is, i.e., they follo w more people than he or she does. T o v alidate this statement, for each user in the dataset we count ho w many friends she has, i.e., how many other users she follo ws. Then, for each friend, we count how many other users the friend follows, and average ov er all friends. T op Figure 2( i ) plots the a verage number of friends-of-friends (ordinate axis) vs the number of friends (abscissa) a user follows for the users with fewer than 1000 friends. About 99.7% of users had fewer than 1000 friends. The line of unit slope sho ws equality of connectedness. The probability density function (PDF) of the ratio of the average friend’ s connectivity to a user’ s connectivity , sho wn in bot- tom Figure 2( i ), is > 1 for 98% of the users, peaking around 10. In other words, in the T witter follo wer graph, a typical friend of a user is ten times better connected than the user . Not only are a user’ s friends better connected, but so are the user’ s followers. T op Figure 2( ii ) plots the average number of friends a user’ s followers have vs the number of friends the user has for users with fewer than 1000 followers (99.6% of all users). Bottom Figure 2( ii ) shows the PDF of the ratio of the friends-of-followers to user’ s friends. Again, 10 0 10 1 10 2 10 3 10 0 10 1 10 2 10 3 10 4 # friends Avg. # friends−of−friends y = x 10 0 10 1 10 2 10 3 10 0 10 1 10 2 10 3 10 4 # friends Avg. # friends−of−followers y = x 10 0 10 1 10 2 10 3 10 0 10 1 10 2 10 3 10 4 10 5 # followers Avg. # followers−of−friends y = x 10 0 10 1 10 2 10 3 10 0 10 1 10 2 10 3 10 4 # followers Avg. # followers−of−followers y = x 10 0 10 1 10 2 10 3 10 4 10 5 0 0.05 0.1 0.15 Avg. #friends−of−friends / #friends PDF 10 0 10 1 10 2 10 3 10 4 10 5 0 0.05 0.1 0.15 Avg. #friends−of−followers / # friends PDF 10 0 10 1 10 2 10 3 10 4 10 5 0 0.02 0.04 0.06 0.08 Avg. #followers−of−friends / #followers PDF 10 0 10 1 10 2 10 3 10 4 10 5 0 0.05 0.1 0.15 Avg. #followers−of−followers / #followers PDF ( i ) ( ii ) ( iii ) ( iv ) Figure 2: V ariants of the friend paradox on T witter showing that your ( i ) friends and ( ii ) followers ar e better connected than you ar e (i.e., have mor e friends on averag e) and ( iii , iv ) ar e more popular than you ar e (i.e., have mor e followers on aver age). T op r ow shows the avera ge connectivity (popularity) of user’s network neighbors vs user’s connectivity (popularity). Data r esiding above the dashed y = x line indicates "paradox" conditions. Bottom r ow shows the pr obability distribution of the ratio of the average neighbor’ s connectivity (or popularity) to user’ s connectivity (or popularity). Although some users ar e systematically not in paradox, indicated in the top r ow , the y are a tiny fr action of total users. for 98% of users, this ratio is above one, indicating that the av erage follower is better connected than the user . In fact, a typical follo wer is almost 20 times better connected than the user is. The last two variants of the friendship paradox deal with user’ s popularity , i.e., the number of followers he or she has. It appears that on T witter , user’ s both friends and follow- ers are more popular than the user himself of herself. This is shown in Figures 2( iii ) and 2( iv ). In our data set, 99% and 98% of users were respectiv ely less popular than their friends and follo wers. While a typical follower is about 10 times more popular than the user (Fig. 2( iv ) bottom), the ratio of the friend’ s a verage popularity to the user’ s popular- ity shows a bimodal distribution (Fig. 2( iii ) bottom). While some of a user’ s friends are ten times more popular , some friends are about 10,000 times more popular, showing a ten- dency of T witter users to follow highly popular celebrities. Friend Activity Paradox In addition to connectivity and popularity paradoxes, we also demonstrate a nov el activity paradox on T witter . F riend activity paradox: On average , your friends ar e more active than you ar e. T o empirically v alidate this paradox, we measure user ac- tivity , i.e., the number of tweets posted by a user during a giv en time period; we exclude users who joined T witter af- ter the start of the time period. After windowing by a two- months time period we are left with 37M tweets from 3.4M users and 144.5M links among these users. Note that the dataset contains a random sample of all tweets; therefore, the number of tweets posted by the user in our sample is an unbi- ased measure of his or her o verall acti vity . At the same time, we measure the number of sampled tweets posted by user’ s friends during the same time interval. Figure 3(a) shows the av erage activity (number of posted tweets ) per friend of users who each ha ve same lev el of acti vity , i.e., mean a ver - age friend activity as a function of user activity . The unit slope y = x line is shown for comparison. 88% of all users are less activ e than their typical friend. Figure 3(b) shows the probability distribution of the ratio of av erage per friend activity over user activity . For the v ast majority of users, the friend activity paradox holds: their friends are more acti ve than they are. It is known that some users become inactiv e after some time. T o ensure that our results are not af fected by inactiv e users, we checked the same paradox for a shorter time period of one week, during which time fewer users may have be- come inactiv e. Activity paradox still holds. In fact, a much larger fraction of users are in the paradox regime: 99% of users are less activ e than their friends. Also, note that in all the analyses that we are comparing users with their friends (followers) we exclude users who don’t have any friends (followers), because there is no one for the comparison. V irality Paradox Y our friends’ superior social connectivity puts them in a better position to monitor , in aggregate, the flow of infor- mation, thereby mediating the information you receive via the social network. Perhaps this also puts them in a position to receive higher quality content. As a measure of quality , we inv estigate virality of URLs tweeted by users, i.e., num- 10 0 10 1 10 2 10 3 10 0 10 1 10 2 10 3 # tweets posted by user Avg. # posted tweets per friend y = x (a) A verage number of tweets posted by user’ s friends vs the number of tweets posted by the user . 10 0 10 2 10 4 0 0.02 0.04 0.06 0.08 0.1 0.12 avg. received tweets per friend/posted tweets PDF (b) PDF of the ratio of tw eets posted by friends and tweets posted by number of posted tweets. Figure 3: Comparison of user’ s activity and the averag e ac- tivity of his or her friends (measured by the number of tweets posted by them). Most (88%) of the users ar e less active than their friends on averag e. ber of times a URL was posted by any user over some time period. V irality paradox: On avera ge, your friends spr ead mor e highly viral content than you do. T o confirm this paradox, we calculate avera ge size of posted URL cascades for each user and compare this v alue with the average size of posted cascades of friends. W e ob- serve that 32% of users hav en’t posted any URLs (average cascade size of 0 ), while their friends did. Therefore, these inactiv e users hav e posted fewer viral cascades than their friends. F or the remaining 68% of users, Figure 4(a) shows the probability distrib ution of the ratio of av erage size of cascades posted by friends to the average size of cascades posted by user . W e find that 79% of users have ratio of greater than 1, which means that their friends have posted more viral content. Considering the users who ha ven’ t post any URLs, 86% of all users hav e posted less viral content than their friends. 10 0 10 2 10 4 0 0.05 0.1 0.15 Avg. posted cascade size of friends / avg. posted cascade size of user PDF (a) PDF of h size of posted cascade per friend i / h size of posted cascades i . 10 0 10 2 10 4 0 0.05 0.1 0.15 0.2 Avg. size of received cascade of friends / avg. size of received cascade of user PDF (b) PDF of h size of received cascades per friend i / h size of receiv ed cascades i . Figure 4: Comparison of average size of posted and r eceived cascade of users with their friends. F or the vast majority of users, their friends both receive and post URLs with higher averag e cascade size, indicating a virality paradox. Users not only post less popular URLs than their friends, but also receive less viral content than their friends do, on av erage. Figure 4(b) shows the probability distribution of the ratio of the av erage size of cascades friends receive to the average size of cascades recei ved by the user . Here again 76% of users receiv e smaller (less viral) cascades than their friends ( 15% of users hav e receiv ed URLs with same level of virality as their friends). Spam Filtering One trivial explanation of our results could be the pres- ence of spammers in our sample. Spammers generate more tweets than normal users, so their presence in our sample could bias our estimates of user activity . T o v alidate that the paradoxes don’t e xist because of the spammers, we eliminated spammers from the dataset in two dif ferent ways. First, we use the set of spammers from (Ghosh et al. 2012). These users’ profile was sus- pended by T witter authorities and also the users posted at 10 0 10 1 10 2 10 3 10 2 10 3 10 4 10 5 # friends # received tweets data y ∝ x 1.14 y ∝ x (a) A verage number of tweets receiv ed by users with the giv en number of friends 10 0 10 1 10 2 10 3 10 2 10 3 10 4 10 5 10 6 # posted tweets # received tweets (b) A verage number of tweets posted by user vs the num- ber of receiv ed tweets Figure 5: Gr owth in the volume of incoming information as a function of user’ s connectivity and user activity it stimulates. Lines in (a) show the best power law and linear fits. least one blacklisted URL. Second, we took the approach of (Ghosh, Surachawala, and Lerman 2011) and classified users as spammers based on entropy of content generated and entropy of time intervals between tweets (spammers tend to have lo w entropy of content and tweeting time in- tervals). In both cases, after removing all spammers from the net- work and excluding their tweets, all paradoxes still hold. In fact, in some cases the paradox becomes even stronger . For example, if we exclude users based on their content and ac- tivity entropy , 93% of users would be less acti ve than their friends (instead 88% before spam filtering). Friend Paradox and Information Overload The friend activity paradox in directed social networks of online social media is not a mere statistical curiosity — it has surprising implications for how social media users pro- cess information. As social media users become more ac- tiv e on the site, the y may want to grow their social net- 0 200 400 600 800 1000 0 20 40 60 80 100 # followers # posted tweets (a) A verage number of posted tweets vs number of fol- lowers. 0 200 400 600 800 1000 0 20 40 60 80 100 # friends # posted tweets (b) A verage number of posted tweets vs number of friends. Figure 6: User activity as a function of the number of fol- lowers and friends the user has. works to receive more nov el information. Clearly , adding more friends will increase the amount of information a user has to process. Howe ver , according to the friend acti vity paradox, an average new friend is more acti ve than the user is herself; therefore, the volume of new information in a user’ s stream will grow super-linearly as new connections are added. Sometimes the volume of new information will exceed user’ s ability to process it, pushing the user into in- formation ov erload regime. Overloaded users are less sensi- tiv e detectors of information. User Activity and Incoming Information V olume W e study ho w the volume of incoming information , mea- sured by the number of tweets recei ved by a user , grows with the size of a user’ s social network. Figure 5(a) shows the av erage number of tweets receiv ed by users who fol- low a given number of friends. The data is shown for users with up to 2000 friends, and has surprisingly lo w disper- sion. This data is best fit by an power -law function with exponent 1.14 ( R 2 = 0 . 9865 ). The best linear fit has slope of 71 ( R 2 = 0 . 8915 ), while the best quadratic fit has slope of 60 ( R 2 = 0 . 8930 ). The lines in Figure 5(a) sho w the best power -law and linear fits, where the linear fit was shifted down vertically for clarity . These data show that the aver - age volume of information receiv ed by a user grows super- linearly with the number of friends! Regardless of the pre- cise functional form, the volume of incoming information increases quickly with user’ s connectivity: for every new friend, users receiv e hundreds of new posts in their stream. 1 Users can compensate for the increased volume of incom- ing information by increasing their own activity , e.g., visit- ing T witter more frequently . While we cannot directly ob- serve when a user visits T witter to read friends’ posts, we can indirectly estimate user activity by counting the num- ber of tweets he or she posts within the time period. Fig- ure 5(b) shows that users who receiv e more information are also more active, though after about 500 posted tweets (over a two month period) the relationship between incoming vol- ume of information and user activity becomes very noisy . These extremely active users (posting 50 or more tweets a day , on av erage, accounting for our 20% sample), who are not limiting how much information they receiv e, could be spammers. W e include them, because their activity impacts the information load of people who choose to follow them. Finally , we look at the correlation between user activity and the number of friends and followers. Figure 6 shows user activity , measured by the number of tweets posted dur- ing the time interval, as a function of the number of follow- ers and friends the user has. There is a significant corre- lation between user’ s activity , connectivity , and popularity (p-value < 0.01). The correlation between user activity and the number of follo wers appears especially strong. This cor - relation could, in fact, explain the friend acti vity paradox, because highly activ e users contribute to the av erage friend activity of their many followers, causing ov errepresentation when av eraging over friend’ s activity . The detailed mecha- nism for this correlation is not yet clear . It is conceiv able that as the user becomes more activ e, she begins to follow more and more people. Being activ e leads her to acquire new follo wers as her posts become visible to others, for ex- ample, by being retweeted. This will lead to a correlation between the number of friends and followers that goes be- yond simple reciprocation of links. W e lea ve these questions for future research. Inf ormation Overload In the section abov e, we showed that the volume of incom- ing information in a user’ s stream quickly increases with the number of friends the user follows. While the user may at- tempt to compensate for this growth by increasing her own activity , this may not be enough. As a result, the user may re- ceiv e more posts than she can read or otherwise process. W e say that such users are in the information overload regime. In this section, we compare the behavior of users who are ov erloaded with those who are not. W e consider number of tweets posted by users during 1 This total is ov er the course of two months. Our dataset is a 20% sample, so the total numbers should be scaled accordingly . some time period (here first two months of the dataset) as a measure of the amount of effort they are willing to allo- cate to their T witter activities, and cate gorize users into four classes based on this measure. W e only consider users who joined T witter before June 2009, so that the duration of po- tential activity for all users is identical. The four classes are as follows: users who posted ( i ) fewer than five tweets, ( ii ) 5–19 tweets, ( iii ) 20– 59 tweets, and ( iv ) 60 or more tweets (av erage of one tweet per day in the sample). Then, in each group we ranked users based on number of tweets they re- ceiv ed. W e consider the top one third of users who received the most tweets to be information overloaded, and the bot- tom one third are taken as underloaded users. W e compare the a verage size of cascades that are sent (posted) and receiv ed by overloaded and underloaded users. Each cascade is associated with a unique URL, and its size is simply the number of times that URL was posted or retweeted in our data sample during the two months period. T op line of Figure 7 compares the av erage size of posted cascades of overloaded and underloaded users. (If the user receiv es the same URL multiple times, we take into account all appearances of that cascade during averaging.) The av- erage cascade size of URLs tweeted by overloaded users is somewhat larger than those tweeted by underloaded users. Across all four groups overloaded users tweeted cascades of larger mean size, suggesting that o verloaded users par - ticipate in viral cascades more frequently than underloaded users. The bottom line of Figure 7 shows the difference in the av erage size of URL cascades receiv ed by ov erloaded and underloaded users. Across all four groups, a typical over - loaded user receiv es larger cascades, as shown in T able 1, but overloaded users see far fewer small cascades. In other words, overloaded will be poor detectors of small, dev el- oping cascades. They seem to only kno w about the infor- mation spreading in a cascade when ev eryone else in their social network knows about it. Surprisingly , overloaded users also less likely to have their stream dominated by vi- ral cascades than underloaded users. This could happen be- cause globally popular URLs tend to be less popular within a user’ s local network (Lerman and Galstyan 2008), so that their few occurrences in the user’ s stream are drowned out by other tweets. No matter the explanation, it appears that ov erloaded users are only good detectors for information of mid-range interestingness — most likely the information that their friends already know . Category Underloaded Overloaded Group 1 12 . 56 104 . 96 Group 2 40 . 78 132 . 94 Group 3 119 . 75 160 . 99 Group 4 145 . 44 202 . 86 T able 1: Median of average size of r eceived cascades for under- and overloaded users. Overloaded users have lar ger median acr oss all four groups, sending, r espectively , 1) <5 tweets, 2) 5–19, 3) 20–59, and 4) >60 tweets 10 0 10 1 10 2 10 3 10 4 10 5 10 −4 10 −2 10 0 Avg. size of posted cascades PDF Overloaded Underloaded 10 0 10 1 10 2 10 3 10 4 10 5 10 −4 10 −2 10 0 Avg. size of posted cascades PDF Overloaded Underloaded 10 0 10 1 10 2 10 3 10 4 10 5 10 −4 10 −2 10 0 Avg. size of posted cascades PDF Overloaded Underloaded 10 0 10 1 10 2 10 3 10 4 10 5 10 −4 10 −2 10 0 Avg. size of posted cascades PDF Overloaded Underloaded 10 0 10 1 10 2 10 3 10 4 10 5 0 0.05 0.1 0.15 0.2 0.25 Avg. size of received cascades PDF Overloaded Underloaded 10 0 10 1 10 2 10 3 10 4 10 5 0 0.1 0.2 0.3 Avg. size of received cascades PDF Overloaded Underloaded 10 0 10 1 10 2 10 3 10 4 10 5 0 0.1 0.2 0.3 Avg. size of received cascades PDF Overloaded Underloaded 10 0 10 1 10 2 10 3 10 4 10 5 0 0.1 0.2 0.3 0.4 Avg. size of received cascades PDF Overloaded Underloaded ( i ) ( ii ) ( iii ) ( iv ) Figure 7: Comparison of size of posted and r eceived cascades of overloaded and underloaded users, gr ouped by their activity . Gr oup ( i ) consists of users who posted fewer than 5 tweets, ( ii ) users who posted 5–19 tweets, ( iii ) users who posted 19–59 tweets, and ( iv ) users who posted mor e than 60 tweets during two months time period. Related W ork The friendship paradox describes the phenomenon that most people ha ve fe wer friends than their friends ha ve (Feld 1991). The paradox exists because people who hav e more friends are more likely to be observed among other’ s friends; therefore, they contrib ute more frequently to the av erage. In- terestingly , most people think they have more friends than their friends do (Zuckerman and Jost 2001). Besides being an interesting phenomenon, the friendship paradox has some practical applications. E.g., in (Christakis and Fo wler 2010) and (Garcia-Herranz et al. 2012) authors use the paradox for early detection of contagious outbreaks, both virtual and pathogenic. Studies ha ve sho wn that people with more friends are more likely to get infected early on. So, if we consider a random sample and check the friends of the random sample for the outbreak, we will have higher chance in detecting the outbreak in early days. In this paper, we confirm the friendship paradox exists in T witter , i.e. a user’ s friends hav e more friends on av erage than the user itself, which has also been observ ed by Garcia- Herranz et al. (Garcia-Herranz et al. 2012). Compliment- ing the work by Garcia-Herranz et al., we indirectly explain why early detection is possible on T witter . T weets are not pathogens, i.e., a tweet must be activ ely propagated to be- come a viral meme, unlike the flu or other liv e pathogens which propagate without any conscious effort by the host vector . Hence, network structure alone is insufficient to dev elop a robustly successful application of the friendship paradox to understanding social contagion. W e report that the missing connection is the high correlation between ac- tivity and connecti vity . W e also demonstrate that a new paradox also e xists re- garding activity of users: the vast majority of users are less activ e than their friends. Although the original friendship paradox can be deri ved solely from the properties of the net- work structure, the activity paradox is not a priori true; it will hold true any time there is a high correlation between user acti vity and connectivity , as we have shown for T witter . The high correlation between activity and degree suggests that most friends are discovered via T witter , on av erage. This fact will cause users who hav e more friends to recei ve ev en more tweets per friend, leading to a super -linear growth in incoming information. Receiving a surplus of tweets re- duces the visibility of each tweet and also it divides users’ attention across different topics. Hodas and Lerman show that visibility and divided attention play a considerable role in social contagion (Hodas and Lerman 2012). The present work demonstrates that a clear model of ho w users discover friends and manage e xisting friendships is es- sential for mitigating any undesirable consequences of the high correlation between acti vity and connectivity . For ex- ample, among children, this can result in “popular" kids having undue influence on others regarding the percep- tion of peer alcohol and drug abuse (T ucker et al. 2011; W olfson 2000). Furthermore, better understanding the ac- tivity paradox can help online social networks identify and recommend interesting users to follow that will account for any undesired information o verload. Conclusion The present work has demonstrated that the friendship paradox exists on T witter for over 98% of users, although this is not surprising, giv en the underlying mathematical foundation de veloped by Feld (Feld 1991). Howe ver , we hav e demonstrated a new paradox, the activity paradox, whereby your friends are more activ e than you are. They also receiv e more viral content than you, on a verage, and send out more viral content than you. W e ha ve shown a lar ge correlation between activity and both in- and out- degree in the follo wer graph on T witter . Hence, we propose that the activity paradox is not a fluke particular to T witter; it results from active users generating more visibility for themselves, leading to more followers. Active users are also more in- terested in consuming content, on av erage, causing them to follow more users as they grow more acti ve. For the puta- tiv e user choosing whom to follow , it is not surprising that activ e users are more lik ely to appear in the feed via retweets of others. Hence, the key relationship can be hypothesized to be that activity causes connectivity , leading to the more detailed friendship paradox we report: your friends and fol- lowers ha ve more friends and follo wers than you do. If you have ev er felt like your friends are more interesting or more activ e than you are, it seems the statistics confirm this to be true for the vast majority of us. The consequence, beyond the psychological implication of comparing oneself to one’ s friends, is that we will recei ve more incoming infor- mation than we prefer, i.e., information ov erload. W e make contacts with people who are easiest to discover – who are the most acti ve – but we have a finite budget for commu- nication. The present work shows that the resulting super- linear increase in information arising from following addi- tional users could be a significant cognitive load (Sweller , Merrienboer , and Paas 1998). Those users who become overloaded, measured by receiv- ing far more incoming messages than they send out, are con- tending with more tweets than they can handle. Controlling for activity , they are more likely to participate in viral cas- cades, likely due to receiving the popular cascades multiple times. Any indi vidual tweet’ s visibility is greatly diluted for ov erloaded users, because o verloaded users receiv e so man y more tweets than they can handle. Because of the connec- tion between cognitiv e load and managing information over - load, the present results suggest that users will dynamically adjust their social network to maintain some optimal indi- vidual lev el of information flux. Future work will elucidate how the acti vity paradox can be used to model the dynamics of growing and shrinking our social netw orks over time. Acknowledgements This material is based upon work supported in part by the Air Force Of fice of Scientific Research under Contract Nos. F A9550-10-1-0569, by the National Science F oundation un- der Grant No. CIF-1217605, and by DARP A under Contract No. W911NF-12-1-0034. References [Amuedo-Dorantes and Mundra 2007] Amuedo-Dorantes, C., and Mundra, K. 2007. Social networks and their impact on the earnings of mexican migrants. Demography 44(4):849–863. [Bickart et al. 2012] Bickart, K.; Hollenbeck, M.; Barrett, L.; and Dickerson, B. 2012. Intrinsic amygdala–cortical functional con- nectivity predicts social network size in humans. The Journal of Neur oscience 32(42):14729–14741. [Christakis and Fo wler 2010] Christakis, N. A., and Fowler , J. H. 2010. Social network sensors for early detection of contagious outbreaks. PLoS ONE 5(9):e12948+. [Dunbar 1993] Dunbar, R. 1993. Coe volution of neocortical size, group size and language in humans. Behavior al and br ain sciences 16(4):681–693. [Feld 1991] Feld, S. L. 1991. Why Y our Friends Hav e More Friends Than Y ou Do. American Journal of Sociolo gy 96(6):1464–1477. [Garcia-Herranz et al. 2012] Garcia-Herranz, M.; Egido, E.; Ce- brian, M.; Christakis, N.; and Fo wler , J. 2012. Using friends as sensors to detect global-scale contagious outbreaks. arXiv pr eprint arXiv:1211.6512 . [Ghosh et al. 2012] Ghosh, S.; V iswanath, B.; Kooti, F .; Sharma, N. K.; Gautam, K.; Benev enuto, F .; Ganguly , N.; and Gummadi, K. P . 2012. Understanding and Combating Link Farming in the T witter Social Network. In Pr oceedings of the 21st International W orld W ide W eb Confer ence (WWW’12) . [Ghosh, Surachawala, and Lerman 2011] Ghosh, R.; Surachawala, T .; and Lerman, K. 2011. Entropy-based classification of “retweet- ing” activity on twitter . In Pr oceedings of KDD workshop on Social Network Analysis (SNA-KDD) . [Groeger and Bro wn 1989] Groeger , J., and Brown, I. 1989. As- sessing one’ s own and others’ driving ability: influences of sex, age, and e xperience. Accident Analysis and Pr evention 21(2):155– 168. [Hodas and Lerman 2012] Hodas, N., and Lerman, K. 2012. How limited visibility and divided attention constrain social contagion. In ASE/IEEE International Confer ence on Social Computing . [Kanai et al. 2012a] Kanai, R.; Bahrami, B.; Duchaine, B.; Janik, A.; Banissy , M.; and Rees, G. 2012a. Brain structure links loneli- ness to social perception. Current Biology . [Kanai et al. 2012b] Kanai, R.; Bahrami, B.; Roylance, R.; and Rees, G. 2012b. Online social network size is reflected in human brain structure. Proceedings of the Royal Society B: Biological Sciences 279(1732):1327–1334. [Kwak, Chun, and Moon 2011] Kwak, H.; Chun, H.; and Moon, S. 2011. Fragile online relationship: a first look at unfollo w dynamics in twitter. In Proceedings of the 2011 annual conference on Human factors in computing systems , 1091–1100. ACM. [Lerman and Galstyan 2008] Lerman, K., and Galstyan, A. 2008. Analysis of social voting patterns on digg. In Pr oceedings of the 1st A CM SIGCOMM W orkshop on Online Social Networks . [McKenna, Stanier , and Lewis 1991] McKenna, F . P .; Stanier , R. A.; and Lewis, C. 1991. Factors underlying illusory self- assessment of dri ving skill in males and females. Accident Analysis and Pr evention 23(1):45 – 52. [Morselli and T remblay 2004] Morselli, C., and Tremblay , P . 2004. Criminal achiev ement, offender networks and the benefits of low self-control. Criminology 42(3):773–804. [Pollet, Roberts, and Dunbar 2011] Pollet, T .; Roberts, S.; and Dunbar , R. 2011. Extrav erts hav e larger social network layers. Journal of Individual Dif ferences 32(3):161–169. [Powell et al. 2012] Powell, J.; Lewis, P .; Roberts, N.; García- Fiñana, M.; and Dunbar , R. 2012. Orbital prefrontal cortex volume predicts social network size: an imaging study of individual differ - ences in humans. Pr oceedings of the Royal Society B: Biological Sciences 279(1736):2157–2162. [Quercia et al. 2012] Quercia, D.; Lambiotte, R.; Kosinski, M.; Stillwell, D.; and Crowcroft, J. 2012. The personality of popu- lar f acebook users. In Pr oceedings of the A CM 2012 confer ence on Computer Supported Cooperative W ork (CSCW’12) . [Sgourev 2006] Sgourev , S. 2006. Lake w obegon upside do wn: the paradox of status-dev aluation. Social for ces 84(3):1497–1519. [Sweller , Merrienboer, and P aas 1998] Sweller , J.; Merrienboer , J. J. G. V .; and Paas, F . G. W . C. 1998. Cognitiv e architecture and instructional design. Educational Psychology Revie w 10:251–296. [T ucker et al. 2011] T ucker, J.; Green, H.; Zhou, A.; Miles, J.; Shih, R.; and DÕ Amico, E. 2011. Substance use among middle school students: Associations with self-rated and peer-nominated popu- larity . Journal of adolescence 34(3):513–519. [T ucker et al. 2012] T ucker, J.; Miles, J.; D’Amico, E.; Zhou, A.; Green, H.; and Shih, R. 2012. T emporal associations of popu- larity and alcohol use among middle school students. Journal of Adolescent Health . [Ugander et al. 2011] Ugander, J.; Karrer , B.; Backstrom, L.; and Marlow , C. 2011. The Anatomy of the Facebook Social Graph. [V an Groenou and V an Tilb urg 2003] V an Groenou, M., and V an Tilb urg, T . 2003. Network size and support in old age: Dif- ferentials by socio-economic status in childhood and adulthood. Ageing and Society 23(05):625–645. [W olfson 2000] W olfson, S. 2000. Students’ estimates of the pre va- lence of drug use: Evidence for a false consensus effect. Psychol- ogy of Addictive Behaviors 14(3):295. [Y ang and Leskovec 2011] Y ang, J., and Leskovec, J. 2011. Pat- terns of temporal variation in online media. In Proceedings of the fourth A CM international confer ence on W eb sear ch and data min- ing , WSDM ’11, 177–186. New Y ork, NY , USA: A CM. [Y oganarasimhan 2012] Y oganarasimhan, H. 2012. Impact of social network structure on content propagation: A study using youtube data. Quantitative Marketing and Economics 10(1):111– 150. [Zuckerman and Jost 2001] Zuckerman, E., and Jost, J. 2001. What makes you think you’ re so popular? self-ev aluation maintenance and the subjective side of the" friendship paradox". Social Psy- chology Quarterly 207–223.
Original Paper
Loading high-quality paper...
Comments & Academic Discussion
Loading comments...
Leave a Comment