Bayesian Odds-Ratio Filters: A Template-Based Method for Online Detection of P300 Evoked Responses
Template-based signal detection most often relies on computing a correlation, or a dot product, between an incoming data stream and a signal template. While such a correlation results in an ongoing estimate of the magnitude of the signal in the data …
Authors: Asim M. Mubeen, Kevin H. Knuth
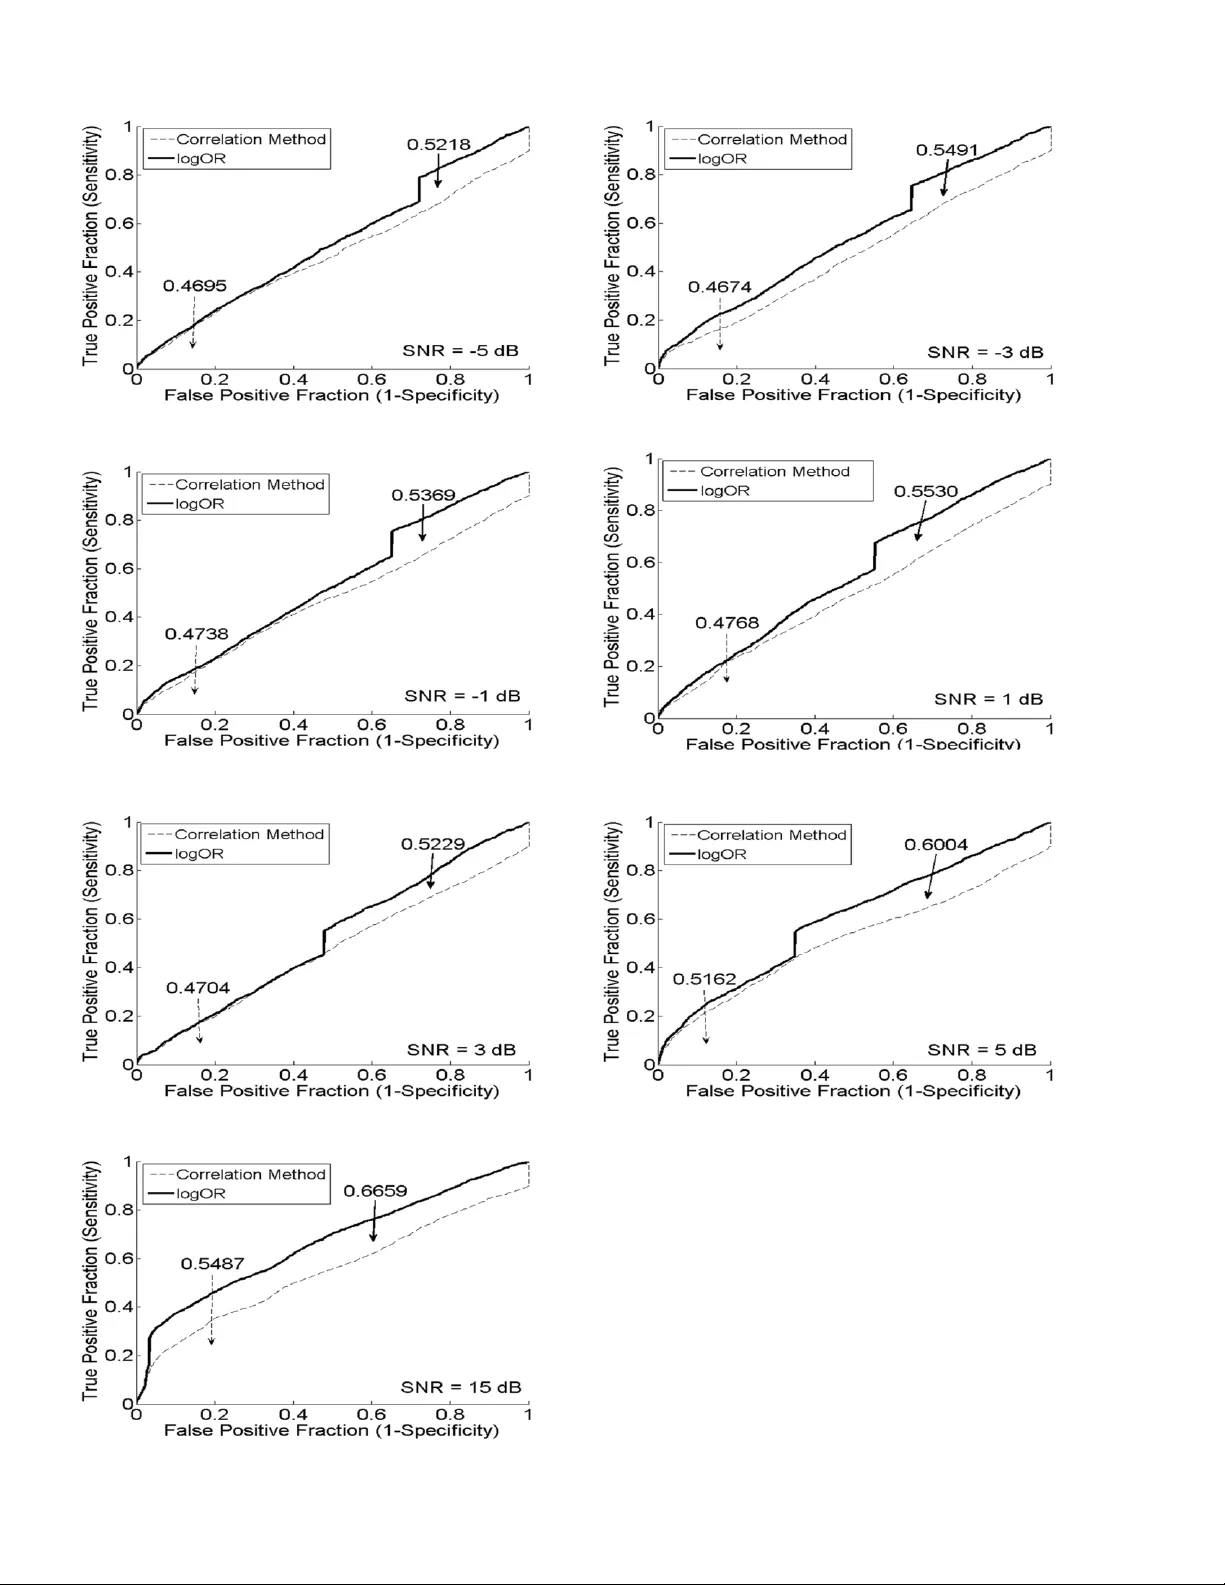
1 Abstract : Template-based signal detection most often relies on computing a correlation, or a dot p roduct, between an incoming data strea m and a signal te m plate. W hile such a correlation results in an ongoin g estimate of the magnitude of t he signal in the data strea m, it d oes not direc tly indicate the p resence or absence o f a signal. In stead, the p roble m of si gnal detection i s one of model-selection. Here we explore the use o f the Ba yesian odds -ratio (OR), which is th e r atio o f posterior p robabilities of a signal-plus-noise model over a noise-only model. We demonstrate this method by applying it to si mulated electroencephalograph ic (EEG) signals based on the P300 respo nse, which is widel y used i n b oth B rain Co mputer Interface (BCI) and Brain Machine Interface ( BMI ) systems. The efficac y of this al gorithm is de monstrated b y comparing t he receiver operating charac teris ti c (ROC) curves o f the OR -based (logOR) filter to the usual correlatio n method where we find a significant improvement i n P3 00 d etection . T he logOR filter promises to improve the ac curacy a nd speed of the detection of evoked brain responses in BCI/B MI app lications as well the detectio n of te mplate signals in general. Index Terms — biomedical signal processing, digital signal processing, medical signal detection, Bayesian, Bayesian model testing I. INTRODUCTION Neurophysiology in general, and brain machine interface (BMI) in particular, relies on the detection and characterization of the electric and magnetic field potentials produced b y t he brain in response to sensory stimulation or in association with its cogni tive and/or motor ope rations a nd planning. These potentials originate from the transmembrane current flow produced b y multiple ensembles of hundreds of thousands of synchronously firing neurons [1], [2]. Human scalp electroencephalographic (EEG) recording has the advantage o f being noninvasive, inex pensive and portable, which make it a very popular technique among the BCI/BMI community. Event-related potentials (ERPs) are evoked brain responses synchronized to sensor y, cognitive an d motor events [3] . As such, they consist of relatively reproducible waveshapes embedded in background EEG activity [ 4], [5]. In particular, the P300 evoked potential [ 6], [ 7] is a posi tive peak that is evoked 300 ms after stimulus onset. The P300 is widely used in both BCI and BMI applications, but recent studies show that it is also useful in the diagnosis of neurological disorders and lie d etection. D espite its w ide use, detection of the P300 component in single-trial recordings remains ch allenging. More oft en, multi ple trials are n eeded to detect the P300 component in ongoing EEG activity, which decreases th e overall speed of BCI/BMI systems. In general, the detection of an ERP is made difficult by its low signal - to -noise (SNR) ratio compared to the ongoing background EEG. The most commonly-used method t o estimate the ERP is coherent averaging, which averages a large numbe r of time -locked epochs of the i dentical stimul i presented to the subject. This technique is used in online applications of BCI [8], [9]; however , it suffers f rom several drawbacks [ 10]. One drawbac k is that coherent averaging im plicitly assu mes that the ERP waveshape is identical from trial- to -trial. This is known to be a poor assumption [ 11], [ 12 ] and, in fact, such trial- to -trial variability is utilized in some advanced source separa tion methods [4], [13], [14] . Bayesian Odds-Ratio Filters: A Template-Based Method for Online Detection of P300 Evoked Responses Asim M. Mubee n a , Kevin H. K nuth a,b,c a Knuth Cyberphysics Lab , Department o f Physics, Universit y at Alban y, Albany NY, US A b Department of I nformatics, University a t Albany, Albany NY , USA c Autonomous Exp loration Inc., And over MA , USA 2 Several dete ction methods work b y correlating a template signal with the ongoing EEG. For ex ample, the Woody filter [15] , [16], performs a correlation by taking the dot pro duct of the on going EEG signal with the signal t emplate. Other correlation-based classification techniques like Pearson’s correlation method (PC M), Fisher’s linear discriminant (FLD ), stepwise linear disc riminant analysi s (SW LDA), linear support vector machine ( LSVM), and the Gaussian kernel support vector machine (GSVM) h ave been presented and compared [17], [ 18]. These methods, which convert the problem of detecting P300 int o a binary search problem (P 300 present or not -present), have b een widel y used in BCI applications. I n this paper we present a Ba yesian odds ratio-based (OR-based) technique, whi ch relies on a signal tem plate to detect the P300 response in ongoing EEG. The OR-based detection m ethod is not specific to EE G signals and can be applied to any kind of template-based si gnal detection. The technique is demonstrated by applying it to s ynthetic P300 responses. We compare our results to the template correlation (dot product / Woody filter [16]) method and demonstrate efficac y by comparing the resulting receiver operating characteristic (ROC) curves [19], [20], [21]. II. THE LOG ODD S-RA TIO FIL TER A. Bayes’ Theorem Bayes’ theorem trans forms the problem of signal detection into one of model sel ection w here the probabilities of the considered models can be computed and compared. The posterior probabilit y ) , , | ( I M D m P gives us the probability of the parameter values, m , of the model M , given the recorded data D and relevant prior information I I M D P I M m D P I M m P I M D m P , | , , | , | , , | . (1) The posterior probability ) , , | ( I M D m P depends on both the pr ior probabilit y o f the model para meter values ) , | ( I M m P and the data-d ependent ratio o f the likelihood of the data given the model and its specific model parameter values ) , , | ( I M m D P to the evidence ) , | ( I M D P , which represents the probability that the data could have re sulted from the model irrespec tive of the specific model parameter values. Since summing the posterior probabilit y over all possible model parameter valu es results in unity, we can write the evidence as I M m D P I M m P dm I M D P , , | , | , | , (2) which demonstrates the reason that this quantity is also referred to as the marginal likelihood. We c onsider the problem of signal d etection as a model selection problem whe re we compare the evidence provided by th e data given one model to the evidence of the data provided by th e data given another model. As we are trying to detect the P300 signal from ongoing EEG activity, we will refer to the model as noise-only (background EEG activity) ) ( ) ( : t t x M m m N , (3) where is the time series data recorded from the m th electrode and is the time series of ongoing EEG activit y recorded at each channel. We refer to such activit y as noise and assume it to be independent in each channel. 3 Similarly, we refer to the model as si gnal (P300) plus noise (background EEG activit y) and write the model as ) ( ) ( ) ( : t t s C t x M m m m N S , (4) where is the time se ries data recorded from the m th electrode, is the coefficient that couples the signal source to the m th electrode , α is the amplitude of the signal in the given trial. W e assume that the coefficients and the source signal waveshape are both known. The value of the single-trial amplitude par ameter α in the si gnal -plus-noise model is assumed to be between 0 and some m aximum value a , so that a 0 . B. Odds Ratio To compare the two models, we compute the odds ratio ( OR ), which is the ratio of the ma rginal likelihoods, or evidences, of each model. Howe ver, in this problem, the noise-only model has no model parameters. So we compare the marg inal li kelihood of to the likelihood : N N S N N S Z Z I M D P I M D P OR ) , | ( ) , | ( (5 ) where ) ), ( , | ) ( ( ) , | ( I t C t x P I M D P Z N N (6) And a N S N S I t C t x P I P d I M D P Z 0 ) , ), ( , | ) ( ( ) | ( , | (7) We assign a Gaussian likelihood to both models, and note that this does not necessaril y mean that the noise is Gaussian, but rather that the ex pected squared deviation 2 from the mean is a relevant quantity. We then have that (6) becomes M m T t m MT N t x Z 1 1 2 2 2 / 2 )) ( ( 2 1 e x p ) 2 ( (8) and that the likelihood term in (7) becomes M m T t m m m s MT s t t s C t x I t C t x P 1 1 2 2 2 / 2 ) ( ) ( ) ( 2 1 e x p ) 2 ( ) , ), ( , | ) ( ( (9) We also assume that the distribution of single-trial amplitudes α is Gaussian with mean ˆ and variance 2 so that 2 2 2 / 1 2 ) ˆ ( 2 1 e x p ) 2 ( ) | ( I P (10) Applying the probability assignments in (9) and (10) to the integra l in (7), we find that 2 2 2 2 2 2 2 2 / 1 2 2 / 2 2 ) ( 2 2 1 e x p ) 2 ( ) 2 ( D E e rf D E aD e rf D F D E Z s s s s MT s N S (11) 4 where the fun ction erf ( x ) is the error function d efined as the integral o f a G aussian with zero mean a nd unit variance from zero to x [22]. Also by defining 2 2 2 s S (12) we have that T t M m m t s C S D 1 1 2 2 2 ) ( , (13) T t M m m m t s t x C S E 1 1 2 ) ( ) ( ˆ (14) and T t M m m t x S F 1 1 2 2 2 )) ( ( ˆ . (15) It is often easi er to work with the logarithm of the probabilities. Taking th e logarithm of the odds r atio (5) we have that ) l og ( ) l og ( l og log N N S N N S Z Z Z Z OR , (16) which after some algebraic simplification, including the assumption that s , results in 2 2 2 2 2 2 2 2 2 2 2 ) ( 2 l og lo g 2 l og 2 1 ˆ 2 1 l og D E e rf D E aD e rf D D E OR s s s s (1 7) Since the log odds ratio compares the evidence of the two models, it can be used as an index for signal detection. We will refer to this filter as the logOR filter. The remainder of this paper focuses on evaluating the per formance of thi s proposed metho d by comparing and contr asting its receiver operator character istic (ROC) curves w ith those produced b y the usual correlation method (dot product). These ROC curves are constructed b y appl ying these techniques to times-series data consisting of synthetic EEG background si gnals in which are embedded P300 targets. The next section discusses the construction of the synthetic EEG data. III. SYNTHETIC EEG DA T A To anal yze the performance of the logOR filter, we generated synthetic EEG data representing both EEG background and the P300 evoked response. Three channels of s ynthetic EEG data (Figure 1a) were generated to sim ulate re cordings from Cz , Pz and Fz, which are commonl y used for P300 -b ased BMI applications [18] . The dipole model is used to scale the data among different electrodes. The data from each of thes e channels consisted of 300 epochs each bein g 800 ms in length and comprised of 200 s amples, which is consistent with a sampling rate of 250 Hz . Thirt y epochs w ere selected to each host a single P300 response. 5 We randomly generated a sequence of stimulus e vent times and used these times as latencies at which to superimpose the P300 template onto the s ynthetic ongoing background E EG signal, which we ref er to as noise [23]. The stimulus event times were stored and used to identify as tr ue/false-positives and true/false- negatives during the filter evaluation. The remaining 270 epochs exhibited only ongoing background EEG (noise). The synthetic P300 waveform was represented using the classica l theory [23], [24] where an ERP waveform reflects a phasic-burst of activit y. The P300 template (Figure 1b) was created with b y pro ducing a peak of width of 100ms starting around 300 ms after onset. To produce a P300 template more similar to what one would generate in the lab b y averaging recorded P 300 respons es, we added low -level background noise to the P300 template. To generate the on going EEG background, we used MATLAB code p rovided onli ne b y Yeung and Bogacz [25]. Fifty different sine waves were superimposed to create the ba ckground signal. This was done by r andomly selecting a frequency for each sine wave between 0 and 50 Hz. The phase was selected at random, and the amplitude was chosen to be consi stent with the Human EEG power law spectrum on which was superimposed two peaks at 10 and 60 Hz [26] (Figure 1c). To stud y the e ffect of the SNR on the filter performance, w e created 17 data sets where the SNR, calculated by the formula 2 10 l og 10 No is e S ig n a l dB A A SNR , (19) was varied in integral steps from -6 dB to 7 dB as well as 10, 15 and 20 dB. This covers the typical SNR range seen in BCI EEG applications, which is approximately from -6 dB to 6 dB [27]. (a) (b) (c) FIGURE 1. ( a) An illustration o f the synthetic EEG data ge nerated for the filter eval uation. T he three panels represent d ata recorded from different chan nels: Cz, Pz, Fz ( top to bottom). T wo P300s, indicated by arr ows are embedded in the se traces. (b) T his figure illustrates the mean po wer spectrum of the s ynthetic EEG data. (c) The target signal (P30 0) template is shown in this figure. Note that we are using a nois y template to si mulate a template ge nerated by taking avera ges of P300 recordin g epochs. 6 FIGURE 2. Receiver Operative Characteristic (ROC) curves for both the Corr elation Me thod (dashed) and lo gOR filter (solid). T he area under the curve q uantifies the efficacy of the detection method. Each panel sho ws result s for a di fferent SNR value var ying from -5dB to 1 5 dB. As the S NR value i ncreases, the area under the c urves increase s for both methods. T he lo gOR f ilter o ut -perfor ms the Correlation Method at all SN R levels. (a) (b) (c) (d) (e) (f ) (g ) 7 IV. RECEIVER OPERATIVE CHARACTERISTICS (ROC) CURVES ROC curves serve as a p erformance measure of signal det ection [20], [ 21] by plotting the tru e positive rate (also known as sensitiv ity ) versus th e false po sitive rate ( 1 – sp ecificity ). Sensitivit y is computed by identifying the fraction of correctl y detected tar gets (P300) and specificity refers to the fraction of non- targets (non-P300) identified as non -targets. The fractional area under th e ROC curve serves to quantify the performance of the detection methods so that a perfect detection method will result in unit y ; whereas a completely failed method will result in zero. The result is such that the more accu rate th e d etection method, the greater the fractional area under the ROC curve. V. DETECTION THRESHOLD The selection of a detection threshold value is a difficult task. As the detection threshold in creases, the sensitivity decreases while the specificity increases, which means that the false positive fraction (1 – specificity) decrea ses . To produce ROC curve s, we calculate sensitivity and (1-specificity) for each distinct value of the detection measure (i.e lo gOR / Correlation) to consider it as a candidate fo r de tection cutoff. B y plotting (1 – specificity ) versus sensitivity, the efficac y of the detection method can be quantified by the ar ea under the R OC curve. The ROC curve starts from the most strict decision cutoff point where sensitivity and (1 – specificity) values are zero where there will be no positive detection, and ends at most lenient cutoff point where sensitivity and ( 1 – specificit y) values are one and all detection values are t aken to represent a positive detection. The value of the area under the curve fo r the best detection method shoul d be one [28] , [ 29]. However, when a method results in an ROC curve where the area under the curve is less than one; there is always a tradeoff between sensi tivity and (1 – specificit y). So, the detection threshold can be found b y minimizing the distance between s ensitivit y and specificity. One can also find the threshold value b y plotting the sensitivi ty and specificit y versus the detection criteria, and selecting the d ecision threshold value based on the intersection point of sensitivity and specificity curves. FIGURE 3 . SNR vs. Area und er ROC c urves for the Correlation Method and the lo gOR filter. T he value of Area under the curve i ncreases as SNR increases for b oth methods. For higher values of SN R, the logO R filter performs much better tha n the Correlation Method. 8 VI. RESULTS In this paper w e developed and evaluated a template-based dete ction method that relies on the Ba yesian log odds ratio (lo gOR filter) to detect the pr esence or absence of a P300 signal in a s ynthetic on going EEG dataset representing three commonly-used EEG channels: Cz, Pz and Fz. We applied the logOR filter to the synthetic EEG data and compared the results to those obtained using the traditional co rrelation filter. Using the detections and the sequen ce of events used to generate t he data, we computed the ROC curves for different SNR ranging f rom -6 dB to 20 dB to evaluate the performance of both methods. Figure 2 shows the resulting ROC curves for s everal SNR values ranging from -5 dB to 15 dB. The area under t he ROC curve is consistentl y greater for the lo gOR filter indicating that the logOR filter out-performs the tr aditional correlation filter. A plot of the area under the R OC curves as a f unction of P300 SNR can be seen in Figure 3. Both methods exhibit similar performance at the lowest SNR value, but as the SNR increases, one can see that the logOR filter out-performs the correlation-based filter. VII. D ISCUSSION Most template-based methods designed to detect a target signal in a conti nuous EEG stream rely on the cross correlation of the incoming data with the template or target signal [15], [16]. Here we present a new approach in which we recast the problem of signal detection in terms of evidence-based model selection . By computing the Bayesian log o dds-ratio betwee n two models (the signal plus noise model, , and the noise only model, ), we produce an index, which we refer to as the logOR filter. The value of the logOR filter ind ex is high when the target signal, for example a P300, is present and low otherwise. We studied the performance of these two methods by applying them to s ynthetic EEG signals with P300 targets exhibiting SNRs ranging from -6 to 20 dB. Performanc e was quantified by constructing the ROC curves for each method and computing the area under the ROC curve. We found that the logOR filter out- performs the correlation method. This sugge sts that systems aiming to minimize the number of target trials, such as P300-base d BCI/BMI s ystems, may benefit from emplo ying the logOR filter . However it is observed that logOR filter performance i s very sensitive to differences between the assigned and true standard deviation value s of the background noise and the trial- to -trial amplit ude variability of t he P300 response. Therefore in a practical application one must choose the values of these parameters very carefully to calculate the logOR filter value. ACKNOWLEDGMENTS The authors would like to thank Dr. Dennis J. McFarland for valuable discussions, access to EEG data and instruction regarding the BCI2000 system REFERENCES [1 ] M. A. B. Brazier. “ Evoked respo nses recorded fro m the depths of th e human brain,” An nals of the New York Academy of S ciences , 1 12(1): pp. 33 – 59, 1964. [2 ] C. C. Duncan, R. J. Barry, J. F. Connolly, C . Fisch er, P. T. Mich ie, R. Näätänen, J. Poli ch, I. Reinvang, and C. V . Petten. “ Event-related potentials in clinical re search: guidelines for eliciting, recording , and quantifying mismatch neg ativity, P300, and N 4 00,” Clinical Neurophysiology , 120(11): pp. 1883 – 1908, November 2009. PMID: 19796989. [3] D. Friedman and R. Johnson. “ Event-related p otential (ERP) studies o f memory encoding and retrieval: a selective review ,” Micros c Res Tech , 51(1): pp . 6 – 28, 2000. 9 [4 ] K. H. Kn uth, A. S. Shah, W. A. Truccolo, M . Ding, S. L. Bressler, and C. E. Schroeder, “ Diffe renti ally variable co mponent analysis: Identifying multiple evoked components using trial - to -trial variability ,” Journal of Neurophysiology , 95(5): pp. 3257 – 3276, May 2006. PMID: 16467431. [5 ] A. Mouraux and G. D. Iannetti. “ Across-trial averaging o f event -related EEG re sponses and beyond ,” Magnetic Resonance Imaging , 26(7): pp. 1041 – 1054, September 2008. PMID: 18479877. [6 ] U. Hoffmann. Bayesian machine learning applied in a brain-computer interface for disabled users , PhD thesis, STI, Lausanne, 2007. [7 ] Sutton, M. Braren, J. Zubin, and E. R. John. “ Evoked-potential correlates of stimulus uncertainty ,” S cience , 150(700): pp. 1187 – 1188, 1965. [8 ] K. H. Chiappa. Evoked Potentials in Clinical Medicine , 3e . Lippincott Williams & Wilkins, 1 997. [9 ] E. Donchin, K. M. Spencer, and R. Wijesinghe, “ The mental prosthesis: assessing the speed o f a P3 00-b ased b rain-computer interface ,” IEEE Transactions on Rehabilitation Engineering , 8(2): pp. 174 – 179, June 2000. [10] G. Sparacino , S. Milani, E. Arslan, and C. Cob elli, “ A Bayesian approach to estimate evoked po tentials ,” Computer Method s and Programs in Biomedicine , 68(3): pp. 233 – 248, June 2002. [11] G Fein and B Turetsky . “ P300 laten cy variability in n ormal elderly: effects of para digm and measurement techn ique ,” Electroencephalography and clinical neurophysiology , 72(5): pp. 384 – 394, May 1989. PMID: 2469563. [12] J. M. Ford, P . White, K. O. Lim, and A. P fefferbaum, “ Schizop hrenics have fewer and smaller P300s: a sin gle-trial analysis ,” Bi ological Psychiatry , 35(2): pp. 96 – 103, January 1994. PMID: 8167215. [13] C. D’Avanzo, S. Schif f, P. Amodio, and G. Sparacino, “ A Bayesian method to estimate singl e-trial event-related po tentials with application to the study of the p300 variability ,” Journal of Neuroscience Me thod s , 198(1): pp. 114 – 124, 2011. [14] W. Truccolo, K. H. Knu th, A. Shah, S. L. Bressler, C. E. Schroeder, and M. Ding. “ Estimation of single-trial multicomponent ERP s: differentially variable component analysis (dVCA) ,” Biological Cybernetics , 89(6): pp. 426 – 438, December 2003. PMID: 14673654. [15] H. Serby, E. Yom-Tov, and G.F. Inbar. “ An improved P 300-based brain-computer interface ,” IEEE Transactions on Neural Systems a nd Rehabilitation Engineering , 1 3(1): pp. 89 – 98, 2005. [16] C. D. Woody . “ Characterization of an adaptive filter for th e analysis of variable latency neuroelectric signals ,” Med ical and Biological Engineering , 5(6): pp. 539 – 554, November 1967. [17] D. J. Krusienski, E. W. Sellers, F . Cabestaing, S. Bayoudh, D. J. McFarland, T. M. V aughan, and J. R. Wolp aw. “ A comparison o f classification techniques for the P300 speller ,” Journal of Neural Engineering , 3(4): pp. 299 – 305, December 2006. [18] E. W. Sellers, D. J. Krusienski, D. J M cFarland, T. M. Vaughan, and J. R. Wolpaw. “ A P300 event-related potential b rain-computer interface (BCI): the effects of matrix size and inter stim ulus interval on p erformance ,” Biological Psychology , 7 3(3): pp. 242 – 252, October 2006. PMID: 16860920. [19] J. T. Bushb erg, J. A. Seib ert, E. M. Leidholdt, and J. M. Boone. The Essentia l Physics of Medical Imaging . Lippincott Williams & Wilkins, December 2011. [20] S. Schinkel, O. Dimigen, and N. Marwan. “ Selection of recurrence threshold for signal detection ,” The European Ph ysical Journal Special Topics , 164(1): pp. 45 – 53, Novem ber 200 8. [21] M. H. Zweig and G. Campbell. “ Receiver-operating characteristic (ROC) plots: a fundam ental evaluation tool in clinical medicine ,” Clinical Chemistry , 39(4): pp. 561 – 577, April 1993. [22] M. Abramowitz, I. A. S tegun, Handbook of Mathematical Functions with Formulas, Graphs, and Mathematical Tab les , New York: Dover, 1965, Chapter 7, pp. 297. [23] N. Yeung, R. Bogacz, C. B. Holroyd, and J. D. Cohen, “ Detection of synchronized oscillations in the electroencephalogram: an evalu ation of methods ,” Psychophysiology , 41(6): pp. 822 – 832, Nov. 2004. PMID: 15563335. [24] A. S. Shah, S. L. Bressler, K. H. Knuth, M. Ding, A. D. M ehta, I. Ulbert, and C. E. Schroeder, “ Neural d ynamics and the fundamental mechanisms of event-related brain potentials ,” Cerebral Cortex , 14(5): pp. 476 – 483, May 2004. [25] N. Yeung, R. Bogacz, C. B. Holroy d, S. Nieuwenhuis and J . D. Cohen Generation of simulated EEG data . http://www.cs.bris.ac.uk/~rafal/phaserese t/ [26] T. C. Ferree and R. C. Hwa. “ P ower-law scalin g in human EE G: relation to Fourier p ower spectrum ,” Neurocompu ting , 52-54: pp. 755 – 761, June 2003. [27] J. Kronegg, S. Voloshynovskiy, and T. Pu n. “ Analy sis of bit -rate definition s for brain-computer interfaces ,” In Con ference on Human- Computer Interaction (HCI-2005), Las Vegas , 2005. [28] N. A. Obuchowski. “ Receiver operating characteristic curves and their use in radiology ,” Radiology , 229(1): pp. 3 – 8, October 2003. [29] N. A. Obuchowski. “ROC analysis,” American Journal of Roentgenology , 184(2): pp. 364 – 372, February 2005.
Original Paper
Loading high-quality paper...
Comments & Academic Discussion
Loading comments...
Leave a Comment