Heart Disease Prediction System using Associative Classification and Genetic Algorithm
Associative classification is a recent and rewarding technique which integrates association rule mining and classification to a model for prediction and achieves maximum accuracy. Associative classifiers are especially fit to applications where maxim…
Authors: M. Akhil Jabbar, B L Deekshatulu, Priti Ch
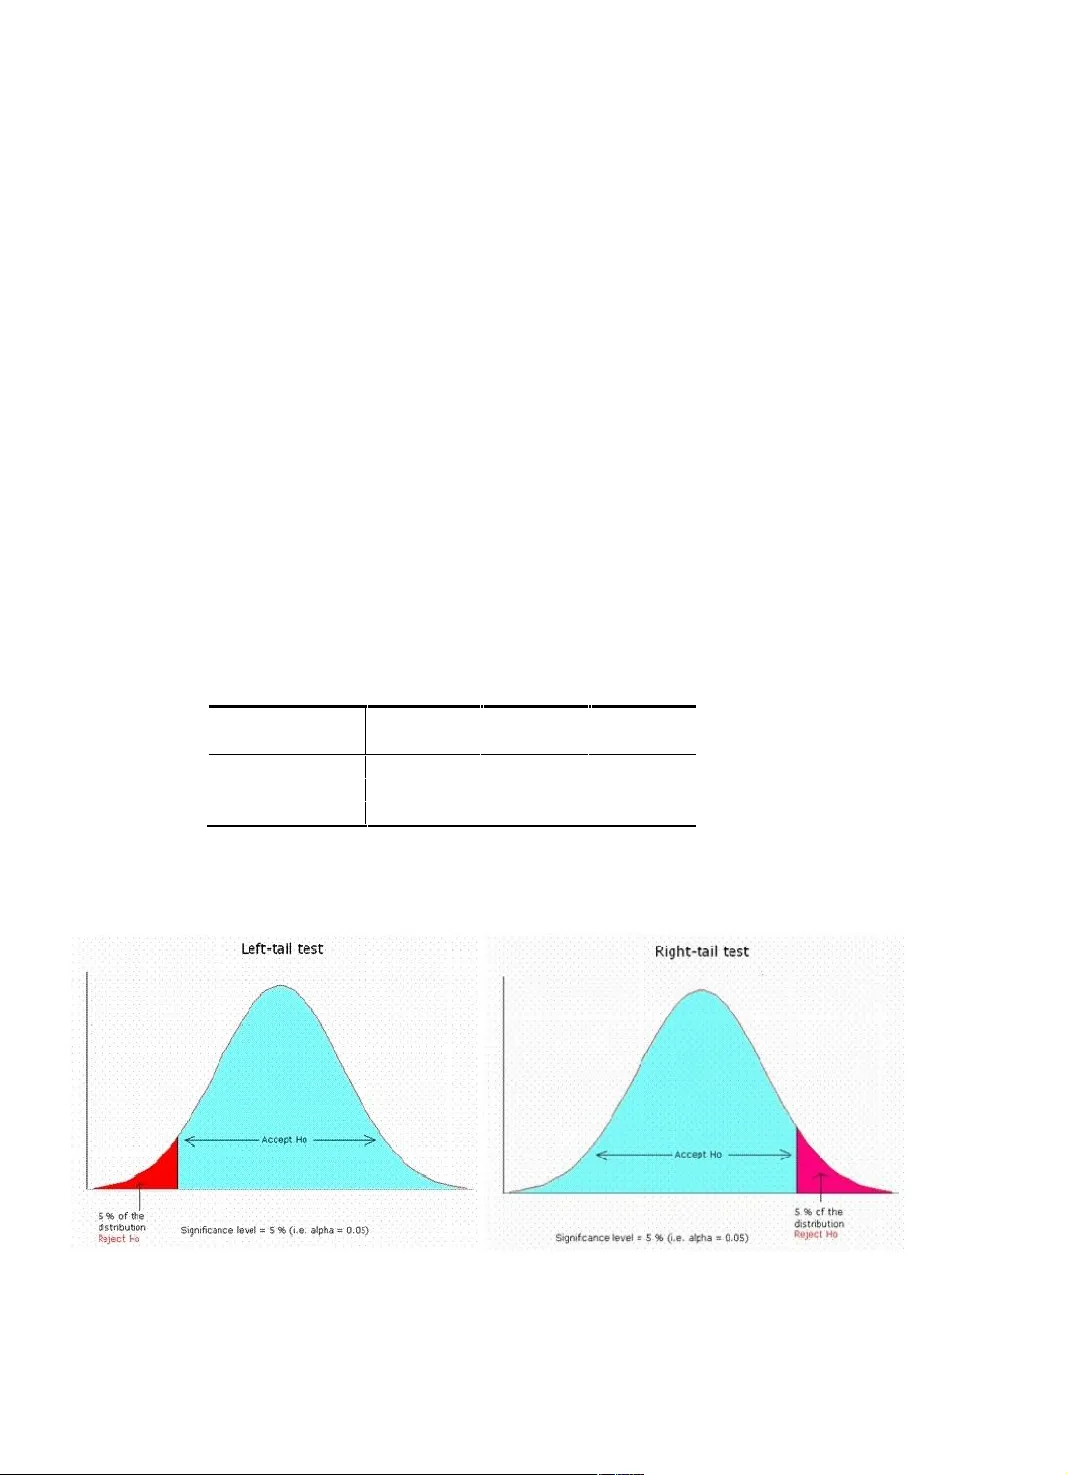
International Conference on Emerging Trends in Electrical, Electronics and Communi cation Technologies-ICECIT, 2012 Heart Disease Pre diction System us ing Associative Cl assification and Genetic Algo rithm M.Akhil jabbar a *, Dr.Priti Chandra b , Dr.B.L Deekshatulu c a Research Scholar, JNTU Hyderab ad,A.P INDIA b Senior Scie ntist,Advanced Syst em Laboratory,D RDO,,Hyderab ad,INDIA c Distinguished fel low, IDRBT ,RBI,Gov t of INDIA Abstract Associative classification is a recent and rewarding tech nique which integrates association rule mining and classification to a model for predictio n and achieves maximum acc uracy. Associative classifiers are esp ecially fit to applications w here maximum accuracy is desired to a model for p rediction . There are many d omains such as medical where the maximum accuracy of the m odel is desired . Heart disease is a single largest cause of death in developed countries a nd o ne o f the mai n contrib utors to dise ase b urden in de veloping co untries. M ortality data fro m the registrar general of India sho ws that heart disease are a major cause of death in India, and in Andhra Pr adesh coronary heart disease cause a bout 30%of dea ths in rural areas. Hence there is a need to develop a decision support system for predicting heart disease of a patie nt. I n this paper we prop ose efficient associati ve classification algorithm usin g genetic appr oach for heart d isease pred iction. T he main moti vation for using genetic algorith m in the discovery of high level p redictio n rules is t hat the di scovered rules ar e highly c ompr ehensible, ha ving hi gh predictive accuracy and of high i nterestingness values. Exper imental Results s how that most of the classifier rules help in the best pr ediction of hear t disease which even helps do ctors in their diag nosis decisions. Keywords: Andhra Pradesh, Associati ve classification, Ge netic algorith m, Gini Index, Z -Statistic s 1. Introduction The major reason that the data mining has attracted great deal of attention in the info rmation industr y i n the recent years i s due to the wide availabili ty of h uge a mounts of data and the need for t urning such data into useful information and knowledge. The informatio n gained can be u sed for applications ranging from business management, production cont rol, and market analysis to e merging design and science explor ation and healt h data analysis [ 1]. Association rule mining a nd classificatio n are two main functio nalities o f d ata mining. Association rule mining is used to find as sociatio ns or correlatio ns a mong t he ite m sets. It i s a uns upervised learning where no clas s attribute is involved in findin g the a ssociation rule. On t he other hand, clas sification is a supervised learning where class a ttribute is involved in the co nstruction of the cla ssifier and is used to classify or pr edict the data unknown sample. * Corresponding au thor. Tel.: +91 9912648686 E-mail address : ja bbar.meerja@gma il.com. Author/Title of the Manuscript Associative classi fication involves two s tages. 1) Generate class b ased associatio n rules fro m a training data set 2) Classify the test d ata set int o pred efined class labels. There is gro wing ev idence that merging classification and association rule mining toge ther can prod uce more efficient and accurate cla ssification s ystem than traditio nal classificatio n techniques. Genetic algorith ms are typicall y used for prob lems that cannot be solved efficie ntly with traditional technique s. Genetic algorithms seem to be useful for searchin g very gener al spaces and op timization pro blems. Coronary heart disease i s epid emic in I ndia and one of the major causes of d isea se burden a nd death s. Data from registrar general of India shows t hat heart di seases ar e majo r cause of death in I ndia, stu dies to d etermine the precise cause o f d eath in urban Chen nai a nd rural ar eas of A.P have revealed that CV D cause about 40% of the deaths in urban and 30% in rural ar eas [2 ]. In thi s p aper we pro pose genetic algorith m based associative cla ssification for heart disease pred iction. A brie f introduction about a ssociativ e classificatio n, genetic al gorithms and heart diseases are given in t he followin g subsections, follo wed b y related work in section 2.sectio n 3 deals with our pro posed method. Section 4 deals with results and disc ussions. We will conclude our final re marks in sectio n 5. 1.1 Associative Cla ssification Classification is o ne o f the most i mportant ta sks in data mining. Researc hers are focusing o n designing c lassificatio n algorithm to build accurate and efficient cla ssifiers for large data sets. Associate classi fication achieves hi gh accuracy, its rule s are interpretab le and it provides confidence pro bability when cla ssifying ob jects which can b e used to solve classi fication pro blem uncerta inity.Therefore, it b ecomes hot the me in recent years [3]. Associative classification i s a special case of a ssociation rule minin g in which cla ss att ribute is considered in the rule’s consequent. For example in a r ule A B, B must be a class attribute. A cla ssifier is o f the form A 1 , A 2 , ---A n B, where A i is a n attrib ute a nd B is a clas s. Rule i tem that satisfy minsup are ca lled freq uent rule items, while the rest are calle d infrequent rule ite ms.Assocaitive cla ssification is to co llect rules in trai ning data set D, organize the m in a certai n ord er to form a classi fier. When pr ovided an unlabelled o bject, the cla ssifier selects t he rule in accordance with the ord er whose condition matches the ob jects and assigns cla ss labels o f the rule to it. Table 1 .T raining data set Sl.no A1 A2 A3 CLASS 1 a 11 a 21 a 31 C1 2 a 12 a 24 a 32 C2 3 a 13 a 23 a 33 C0 4 a 11 a 21 a 31 C1 5 a 12 a 22 a 32 C2 1.2 Genetic Algorith m Genetic algor ithms are computing methodologies constructed in analo gy with the pro cess of e volution [4 ].It closely resembles the natural process of regeneratio n, repro duction, inheritance e volution. Ge netic algor ithms are typicall y used for prob lems that cannot be solved efficiently with tra ditional tec hniques. Genetic a lgor ithms seem to be use ful for searching very general s paces and o ptimization p roblems. Each solu tion generated in Ge netic algorith ms is called a chromoso me (individual).E ach chromosome is made up of genes, which are the individua l elements (alleles) that rep resents t he problem. The collection of chro mosomes is called a p opulation. The internal representation of the chromoso mes is known as its genotype. This can be either bit s trings or gray codes or hexadecimal codes. The external manifestation of the ge notype or the r eal world r epresentation o f the genotype i s Author/Title of the Manuscript known as the phenotype [5 ].Basically there are three genetic o perators ar e used for g enerating new strings. T he functions of ge netic operator s are as follo ws: 1) Selection: selectio n deals with the probab ilistic survival of t he fittest in t hat, more fit chromosomes are chosen to survive. 2) Crossover: T his op eration is p erformed b y selecting a r andom gene alo ng the length o f the chromosomes and swapping all the genes after that point. Var ious types o f crossover operato rs are a) single point b) t wo point c) uni form d) hal f unifor m e) reduced surrogate crosso ver f) shuffle cros sover g) se gmented crossover [6]. 3) Mutation: mutation alters the new sol utions so as to add stoc hasticity in t he search for better solution. T he most common method way o f implementi ng mutations is to select a bit at random and flip (change) its value. There are 2 types of mutations use in ge netic networ k pro gramming 1) mutating t he j udgment node 2) mutating the val ue of the ju dgment node. In associative classificatio n attrib utes and their values are taken as judgment nod es and class values as p rocessing nod es. Fitness function: Id eally the discoved r ules should have a ) high predictive acc uracy b) be comprehensible c) b e interesting. T he accomplishment of a ge netic algorithm i s directl y linked to the accurac y of the fitness fu nction. 1.3 Heart Disease Coronary heart disease is a narrowing of the s mall b lood ve ssels that suppl y bloo d and oxygen to t he heart. T his is also called as coronary arter y d isease. Coro nary heart diseas e is usually caused by a condition called a therosclerosis, which occurs when fatty material and a substance called plaque builds up on t he walls of arteries. T his causes them to get narrow. As the coron ary arteries narro w, blood flo w to the heart c an s low do wn or stop, cau sing chest pain,shorteness of b reath, hea rt a t tack, and other symptoms. Men in their 40 ’s have higher risk of Coronar y heart disease tha n women, but as women gets o lder, their risk in creases so that it is a l most equal to a man’s ris k. Majo r risk factors for Coronar y heart disease are 1) Diabete s 2) Hig h blood pressure 3) Hi gh LDL ( bad) cholesterol 4) low LDL (good) cholesterol 5) Not getting eno ugh physical activity6) Obesity7) Smoki ng. India is un dergoing rapid epide miological transition as a consequence of econo mic and social chang e, and cardiovascular disea se is beco ming an increas ingly impo rtant cause of death. India ’s diseas e pattern has undergone a major shift o ver the p ast decad e. As per WHO rep ort, at p resent out o f 10 deaths in India, eight are caused b y no n communicable diseases, such as cardio vascular disease s, and d iabetes in urban i ndia.In rural I ndia, 6 o ut o f ever y 10 d eaths is ca used by NCD ’S [7 ].Data fro m re gistrar general of India shows that heart attac ks are maj o r cause of deaths in india.in Andhra Pra desh 30% of rural pop ulation died due to CHD. There is an urge nt need for development a nd implementatio n of suitable p rimordial, primary, and secondar y prevention ap proaches to con trol this epide mic. An urgent and sincere b ureaucratic, political, and social will to initiate steps i n this direction i s required. 2 Related Work Large no. Of work i s carried out in fi nding efficient methods of medical d iagnosis for v arious disease s. Our work is an attempt to predict the cardiac disease in Andhra P radesh using data mining. Carlos imple mented efficien t search for diagnosis o f heart disease co mparing associatio n rule s with deci sion tree s [8].A novel technique to develop the multi-parametric featur e with linear a nd non linear chara cteristics of HRV was proposed b y Hea n Gyu le e et al. [9].A model i ntelligent he art diseases pr ediction s ystem b uilt with the aid of d ata mining techniq ues like decisi on trees, naive ba yes and neural network was pro posed by sellapp an palaniappan e t al[10]. The problem o f identifying constrai ned association rules for heart disease pr ediction was studied by Carlos Author/Title of the Manuscript Ordonez [11 ].MA.jabbar, Priti Chandra, B. L.Deekshatulu pr op osed evolutionary algo rithm for heart disease prediction. T hey used genetic algorith m to predict the heart d isease for Andhra Prad esh population [1].Enhanced predictio n of heart disease with feature s ubset select ion usin g ge netic al gorithm was prop osed by M. Ambarasi et al [12].Intelligent a nd effective h eart attack pr ediction syste m using data mining and AINN was p roposed by [13].They employed the multilayer p erception neural network with back prop agation a s the traini ng algorith m. Grap h based approach for heart disease prediction was p roposed by M A.jabba r, B.L.Deekshat ulu, and Priti Chandra [14].Their method is b ased on maximum clique a nd weighted as sociatio n rule mi ning. Associati ve clas sification for heart disease pred iction was pr oposed by MA.jabb ar, B.L.Deekshatul u, and Pr iti Chandra [ 15].They u sed Gini inde x based classification to pred ict the heart disease. Cluster based association r ule minin g for heart attack predictio n was proposed by M A.jabbar, B .L.Deekshatulu, and Priti Chand ra [16] .Their method is based o n dig it sequence a nd clustering. T he ent ire data bas e is d ivided into p artitio ns of equal size a nd a ssociation rule will be mined fro m each partition. In this paper we propo se efficient associatio n classificat ion for heart di sease predict ion for A ndhra Prad esh population. W e used Gini index to prod uce a compact rule set and filter rules f urther by ap plying Z-Statistics and genetic algorith m. 3 Proposed M ethod Most of the associative clas sification algorithms adopt the exhaustive search method presented in the famous APRIORI algorithm to d iscover the ru les a nd require multiple passes over the data b ase. Furthermore, they find frequent items i n one phase a nd generate t he rules in a sep arate phase consu ming more res ources such as sto rage and processing ti me. Moreo ver, since r ule ran king pla ys an i mportant ro le in cla ssificatio n and the majo rity of t he associative classifier s select ru les mainly in ter ms of their confid ence levels. Even a fter pruning i nfrequent ite ms, the APRIORI associatio n rule generatio n p rocedure, pro duces a huge no. of asso ciation r ules . If all the rules are u sed in the classifier then t he accuracy of t he classifier would be h igh but t he building o f classificatio n will be slo w. In order to i mprove the ac curacy o f as sociative classification we propose an i nformative attribute entered rule generation and hypothesis testi ng Z- statistics for heart d isease prediction. The class association rules are represented as chromosomes and Mic higan app roach is used to encod e the rules. 3.1 Proposed Algo rithm STEP 1 : find Gini index of each attr ibute. The attrib ute with minimu m Gini index is sele cted for class associatio n rule generation. T hese class associatio n rules are kno wn as initial pop ulation and rep resented as chro mosomes. 1 0 2 )] / ( [ 1 c i t i p t Gini STEP 2 : Evaluate fitness of rule u sing Z statistic s Z=S(X)-Minimum s upport/SQ RT (min sup *(1-minsup))/N Where S(X) is supp ort of patter n and min sup is user defined threshold STEP 3 : P rune the rules based on Z statistics. After rule evaluation t he rules havin g highest fitne ss are stored in a pool. T hen apply genetic functio ns on these rules. STEP 4 : P erform single point c ross over. J udgement nodes are selected for cr ossover. Author/Title of the Manuscript STEP 5 : P erform mutation by mutating the value of judgme nt node. T his process will be repeated till last generation reached. STEP 6 : Build classifiers usin g the generated Rules STEP 7 : P redict the rules on t est data STEP 8 : Find the acc uracy of the data set Accuracy = Number of obj ects correctly Classi fied Total No. o f objects in the test set. 3.2 Explanation o f Algo rithm A) Attribute selectio n based on Gini Index An informative attr ibute centred rule generation pro duces a compact rule. Gini index is used as filter to r educe the no. of candidate ite m sets. It is used to select the best attribute. T hose attributes with minimum Gini index ar e selected for rule generatio n. 1 0 2 )] / ( [ 1 c i t i p t Gini (1) Let us consider a sample medical tr aining data set gi ven in table 2 . Table2 : Example Medical Training data No. mcv alkphos sgpt sgot gammagt drinks selector 1 85.0 92.0 45.0 27.0 31.0 0.0 1 2 85.0 64.0 59.0 32.0 23.0 0.0 2 3 86.0 54.0 33.0 16.0 54.0 0.0 2 4 91.0 78.0 34.0 24.0 36.0 0.0 2 5 87.0 70.0 12.0 28.0 10.0 0.0 2 6 98.0 55.0 13.0 17.0 17.0 0.0 2 7 88.0 62.0 20.0 17.0 9.0 0.5 1 8 88.0 67.0 21.0 11.0 11.0 0.5 1 9 92.0 54.0 22.0 20.0 7.0 0.5 1 10 90.0 60.0 25.0 19.0 5.0 0.5 1 After calculati ng Gini index o f each attribute sgpt has the lo west Gini index. So sgpt would b e the better attrib ute. The rules generated like the follo wing are considered for classifier. 1. sgpt='(-inf-19.1] ==> s elector=2 2. sgpt='(-inf-19.1]' gammagt ='(-inf-34.2]' ==> select or=2 3. sgpt='(19.1-34.2]' sgot=' (20.4-28.1]' ==> select or=2 4. sgpt='(19.1-34.2]' gam magt='(-inf-34.2]' ==> s elector=1 5. sgpt='(19.1-34.2]' drinks='(- inf-2]' ==> select or=1 Author/Title of the Manuscript B) Z-Statistic (H ypothesis Testing ) Hypothesis Testing is a stati stical inference proc edure to determine whether a conjecture or hypothesis s hould be accepted or rejects based on the evidence g athered fro m data [1 7]. In our p ropo sed approach we use Z-Statistic to verify the qualit y of pattern or rule.Vario us steps invol ved in testi ng of hypothesis ’ -Statistic is preferred if t he sample size is greater t han 30. 1) Null Hypothesi s : De fine a null hypothesis H O taking into consideratio n t he nature of the pr oblem a nd data involved. 2) Alternativ e Hy pothesis : set up alter native hypot hesis H 1 so that we could decid e whether we should use o ne tailed and t wo tailed test. 3) Level of significance : Select t he appro priate level of significance( α ) 4) Test statistics: c ompute Z stat istics Z=S(X)-Minimum suppo rt/SQRT (min sup*(1-minsup))/ N 5) Conclusion :co mpare the computed value of Z statistics with the critic al value of Z α (given i n Z-Statis tic Table) at given level o f significance( α ) If |Z|< Z α accept the null hyp othesis If |Z|>| Z α reject null h ypothesis [18 ].Fig 1 shows le ft tail and right tail test. Table 3: Critical values of Z Example : Let N=10000 S( X) =11 % M inimum S upport =10% Z-Statistic under null hypo thesis is Z=3.33.Suppose level of significa nce ( α ) =0. 001 sets up a rej ection regio n with Z α =3.09. Since Z> Z α , the null hypo thesis i s rej ected and the pattern is co nsidered statisticall y interestin g. Fig. 1. (a) Left tail test (b) right tail test Level of significance 1% 5% 10% Two tailed test |Z α|= 2.58 |Z α|= 1.96 |Z α|= 1.645 Right tailed test Z α =2.33 Z α =1.645 Z α =1.28 Left tailed test Z α =-2.33 Z α =-1.64 5 Z α =-1.28 Author/Title of the Manuscript C) Crossover and Mutatio n Crossover opera tor forms off sp rings by combinin g judgment nod es which are selected a s crossover nod es. We used single point crosso ver in our a pproach After crossover 1) Mutatio n the judg ment node . 2) Mutatio n the value of judgment node D) Accuracy Co mputation Accuracy measures t he ability o f the classifier to correctly classify u nlabelled data. Accuracy = Number of obj ects correctly Classi fied Total No. o f objects in the test set. AGE BP <30 1 NO < 3 0 AGE DIABET ES >40 2 YES Parent 1 Parent 2 AGE DIABET ES <30 1 YE S 0 AGE BP >40 2 NO Child 1 Child 2 AGE DIABET ES <30 1 NO AGE BP <30 2 YES Before mutation After mutation AGE BP >40 1 Yes AGE BP >40 2 NO Before mutation After mutation Author/Title of the Manuscript 4 Results and Discu ssion We have e valuated the accurac y of our proposed method on 6 d ata sets fro m SGI machine learning rep ository [19] and 2 medical data sets from UCI Machine learning r epositor y [20] .A brief description about the data sets was presented in table 4.Attributes selected bas ed o n Gini index for various data sets is sho wn in tab le 5.The accuracy is obtained using 10 fold cross validation. T able 6 shows t he accuracy for the different d ata sets using our p roposed appro ach. Figure 1 &3 shows acc uracy of various data sets. Tab le 8 and 9 represent s comparison of acc uracy on var ious data sets. fig 2 sho ws statistics o f heart disease. Table 4 : Data set Description Table 5 : Data sets a nd attribute selecte d based o n Gini index Table 6 : Accurac y of various data sets Table 7: Attribu tes selected f or heart disease p rediction Table 8 : Accurac y of medical data sets Table 9 : Accurac y of Data Sets (non medical) Data Sets Transa ctions Item s Classes XD6 Data 150 9 2 Parity 100 10 2 Lens Data 24 9 3 Multiplexer Data 100 12 2 Weather Data 14 5 2 Balloon data Diabetes Breast cancer 36 768 286 4 9 9 2 2 2 Data set Attribute selected ba sed on Gini index XD6 Data A8 Parity data A5 multiplexer OUTPUT 1 Lens data Tear production ra te Balloon data Age Weather data Diabetes Breast cancer Humidity Plas Deg lalig Data set Accuracy XD6 Data 75.75 Parity data 72 multiplexer 60 Lens data 84 Balloon data 84 Weather data 92.8 Sl.no Attribute Name 1 Age 2 BP Systolic 3 BP Diastolic 4 gender 5 Hypertension 6 Diabetes 7 Rural/Urban Data sets J48 Naïve bayes GNP NN Our Method GNP Using chi square method Pima Indian Diabetes 75.5 76.3 78 65.1 82 74.41 Breast Cancer 74.2 71.67 77.27 70.27 84.8 93 Heart Disease Data (A.P) 80 76 - 82 98 - Average accuracy 76.56 74.65 77.6 72.45 88.9 83.70 Data sets C4.5 Naïve bayes Our Proposed Method XD6 78.6 - 76 Parity 53.3 40 72 Lens 83.3 70.8 84 Multiplexer 61 61.9 60 Balloon 83 72 84 Weather 50 57.14 92.8 Author/Title of the Manuscript The perfor mance of our pro posed method is evaluated o n 2 medica l data sets d iabetes and cancer da ta sets b y comparing it with the traditio nal classification algorith ms like j 48, naive bayes, neural net works and GNP [21].Accurac y o f p ima data has b een i mproved using genetic net work p rogramming (GNP ).it has 1%improvement than traditional naive ba yes classi fication algorithm, a nd 4.6%improve ment over breast cancer data. T he acc uracy o f heart d isease data using j48 is 4% higher than naive bayes and the accurac y has been i mproved b y using NN.J4 8 outperfor med naive bayes and ne ural networ ks for P ima and cancer data. Our proposed approach reached 7 .5%improve ment o ver GNP with chi sq uare[22 ]for pima Indian diabetes data. Our appro ach reached the best accuracy, compare d w ith other clas sification a lgorithms. So our proposed algorith m p erfor ms better than trad itional classi fication algorithms. A pos sible rea son for efficient classification system pro duced b y o ur algor ithm is the fact that it e mploys genetic algor ithm and h ypothesis testing. The use o f genetic al gorith m and hypo thesis testing Z Statistic propo sed in our alg orithm suggest the validity of t he hypothesis, which states the more co nstraints impo sed to d iscriminate b etween generated rules, the more rando m selectio n is minimized, which increases t he accuracy of the cla ssifier. The data for heart disease pred iction was collected fro m various corpor ate hospitals from Andhra Prade sh and opinion fro m e xpert do ctors. Attribute age is d iscritized as age 0 -45 and age>45 .Attribute a ge>45 is chosen as in formation centre d attribute b ased on c omputing Gini index. So me of the r ules generated predicting the Heart diseases are 1. AGE>45, BP Diastolic, B P systolic, diabetes=> Hear t Disease 2. Age>45, BP Diastolic, BP systolic, Hypertension, d iabetes=> He art Disease 3. AGE>45, BP Diastolic, diab etes=> Heart Disease 4. AGE>45, BP Diastolic, Male, diabetes=> Hear t Disease 5. AGE>45, BP Diastolic, Male, Hypertension, d iabetes=> Hea rt Disease 6. AGE>45, BP Diastolic, Hypertensio n, diabetes=> He art Disease 7. AGE>45, BP Diastolic, Hypertensio n, rural=> Heart Disea se 8. AGE>45, BP systolic, Hypertensio n, diabetes=> Heart Disease 9. AGE>45, diabe tes, rural=> Heart Disease 10. AGE>45, Male, H ypertension, d iabetes=> Heart Disease 11. AGE>45, Male, H ypertension, rural=> Heart Disease 12. AGE>45, Hypertension, d iabetes=> Heart Disease Results: 1) Majo rity of the people who had CVD were in the age group 46 -65 2) Among all t he participants o f the stud y 60%of the males and 40%of the female s had heart d isease. 3) 50%of the males who had h ypertension are associated with CVD 4) 8%of the fe males who had h ypertension are associated with CVD 5) A Higher pe rcentage of males were found to b e Diabetic (30%) 6) 38% o f the people wh o lives i n urban areas are asso ciated with heart disease 7) Hypertension a nd Diabetes acco unt for 30%o f all cases. 8) Among all t he cases males had a higher systolic p ressure(44% cases) 9) 32%of Males who live in urban ar eas are associated more with heart di sease. Author/Title of the Manuscript Fig. 1 Accuracy of various data sets by our algor ithm Fig. 2 Statistics o f Heart Disease Fig .3 Accurac y of Medical data sets 5 Conclusion And F uture wor k In t he rece nt years I ndia a nd other d eveloping countrie s have witnessed a rapidly e scalatin g epide mic o f cardiovascular disease ( CVD). It is pred icted that by 202 0 coronary heart d isease will be lead ing ca use of death in adult Indians, and Andhra Prad esh is in r isk o f more deaths d ue to CVD.T he need to contain the epidemic o f cardio vascular d isease as well as co mbat it s impact and minimize its to ll on Andhra Pradesh is obvious a nd ur gent. Hence a decision support system is p ropo sed to identify a risk score for p redicting the heart disease. In this paper, we p rop osed a system for heart disease prediction using data mining techniques. I n our feat ure work we p lan to reduce no. of attrib utes and to determine t he attrib ute which contribute to wards the diagnosis o f disease usi ng genetic algor ithm. References [1] MA.Jabbar , B. L.Deekshatulu and P riti Chandra.: An evolu tionary algorithm for heart disease prediction, ICIP, CCIS 292 PP 378 - 389, Springer-Verlag (2012 ) [2] Rajeev G upta.: Recent trends in coronary h eart disease epidem iology in India, Indian he art journal, pp B4 -B18 (2008) 0 20 40 60 80 100 120 Na ï v e bayes J 48 GN P NN Our pr op osed method Pim a Breast Can c er He ar t Disease Author/Title of the Manuscript [3] Zhonghua Tang and Qin liao.: A new class based associativ e classification algorithm , IAENG, IJAM 36:2(2007) [4] Goldberg DE.: Gene tic Algorithm in search, optim ization and machine learning, Addison We sley (1989) [5] S.P Syed Ibrahim et al .: An Evolutionary approach for rule s et s election in a cla ss bas ed ass ociative classifier.Europian journal of scientific research, vo l 50 no 3pp417-425(2011) [6] Picek, S., Golub, M.: On the Efficiency of Crossover Operators in Genetic Algorithms with Binar y Representation. In: Proceedings of the 11th WSEAS I nternational Conferen ce on Neural Networks (2010) [7]The Times of In dia.14 th august 2011 [8] Carlos Ordonez.: Comparing asso ciation rules and de cision trees for heart disease prediction, ACM, HI COM (2006) [9] Hean Gyu Lee et al.:Mining bio signal data :CAD Diagnosis using linear and non li near fea tures of ARV,LNAI 4 819 pp 56 - 66(2007) [10] Sellappan Palaniappan et al.: Intelligent heart dis ease p rediction on s ystem using data mining techni ques.IJCSNS Vol 8 no 8(Aug 2008) [11] Carlos Ordonez.: Improvin g Heart Disease Prediction using constrained association Ru le, seminar presentation at TO KYO (2004) [12] M.Ambarasi etc al.:, Enhanced Pr ediction of Heart Disease with Feature subset selection using Genetic A lgorithm, IJESI, Vol 2( 10) (2010) [13] Shantakum ar B p atil etc all.: Intelligen t and effective he art attack prediction sy stem using data mining and artificial ne ural network,Europian journal of scien tific research vo l 31,No 4(2009) [14] MA.Jabbar, B.L.Deekshatulu and Priti Chandra.: Graph based approach for heart dis ease p rediction. In: p roceedings of ITC 20 12, Bangalore, Springer-Verlag (2012) [15] MA.Jabbar, B.L.Deekshatulu and Priti Chandra.: Knowledge Discovery using Associative Classification for Heart Dis ease Prediction. In: In ternational symposium on Intelligent Informatics (ISI 2012) (Springer) [16] MA.Jabbar, P riti Chandra, B.L.Deekshatulu..:Cluster based association rule minin g for heart at tack prediction,JATIT,vo l 32,no 2,(Oct 2011) [17] Ping Nin g tan, Steinbach, vipin Kumar. : Introduction to Data Mining, Pearson Education, (2006) [18] Krishna Gandhi: Probability and Statistics, S.Ch and (2011) [19] http://www.sgi.com /tech/mlc/db [20] UCI Machine Learning Repository http://archive .ics.uci.edu/ml [21] Koza , J.R, Ge netic Programming: On the Programming of Computers by Means of Natural Selection, MI T Press (1992) [22] S.P Syed I brahim et al.:Efficient associativ e classification using genetic network program ming, IJCA,Vol 29,No 6 sep(2011)
Original Paper
Loading high-quality paper...
Comments & Academic Discussion
Loading comments...
Leave a Comment