Supervised, semi-supervised and unsupervised inference of gene regulatory networks
Inference of gene regulatory network from expression data is a challenging task. Many methods have been developed to this purpose but a comprehensive evaluation that covers unsupervised, semi-supervised and supervised methods, and provides guidelines…
Authors: Stefan R. Maetschke, Piyush B. Madhamshettiwar, Melissa J. Davis
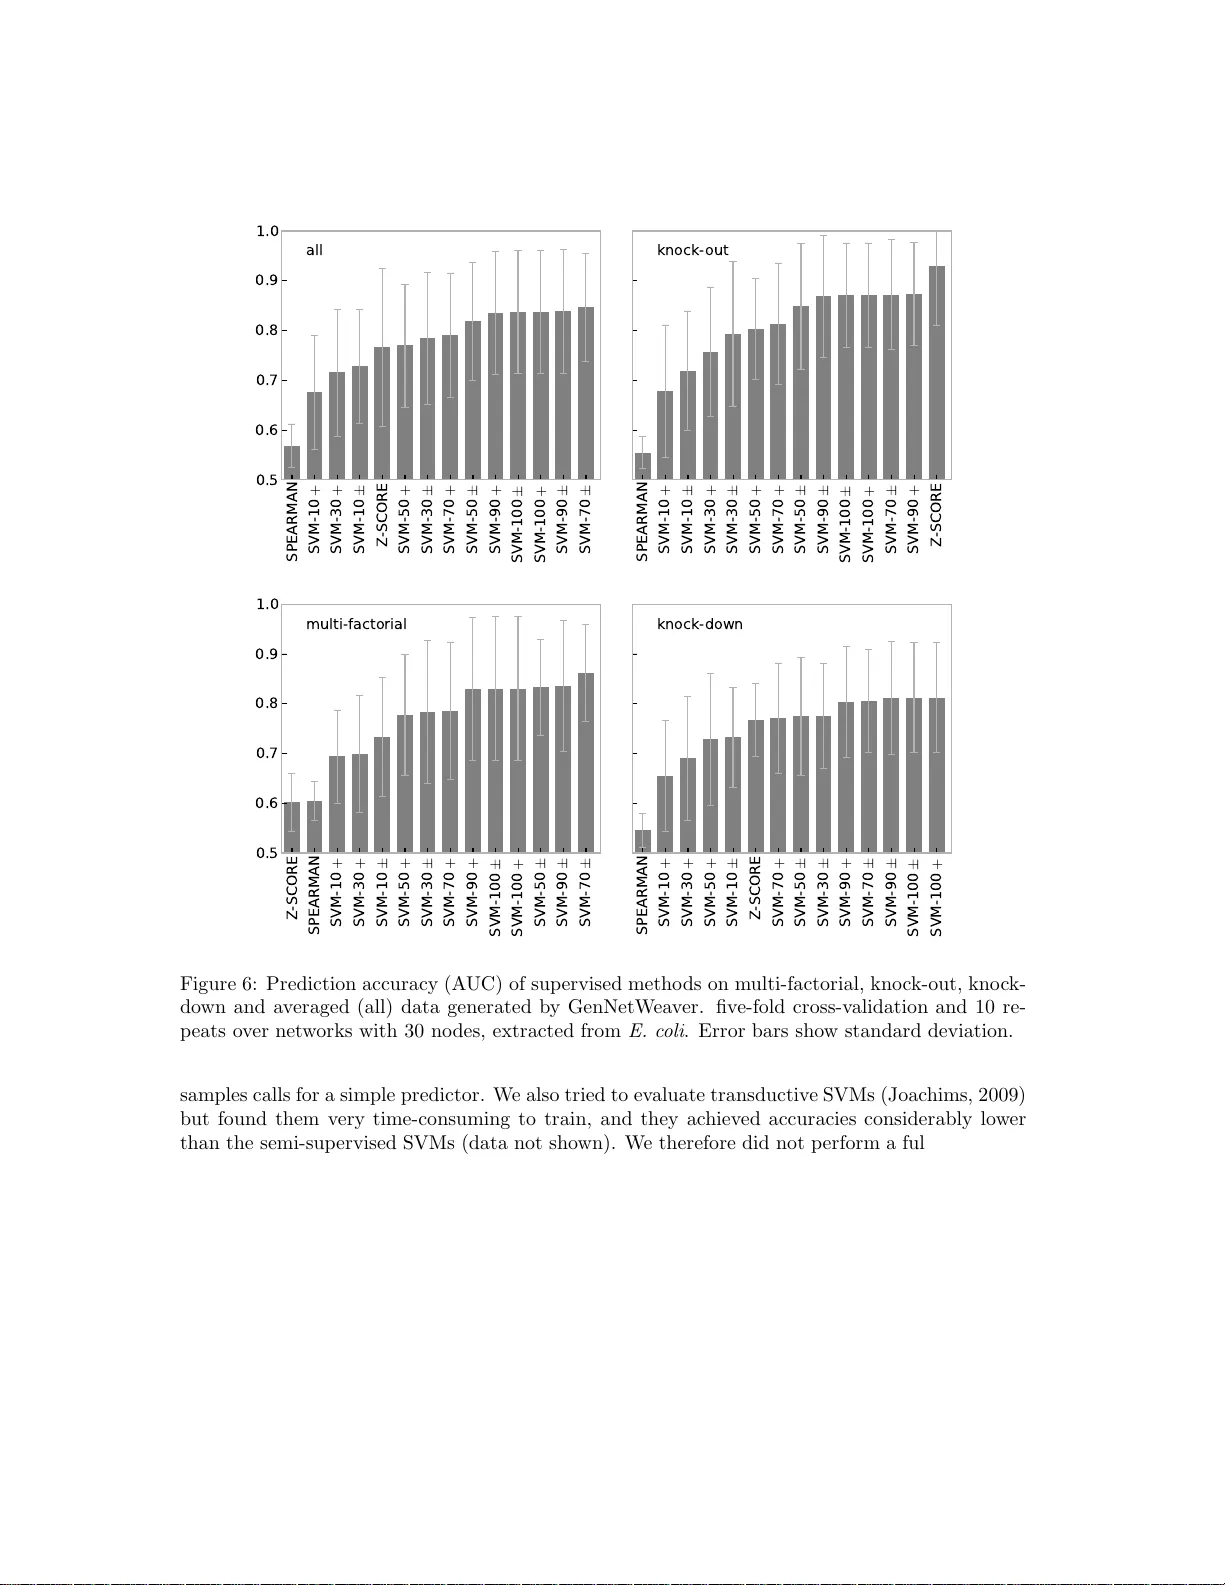
Sup ervised, semi-sup ervis ed and unsup ervised inference of gene regulatory net w orks Stefan R. Maetsc hk e 1 , Piyush B. Madhamshettiw ar 1 , Melissa J. Da vis 1 and Mark A. Ragan 1 , 2 1 The Univ ersity of Queensland, Institute for Molecular Bios c ience 2 Australian Resear c h Council Centre of Excellence in Bio informatics Abstract Inference of gene regulatory netw ork from expression data is a c hallenging task. Man y metho ds hav e b een developed to this pu rpose but a compreh ensiv e ev aluation that cov ers un- sup ervised, semi-superv ised and sup ervised metho ds, and provides guidelines for their p rac- tical app licati on, is lac kin g. W e p erformed an extensiv e ev aluation of inference m ethods on simula ted exp ressi on data. The results revea l very l ow prediction accuracies for unsup ervised tec hn iques w ith the notable exception of the z-score metho d on knock-out data. In all other cases the sup ervised a pproach ac hieved th e highest accuracies and even in a semi-sup ervised setting with small num b ers of only p ositive samples, outp erforme d the unsup ervised techniques. 1 1 In tro duction Mapping the topolo gy of gene regulatory netw o rks is a central problem in systems biolo g y . The regulator y ar c hitecture co n tr o lling g e ne expression a lso co n tro ls cons equen t cellular b eha vior such as development, differentiation, homeo stasis a nd resp onse to stimuli, w hile deregulation o f these net works ha s b een implicated in oncogenes is and tumor progr ession (Pe’er and Hacohen, 201 1 ). Exp erimen tal metho ds ba sed e.g . on chromatin immunoprecepitation, DNaseI hypersensitiv ity or protein- binding assays are capa ble o f deter mining the nature of ge ne reg ulation in a given system, but are time-c o nsuming, expe nsiv e and r e quire an tib odies for each transcription factor (Elnitski et al. , 2006). Accurate computational methods to infer gene reg ulatory netw o r ks, par - ticularly metho ds that leverage g e no me-scale experimental data, are urgently r equired not only to supplement empirical approa c hes but a lso, if p ossible, to explore these data in new, more- int egrative w ays. Many co mputational metho ds ha ve b een develop ed to infer regulatory netw or ks from gene ex- pression data, predominately employing unsupervised techniques. Several comparisons ha ve b een made of netw ork inference metho ds, but a comprehensive ev aluation that covers unsupervis ed, semi-sup ervised and sup ervised metho ds is lacking, a nd many questions rema in o pen. Her e w e address fundamental ques tio ns, including which metho ds are suitable for what kinds of exp eri- men tal data types, and how many samples th ese metho ds r equire. The most-recent and la r gest c o mparison so far has b een p erformed by Ma dhamshettiw a r et al. (2012). They c o mpared the prediction accur acy o f eig h t unsuperv is ed a nd one s upervised method on 38 simulated data sets. The metho ds show ed la rge differences in pr ediction accurac y but the sup ervised metho d w as found to p erform bes t, despite the parameters of the unsup ervised metho ds having b een optimized. Here we extend this study to 17 unsup ervised metho ds and include a direct compar ison with sup ervised a nd semi-sup ervised metho ds on a wide ra nge of net works and exper imen tal data types (kno ck-out, knock-down and multi-factorial). Another comprehensive ev alua tio n, limited to unsup ervised metho ds, has been p e r formed as part of the Dialogue for Reverse Engineering Assess men ts and Metho ds (DREAM), an annual open comp etition in net work inference (Stolo v itzky et al. , 2007, 2 009; Marbach et al. , 2010; Pr ill et al. , 2010; Marbach et al. , 2 012). Results from DREAM highlight that netw ork inference is a chal- lenging problem. T o quo te Prill et al. (2010): “The v as t ma jority of the teams’ predictions were statistically equiv alent to random guesses.” Ho wev er , an imp ortant result of the DREAM compe- tition is that under certain co nditions simple methods can perfor m well: “...the z-sco r e predictio n would ha ve placed s econd, fir st, and first (tie) in the 10- node, 50-no de, and 100 -node sub c hallenges, resp ectiv ely” (Prill et al. , 2010). Unsuper vised metho ds rely o n expression data o nly but tend to achieve lo wer prediction ac cura- cies than sup ervised methods (Mo r delet and V ert, 2008; Cerulo et al. , 2010; Madhamshettiwar et al. , 2012). By con trast, sup ervised methods require information a bout k no wn in tera ctions for tra in- ing, and this informa tion is typically sparse . Semi-sup ervised metho ds reflect a compromise and can b e trained with muc h few er interaction data, but usually a re not as acc urate predictors as sup e rvised metho ds. One of the few c o mparisons with supe r vised metho ds w as p e rformed by Mordelet and V ert (2008). They ev alua ted SIRENE (Sup ervised Inference of Regulatory Net- works) in co mparison to CLR, ARACNE, Relev ance Netw or k s (RN) and a Bay esian Netw o rk on an E. c oli b enc hmark data set by F aith et al. (200 7) a nd found that the sup ervised metho d considerably outp erformed the unsup ervised techniques. Cerulo et al. (2010) compared supervis e d and semi-sup ervised suppor t vector mac hines with t wo unsup ervised metho ds and found the former sup e rior. Our ev aluation employs similar super- vised and semi-sup ervised metho ds but includes many more unsuper vised methods, disting uishes betw een exp erimen tal types a nd p erforms replicates, resulting in a more -complete picture. A re- lated ev alua tion by Schaffter et al. (2011) compared six unsuperv is ed metho ds on larger net works with 100, 2 00 a nd 500 nodes and simulated expre s sion data. Again the z-score method was found to be one of the top per formers in kno c k-out exp erimen ts. Several smaller ev aluations hav e been p erformed but are largely restr icted to four unsuper vised metho ds (ARACNE, CLR, MRNET and RN) in compar isons with a novel approach on small 2 data sets. The ARA CNE metho d was intro duced by Marg olin et al. (200 6 ) and show ed sup erior precision and recall when compar ed to RN and a Bay esian Netw ork algor ithm on simulated net- works. Mey er et al. (200 7) compar e d all fo ur unsup ervised inference algorithms on larg e y east sub- net works (100 up to 100 0 nodes) using simulated expres sion data, and Altay and Emmert-Streib (2010) inv estigated the bias in the predictions of those algo rithms. F aith et al. (2007) ev alua ted CLR, ARACNE, RN a nd a linear reg ression model on E. c oli interaction data from RegulonDB and found CLR to outper form the other methods. Lo pes et al. (2009) studied the prediction accuracy of ARA CNE, MRNET, CLR and SFFS+MCE, a feature s election algorithm, on sim ula ted net- works and found the latter sup erior for netw o rks with small no de degree. Haynes and Bren t (20 09) developed a synthetic regulatory net work gener ator (GRENDEL) and measur ed the prediction accuracy o f ARA CNE, CLR, DBmcmc and Symmetric-N for v ar io us netw o rk sizes a nd different exp erimen tal t yp es. W erhli et al. (20 06) co mpared RN, gra phical Gaussian mo dels (GGMs) a nd Bay es ian netw orks (BNs) on the Ra f pathw ay , a small cellular sig na lling netw or k with 11 pro teins, and on s im ulated data. BNs and GGMs were found to outp erform RN on observ ationa l data. Camacho et al. (2007) compared Regulatory Strengths Analysis (RSA), Reverse Engineering by Multiple Regression (NIR), P a rtial Co rrelations (PC) a nd Dynamic Ba yesian Netw o rks (BANJO) on a small, simulated netw o rk with 10 g enes, with different levels of noise. In the noise-fr ee scenario the PC metho d sho wed the highest accur acy . Finally , Ca n tone et al. (20 09) constructed a small, synthetic, in vivo netw or k of five genes and measured time series and steady - state expressio n. In an ev alua tion of BANJO , ARACNE and t wo mo dels based o n ordinary differential equations they found the latter tw o to achieve the hig hest accuracie s . Bansal et al. (200 7 ) also ev aluated BANJO, ARA CNE and or dinary differential equatio ns but on ra ndom net works and simulated expressio n data. In the following sections we first describ e the different inference methods in detail, b efore ev aluating their prediction accuracie s on sim ulated gene expression data and regulatory netw ork s of v arying size. W e contin ue with a discussion of the prediction r esults and conclude with guidelines for the use of the ev alua ted methods. 2 Metho ds W e compared the pr ediction p erformance of unsup ervised, se mi- supervise d and super vised net- work inference metho ds. F ollowing other authors (Husmeier, 200 3 ; Mordelet and V er t, 200 8 ; Haynes and Bren t, 2009) w e assess prediction per formance by the Area under the Receiver Oper- ator Character istic cur v e (AUC) AU C = 1 2 n X k =1 ( X k − X k − 1 )( Y k + Y k − 1 ) , (1) where X k is the false p ositive rate a nd Y k is the true p ositiv e ra te for the k -th output in the ranked list o f predicted edge weigh ts. An AUC of 1 .0 indicates p erfect prediction, while an AUC o f 0.5 indicates a p erformanc e no b etter than r andom guessing. Note that in contrast to other measures s uc h as F1 scor e, Ma tthews cor relation, recall or precision (Ba ldi et al. , 200 0), A UC do e s not r equire choice o f a thres hold to infer interactions from predicted weigh ts; r ather, it compar es the predicted weigh ts direc tly to the top ology of the true net work. In the Supplementary Material w e nonetheless rep ort results based F1 s core a nd Matthews cor relation. T o avoid discrepa ncie s b et ween the gene expr ession v a lues g enerated by true net works a nd the actually known, pa rtial netw or ks, w e per formed our ev aluatio ns on simulated, steady-state expression da ta , g enerated fro m sub-ne tw orks extrac ted fro m E. c oli and S. c er evisiae netw orks. This allowed us to asses s the accuracy of a n algorithm against a p erfectly known true net work (Bansal et al. , 2 007). When comparing the true with the inferred netw o rk, the direction and t yp e of int eractio ns were ignored, since many inference metho ds can infer only the existence o f an interaction. F or the same reason self-interactions were excluded from the netw or k compari- 3 son. W e employ ed GeneNetWe aver (Ma rbac h et al. , 200 9 ; Schaffter et al. , 2011) and SynTR eN (V an den Bulck e et al. , 2006) to extra ct sub-net works and to simulate gene express ion da ta. GeneNetWe aver has b een part of several e v a luations, most prominently the DREAM chal- lenges. The simulator extracts sub- net works from known interaction netw o rks such as those of E. c oli and S . c er evisiae , emulates tr a nscription and tra nslation, and employs a set of ordi- nary differen tial e q uations descr ibing chemical kinetics to generate expression data for knock-out, kno c k -do wn and m ulti-fa c torial exp erimen ts . T o sim ulate kno ck-out exper imen ts the expres sion v alue o f each g ene is in turn set to z e ro, whereas for kno c k-down exp eriment s the e x pression v a lue is halved. In m ulti-factoria l exp eriments the express ion le vels of a s mall n umber o f genes is p erturbed by a small, random a mo un t. SynTR eN is a similar but older simulator. Sub-g raphs ar e also extra c ted from E. c oli and S. c er evisiae net works but it sim ulates o nly the transcription level and multi-factorial exp eriment s. How ever, SynTR eN is faster than GeneNetWe aver and allows o ne to v ary the sa mple num b er independently of the netw or k siz e. T o enable a co mprehensiv e a nd fair compa rison we ev aluated the pr ediction acc uracies of these inference methods o n sub-netw orks with differen t num b ers of nodes (10,...,11 0) extra cted from E. c oli and S. c er evisiae , a nd used three exp erimental data types (kno c k- out, kno c k-down, m ulti- factorial) with v ary ing s ample set sizes (10,...,110)) simulated b y GeneNetW eaver and SynTReN. W e p erformed no parameter optimization for unsupervised metho ds, since this would require training data (known in teractions) a nd render those metho ds super vised. F or the sup ervised and semi-sup ervised methods, 5-fold cross -v alidation was applied and parameters w ere optimized on the training da ta only . The following sections descr ibe the infere nc e metho ds in detail. 2.1 Unsuper vised This section describ es the ev aluated unsupe r vised methods. CLR, ARA CNE, MRNET and MRNET- B are part of the R pac k age “minet” and were c a lled with their default parameters (Mey er et al. , 2008), with the ex ception of ARACNE. With the default parameter eps = 0 . 0, ARACNE per - formed very p oor ly and we us ed ep s = 0 . 2 ins tead. Similarly , GENIE (Huynh-Thu et al. , 2010), MINE (Reshef, 201 1), and PCIT (Reverter and Chan, 2008) were installed and ev alua ted with de- fault parameters. All other meth o ds were implemen ted according to their r espective publications. SPEARMAN-C, EUCLID and SIGMOID ar e implementations of our own inference algorithms. 2.1.1 Correlation -based net work inference metho ds assume that co rrelated expres sion levels b etw een tw o genes a re indicative of a r egulatory in teraction. Co rrelation co efficien ts range fr om +1 to - 1 and a p ositive correla tion co efficient indicates an activ ating interaction, while a nega tiv e co efficient indicates an inhibitory interaction. The common co rrelation measure b y Pearson is defined as corr ( X i , X j ) = cov ( X i , X j ) σ ( X i ) · σ ( X j ) , (2) where X i and X j are the expressio n lev els of genes i and j , cov ( · , · ) denotes the cov ariance, and σ ( · ) is the standar d deviation. Pearson’s correlation measure assumes normally distributed v a lues, an assumption that do es not necessar ily ho ld for gene-express io n data. Ther efore rank-based measures are fr e quen tly emplo yed, with the measures by Sp earman and Kendall being the most common. Spea rman’s metho d is simply Pearson’s correlatio n co efficient for the r ank ed expressio n v alues, and Kendall’s τ co efficient is computed as τ ( X i , X j ) = con ( X r i , X r j ) − dis ( X r i , X r j ) 1 2 n ( n − 1) , (3) where X r i and X r j are the ranked expre s sion pr ofiles of genes i and j . con ( · , · ) deno tes the num b er of co nco rdant and dis ( · , · ) the num b er o f disconcordant v alue pa irs in X r i and X r j , with b oth profiles b eing of length n . 4 Since our ev a luation of prediction a ccuracy do es not distinguish between inhibiting and acti- v ating in teractions, the predicted in teraction w eights are computed as the a bsolute v alue of the correla tion co efficients w ij = | corr ( X i , X j ) | . (4) 2.1.2 SPEARMAN-C is a mo dification of Sp earman’s correla tio n co efficient where we attempted to fa vor h ub no des, which ha ve many , strong int eractions . The correla tion co efficient is corrected b y multiplying it by the mean correla tion of gene i with all o ther genes k , and the absolute v a lue is taken as the int eraction weight w ij = | cor r ( X i , X j ) · 1 n n X k corr ( X i , X k ) | , (5) where cor r ( · , · ) is Sp earman’s corr elation coefficient. 2.1.3 W GCNA stands for W eighted Gene Co-expression Netw ork Ana ly sis (Langfelder and Horv ath, 2 008) and is a modification of cor relation-based inference methods that a mplifies high cor relation co efficien ts by r aising the absolute v alue to the p o wer of β (“ softpow er”) w ij = | cor r ( X i , X j ) | β , (6) with β ≥ 1. Since softp o wer is a non-linear but monotonic transfor mation of the cor r elation co ef- ficient , the pr ediction accur acy measured b y A UC will b e no differ en t from that of the underlying correla tion metho d itself. Conseq ue ntly we sho w only r esults for corr elation methods but not for the WGCNA modification, which w ould b e identical. 2.1.4 RN (relev ance netw ork s) by Butte and Ko hane (200 0 ) mea sure the m utual information (MI) betw e e n gene expressio n profiles to infer interactions. The mutual infor mation I b etw een dis crete v a riables X i and X j is defined as I ( X i , X j ) = X x i ∈ X i X x j ∈ X j p ( x i , x j ) log p ( x i , x j ) p ( x i ) p ( x j ) , (7) where p ( x i , x j ) is the joint pro ba bilit y distribution of X i and X j , and p ( x i ) and p ( x j ) are the marginal probabilities. X i and X j are required to b e discrete v ariables. W e used equa l- width binning for discr etization and empirical entrop y estimation as desc r ibed by Mey er et al. (20 08 ). 2.1.5 CLR is the abbreviation for Context Likeliho od of Relatedness (F aith et al. , 20 07 ) and extends the relev ance net work method (RN) by taking the bac k ground distribution of the mutual infor mation v alues I ( X i , X j ) into a c coun t. The most pr obable interactions ar e tho s e that deviate most from the background distribution and for e a c h g ene i a maxim um z-sc o re z i is calcula ted as z i = max j 0 , I ( X i , X j ) − µ i σ i , (8) where µ i and σ i are the mea n v alue and standard deviation, resp ectiv ely , of the m utual information v alues I ( X i , X k ), k = 1 , ..., n . The interaction w ij betw een tw o genes i a nd j is then defined as w ij = q z 2 i + z 2 j . (9) 5 The ba c kg round correction s tep a ims to reduce the prediction of false interactions based on spu- rious cor relations and indirect in teractions. 2.1.6 ARA CN E stands for Algorithm for the Reco nstruction of Accura te Cellular Netw orks (Marg o lin et al. , 2 006), and is another mo dification o f the relev ance netw ork that a pplies the Data Pro cessing Inequality (DPI) to filter out indir ect interactions. The DPI states that, if gene i interacts with ge ne j via gene k , then the following ineq ualit y ho lds: I ( X i , X j ) ≤ min( I ( X i , X j ) , I ( X j , X k )) . (10) ARA CNE considers all poss ible triplets o f genes (in teractio n triangle s) and co mputes the mu- tual information v alues for each gene pair within the triplet. Interactions within an in ter action triangle are a ssumed to be indirect and are therefore pruned if they violate the DPI b ey ond a sp ecified tolerance threshold eps . W e used an threshold of eps = 0 . 2 for o ur ev aluations. 2.1.7 PCIT is an abbreviation of Partial Co rrelation and Infor mation Theory (Rev er ter and Chan, 2008) and is similar to ARACNE. PCIT extracts all po ssible in teraction tria ng les and applies the DP I to filter indirect in tera c tions, but uses partia l corr elation co efficien ts instead of mutual infor ma tion as interaction weigh ts. The partial co rrelation co efficien t corr partial ij betw een tw o genes i and j within an interaction triangle ( i, j, k ) is defined as corr partial ij = corr ( X i , X j ) − corr ( X i , X k ) corr ( X j , X k ) p (1 − corr ( X i , X k )) 2 (1 − cor r ( X j , X k )) 2 , (11) where corr ( · , · ) is Person’s correlation coefficient. The partial corr e la tion co efficien t aims to elim- inate the e ffect of the third gene k on the correlation of genes i and j . 2.1.8 MRNET (Meyer et al. , 20 07 ) employs m utual informa tion betw een ex pr ession profiles and a feature selection algorithm (MRMR) to infer in tera ctions b et ween genes. Mor e precisely , the method places ea ch gene in the role of a target gene j with a ll other genes V as its r egulators. The mutual infor mation betw een the tar get gene and the regulator s is calculated and the Minim um-Redundancy-Max imum- Relev ance (MRMR) method is applied to select the b e st subset of regulator s. MRMR step-by-step builds a set S by selecting the g e nes i M RM R with the larges t mutu al information v a lue and the smallest redundancy ba sed on the following definition i M RM R = argma x i ∈ V \ S ( s i ) , (12) with s i = u i − r i . The r elev a nce term u i = I ( X i , X j ) is thereby the mutual information betw een g e ne i and target j , a nd the redundancy term r i is defined a s r i = 1 | S | X k ∈ S I ( X i , X k ) . (13) Int eraction weigh ts w ij are finally co mputed as w ij = max( s i , s j ). 2.1.9 MRNET-B is a mo dification of MRNET that replaces the forward s election str ategy to identify the b est subset of re gulator g enes by a backward selection stra tegy follow ed by a seq ue ntial replace- men t (Meyer et al. , 201 0 ). 6 2.1.10 GENIE (GEne Netw or k Inference with Ensemble of trees) is s imila r to MRNE T in that it also lets each g ene take o n the role of a target regulated by the remaining g e nes and then employs a feature selectio n pro cedure to identif y the b est subset of regula tor genes. In cont rast to MRNET, Random F orests and Ex tra-T rees are used for regres s ion and feature selection (Huynh-Thu et al. , 201 0 ) ra ther than m utual infor ma tion and MRMR. 2.1.11 SIGMOID mo dels the r egulation of a gene by a linear co m binatio n with soft thresho lding. The predicted expression v alue X ′ ik of gene i at time p oin t k is describ ed by the sum ov er the weigh ted expr ession v alues X j k of the r emaining genes, constrained by a sigmoid function σ ( · ) X ′ ik = σ ( n X j 6 = i X j k w ij + b i ) (14) σ ( x ) = 1 1 + e − x . (15) The regula tory weigh ts w ij are determined by minimizing the following quadra tic erro r function ov er the pr edicted expression v alues X ′ ik and the obser v ed v alues X ik : E ( w , b ) = 1 2 X i X k ( X ′ ik − X ik ) 2 . (16) Finally , the in ter action w eig h ts w ′ ij for the undirected net work are computed b y av er aging over the forward and backw ar d weight s: w ′ ij = | w ij | + | w j i | 2 . (17) 2.1.12 MD (Mass-Distance) by Y ona et al. (20 06) is a s imilarit y measure for expression profiles. It estimates the pro babilit y to obser v e a profile inside the v o lume delimited by the pr ofiles. The smaller the volume, the more similar are the tw o pr ofiles. Given tw o expres sion profiles X i and X j , the total probability mass o f sa mples whose k -th feature is bounded betw ee n the express io n v alues X ik and X j k is calcula ted as MASS k ( X i , X j ) = X min ( X ik ,X jk ) ≤ x ≤ max ( X ik ,X jk ) f re q ( x ) , (18) with f r eq ( x ) is the empirical frequency . The mass distance MD ij is defined as the total volume of profiles b ounded b etw een the tw o express io n profiles X i and X j and is estimated by the pro duct ov er all co ordinates k MD ij = n Y k MASS k ( X i , X j ) , (19) with n is the le ng th of the expres s ion profiles. Since the MD ij is symmetric and p ositiv e we int erpret it dir ectly as an interaction w e ig h t w ij . 2.1.13 MR (m utual rank) b y O ba yashi and K inoshita (20 09 ) employs r ank ed Pearso n’s correla tion as a mea- sure to describ e gene co expression. F or a gene i , first Pearson’s co rrelation with all other genes 7 k is computed and ranked. Then the rank achieved for gene j is taken a s s c o re to describ e the similarity of the gene expressio n pr o files X i and X j : rank ij = rank j ( corr ( X i , X k ) , ∀ k 6 = i ) , (20) with corr ( · , · ) b eing Pearson’s correla tion co efficient. The final interaction weigh t w ij is calculated as the geo metric a verage of the ra nk ed corr elation betw een gene i and j and vice versa: w ij = rank ij · r ank j i 2 . (21) 2.1.14 MINE is a class of Max ima l Infor mation-based Nonpar ametric E xploration statistics by Reshef (2 011). The Maximal Informatio n Co efficient (MIC) is part of this c la ss and a nov el measure to q uan tify non-linear r e la tionships. W e computed the MIC for expres sion pr ofiles X i and X j and in terpreted the MIC sco re as an in teraction weigh t w ij = MIC( X i , X j ) . (22) 2.1.15 EUCLID is a simple metho d that employs the euclidean distance b et ween the nor malized expressio n pro files X ′ i and X ′ j of tw o g enes as in ter action w eights w ij = s X k ( X ′ ik − X ′ j k ) 2 , (23) where profiles a r e nor malized by c o mputing the absolute diff erence of expression v alues X ik to the median expre ssion in profile X i X ′ ik = | X ik − median( X i ) | . (24) 2.1.16 Z-SCORE is a netw ork infer ence strateg y by Prill et al. (2010) that ta kes adv a n tag e o f kno ck-out data. It assumes that a k nock-out affects dire ctly interacting genes more str ongly than o thers. The z-s core z ij describ es the effect of a kno ck-out o f g ene i in the k -th e x periment on gene j as the normalized deviation of the expr ession level X j k of gene j for exp eriment k from the av erage expres sion µ ( X j ) of gene j : z ij = | X j k − µ ( X j ) σ ( X j ) | . (25) The origina l Z-SCORE metho ds requires knowledge o f the kno ck-out exp eriment k and is ther efore not directly applicable to data from multi-factorial exp eriment s. The metho d, ho wever, can easily be gene r alized by ass uming that the minimum expressio n v alue within a pro file indicates the kno c k -out experiment (min( X j ) = X j k ). Equa tion 25 then b ecomes w ij = | min( X j ) − µ ( X j ) σ ( X j ) | , (26) and the method ca n b e applied to kno c k- out, kno ck-do wn and m ulti-factoria l data. Note that z ij is an asymmetric score and w e therefore take the maximum of z ij and z j i to compute the final int eraction weight w ij as w ij = max ( z ij , z j i ) . (27) 8 2.2 Sup ervised A great v a riet y o f different supervised machine learning metho ds ha s b een dev elop ed. W e limit our ev aluation to Supp ort V ector Machines (SVMs) becaus e they hav e b een successfully applied to the infer e nce of gene regulato r y net works (Mordelet and V er t, 2008) and can easily b e trained in a semi-sup ervised setting (Cerulo et al. , 2010). W e used the SVM implemen tation SVMLigh t by J oach ims (1999) for all ev a luations. SVMs ar e trained by maximizing a cons trained, quadra tic optimization pr oblem ov e r La grange m ultipliers α : max α L ( α ) = N X i =1 α i − 1 2 N X i,j =1 α i α j y i y j x i T x j sub ject to ( P N i =1 α i y i = 0 0 ≤ α i ≤ C for ∀ i. (28) The lab els y i determine the cla s s to which feature vector x i belo ngs and C is the so -called c omplexity para meter that needs to b e tuned for optimal prediction p erformance. Once the optimal Lagra ng e multipliers α are found, a feature vector can b e classified by its signed distance d ( x ) to the decision b oundary , whic h is computed a s d ( x ) = N X i =1 α i y i x i T x + b. (29) The distance d ( x ) ca n be interpreted as a confidence v alue. The la r ger the absolute distanc e , the more co nfiden t the prediction, and simila r to a correlation v alue w e in terpret the distance as an int eraction weight. In contrast to unsup ervised metho ds, e.g. corr e lation methods, the sup ervised a pproach do es not directly op e rate on pairs of expression profiles but on feature v ector s that can b e constructed in v arious wa ys . W e computed the outer pro duct of t wo g ene expr ession pr ofiles X i and X j to construct feature vectors: x = X i X T j . (30) The o uter pro duct w a s chosen b ecause it is comm uta tiv e, and pre dicted interactions a re therefore symmetric and undirected. A sample set for the training of the SVM is then compo sed o f feature vectors x i that are labeled y i = +1 for gene pairs that in teract and y i = − 1 for those that do not int eract. If all gene pairs ar e lab eled, all net work in ter actions w o uld b e known and prediction would b e unnecessary . In practice a nd for ev aluation pur poses training is ther efore p erformed on a set of lab eled samples, a nd predictions are g e nerated for the s a mples of a test set. Figur e 1 depicts the concept. All samples within the tra ining set are labeled and all r emaining g ene pairs serve as test samples. Note that the term “sample” in the co n text of super vised lear ning refers to a feature vector derived from a pair of genes and their expression profiles, whereas a sa mple in an expression data set refer s to the gene expr ession v a lues for a single exp eriment, e.g. a gene kno ck-out. W e ev aluate the prediction accura cy of the sup ervised method by genera ting lab eled featur e vectors for all gene pairs (samples) of a netw or k. This en tire sa mple set is then divided in to five parts. Ea c h of the par ts is use d as a test set and the remaining four parts serve as a training set. The to tal prediction ac curacy is av erag e d ov er the prediction accur acies achiev ed during the five iterations (five-fold cross-v a lidation). 2.3 Semi-supervised Data describing regulator y netw o rks a re sparse and typically only a small fra ction of the true int eractions is known. The situation is even worse for nega tiv e data (non-int eractions ), since 9 Figure 1: Extractio n of sa mples for the training and test set from a gene interaction net work. exp erimen tal v alidation la rgely aims to detect but no t exclude interactions. The cas e that all samples within a tra ining data set ca n be lab eled a s po sitiv e or neg ativ e is therefor e rarely given for practica l netw o rk inference problems and sup ervised metho ds ar e limited to very small training data sets, which negatively affects their per formance. Semi-sup ervised metho ds strive to take a dv a n tag e o f the unlab eled samples within a training set by tak ing the distribution of unla beled samples into account, and c a n even b e trained on p ositively lab eled data only . Figure 2 shows the req uired lab eling of data for the different appr oac hes. Super vised metho ds req uir e all samples within the tra ining set to b e la beled, while unsup ervised metho ds require no lab eling a t a ll. Semi-sup ervised approa c hes can b e distinguished into metho ds that need p ositive and negative samples and methods that op erate on p ositive samples only . Figure 2: Original lab eling of s a mples for sup ervised, unsup ervised, semi-sup ervised and p ositiv es- only prediction methods. All the six samples within a sample set a re generated by a four-no de net work with three interactions. The semi-sup ervised method used in this ev aluation is based on the sup ervised SVM approach describ ed above. The only difference is in the lab eling of the tr aining set. In the semi-sup ervised setting o nly a p ortion o f the tr aining samples is lab eled. T o enable the SVM training , whic h 10 requires all samples to be lab eled, all unlab eled samples within the semi-supe rvised training data are relab e led as nega tiv es (Cerulo et al. , 2010). This a pproach enables a direct compar ison of the same prediction alg orithm trained with fully or partially lab eled data. W e assig ned different p ercentages (10 %...,1 00%) of tr ue p ositive and negative or p ositive- only lab els to the training set. The predictio n p erformance o f the different approaches was then ev aluated by five-fold cross-v alidation, with equal training/ test se t sizes for the sup ervised, semi- sup e rvised, po s itiv es- only and unsuper vised methods compared. 3 Results In the follo wing w e fir st ev aluate the prediction accuracy o f unsup ervised methods before compar- ing tw o selected unsup ervised metho ds with sup ervised and semi-sup ervised appro ac hes. 3.1 Unsuper vised metho ds Figure 3 shows the prediction accur acies measur ed by AUC for all unsup ervised metho ds for three different ex perimental t y pes (kno ck-out, kno c k- do w n and mu lti-factoria l) and the a verage A UC (all) o ver the three t yp es. Netw orks with 10, 3 0, 50 , 70 , 9 0 and 110 node s were ex tracted from E. c oli and S. c er evisiae and expres sion data were simulated with GenNetW eaver, with the num b er of samples (exp eriment s) equal to the no des of the netw o rk. Every ev aluation was r epeated 10 times, so ea c h bar therefor e represents an AUC averaged o ver 60 netw ork s o r 180 net works (all). Most obvious are the large standar d deviations in prediction acc ur acy across all metho ds and exp erimen tal types. F or small netw orks the accuracy of a metho d can ea sily v ary b etw een no better than g uessing to close to perfect (see Supplementary Materia l). While most differences betw een metho ds are statistically significant (p-v a lues < 0.01 for Wilco xon rank sum test with Bo nferroni correctio n), differences are larg ely small and the ranking for most methods is therefo r e no t stable and dep ends on the experimental data type , the source netw ork, the s ub-net work s iz e and other factors (see Supplementary Material). How ever, a simple P earso n’s correla tio n is consistently the second-b est per former for all exp erimental t yp es. Int erestingly , rank-bas e d correla tion metho ds (SP EARMAN, K END ALL) that are very similar to Pearso n correla tion p erform very p oo r ly on kno ck-out and kno ck-do wn data but w ell for multi- factorial exp erimen ts. With the exception o f the Z-SCORE metho d prediction, accur acies a re v ery low in general. Z-SCORE w as sp ecifically desig ned for kno c k-out data and indeed clearly outp erforms all o ther metho ds for this exp erimental type, despite its simplicity . It is the only unsup ervised metho d that achiev es a go o d prediction accura c y (AUC = 0.9 ). 3.2 Net w ork size Figure 3 s ummarizes results averaged ov er netw ork s. W e also examined how the netw or k size impacts the pr ediction per formance of the v a rious metho ds. The heat map in Figure 4 is based o n the sa me da ta as Fig ure 3, but s ho ws the pr ediction accuracies (AUC) of the inference metho ds on m ulti-factor ia l data for netw orks with different num b ers of no des (see Supplementary Ma terial for the rela ted figures on kno c k-out and kno ck-do wn data). The rows in Figure 4 a re ordered accor ding to mea n AUC and the r a nking is therefore identical to that in the m ulti-factorial ba r graph in Figure 3. T op p erformers on average are the correlation metho ds by Pearso n, Sp earman and Kenda ll, with the corrected Spea rman metho d (SPEARMAN- C) achieving the hig hest mean AUC. Howev er, when fo cusing on net works of sp ecific size, the b est per formance is achiev ed by the EUCLID metho d for small net works with 10 no des. Other metho ds also show different behaviors with resp e c t to netw ork size. Correlation methods clea rly achieve higher AUCs for large netw or ks. Similar trends can b e observed for MR, MINE, GENIE , MRNET, MRNET-B a nd CLR. In contrast, SIGMOID, PCIT and MD decrease in pr e dic tio n accuracy for 11 M I NE M D K E ND A L L S PE A R M A N M R NE T PC I T M R NE T - B C L R S PE A R M A N- C A R A C NE S I G M O I D R N G E NI E E UC L I D M R PE A R S O N Z - S C O R E 0 . 5 0 . 6 0 . 7 0 . 8 0 . 9 1 . 0 a l l M I NE S PE A R M A N K E ND A L L S PE A R M A N- C M D M R NE T M R NE T - B PC I T C L R A R A C NE R N S I G M O I D E UC L I D G E NI E M R PE A R S O N Z - S C O R E k n o c k - o u t M D PC I T G E NI E S I G M O I D M R NE T C L R M R NE T - B M I NE A R A C NE R N E UC L I D Z - S C O R E M R K E ND A L L S PE A R M A N PE A R S O N S PE A R M A N- C 0 . 5 0 . 6 0 . 7 0 . 8 0 . 9 1 . 0 m u l t i - fa c t o r i a l M I NE K E ND A L L S PE A R M A N M R NE T C L R M R NE T - B S PE A R M A N- C A R A C NE PC I T R N M D M R G E NI E S I G M O I D E UC L I D PE A R S O N Z - S C O R E k n o c k - d o w n Figure 3: Prediction accuracy (AUC) of unsup ervised metho ds on multi-factorial, kno ck-out, kno c k -do wn and av er aged (all) data generated by GenNetW eav er. 10 rep eats ov er netw orks with 10,...,110 no des, extracted fro m E. c oli and S. c er evisiae . E r ror bars show standard deviation. growing net work sizes, while the per formance of RN and ARA CNE is s eemingly unaffected by net work size within the inv estigated size range . 3.3 Sample num b er Apart from the size of the netw o rk, w e also exp ected the num b er of samples to have a n effect on the prediction accura cy of the inference algor ithms. GenNetW eav e r genera tes gene expres sion pro- files with the same num b er of sa mples as net work nodes (g enes). W e therefore used SynTReN to v ary net works size and sample num b er indep endent ly . The heat ma p in Figure 5 sho ws prediction accuracy (AUC) a veraged over a ll inference metho ds for different net work sizes and sa mple n um- ber s. SynTReN simulates expres sion data for multi-factorial exp erimen ts o nly , and net works were extracted from E. c oli . All exp e rimen ts were r epeated 10 times. The results show the exp ected trend of improving accuracy with increa sing n um b er of samples and decr easing size of netw or k. How ever, the absolute improv ements in prediction accuracy are r ather small with additional data, most likely b ecause unsuper vised methods can infer only simple net work top ologies reliably and small sample sets a re sufficien t fo r this purp ose. F or instance, net works with 50 nodes a re predicted with an A UC of roughly 0.65, when 50 samples are av ailable. Increa s ing the sample set 12 1 0 3 0 5 0 7 0 9 0 1 1 0 NO DE S M D PC I T G E NI E S I G M O I D M R NE T C L R M R NE T - B M I NE AR A C NE R N E U C L I D Z - S C O R E M R K E ND AL L S PE A R M AN PE A R S O N S PE A R M AN- C 0 . 5 5 0 0 . 5 7 5 0 . 6 0 0 0 . 6 2 5 0 . 6 5 0 0 . 6 7 5 0 . 7 0 0 0 . 7 2 5 Figure 4: Prediction a c curacy (AUC) of unsuper vised metho ds on mu lti-factoria l data for different net work sizes. Data gener ated by GenNetW eaver and extracted fro m E. c oli and S. c er evisiae . size to 1 1 0 raises the prediction accura cy o nly to an AU C of around 0.67. 3.4 Sup ervised metho ds Finally , we w anted to compare unsup ervised with sup ervised and semi-sup ervised approaches. Because of the time-consuming training required for s upervised metho ds we limited our ev aluation to netw ork s with 3 0 nodes extra c ted from E. c oli netw orks. Expre ssion pro files w e r e g enerated with GenNetW eav er, and each exper imen t was r epeated 10 times. Figure 6 s ho ws the prediction acc uracies (AUC) fo r sup e rvised a nd semi-sup ervised metho ds for three different exp erimental types (kno ck-out, kno ck-do wn and multi-factorial) and the aver- age AUC (all) data. F o r direct comparison, we included tw o unsupervised methods (Z-SCORE , SPEARMAN) in our ev alua tion of supe r vised metho ds. Sup ervised and semi-supervis ed metho ds are lab eled “SVM” follo wed by the p ercentage o f la beled da ta (10%, 30%, 50 %, 7 0%, 90%, 10 0%). The suffix “+” indica tes that only p ositive da ta were used and “ ± ” indicates that po s tiv e and neg- ative data w ere use d. F or instance, “SVM-70 ± ” describ es an SVM tr ained on 70 % of la beled data (po sitiv e a nd negative). All ev alua tions are five-fold cross- v a lidated a nd the complex ity parameter C of the SVM was optimized via grid sear c h (0 . 1 . . . 100) for each tra ining fold. The results sho w go od prediction accurac ies for supervis ed metho ds o n all exp erimen tal types, with a slight adv a n tag e for kno c k-out data. As exp ected, p erformance incr eases with the p er- centage of da ta la beled but there is little difference b et ween lab eling only p ositive data , o r bo th po sitiv e a nd negativ e data. Apparently , super vised methods can b e trained effectively even when only a p ortion of netw ork int eractio ns (po sitiv es ) is known. Even with as little as 10% of known interactions, semi-sup ervised metho ds still outp erform unsupe r vised methods for multi-factorial data. The Z- SCORE method is still the top-p erforming metho d on kno ck-out data, but sup ervised metho ds a re not far b ehind a nd consider ably outp er- form Sp earman’s correlation. F or kno ck-down data the Z-SCORE metho d loses its top rank, and 13 1 0 3 0 5 0 7 0 9 0 1 1 0 S A M PL E S 1 0 3 0 5 0 7 0 9 0 1 1 0 NO DE S 0 . 5 8 0 . 6 0 0 . 6 2 0 . 6 4 0 . 6 6 0 . 6 8 0 . 7 0 Figure 5: P rediction accurac y (AUC) av er aged ov er all unsupe rvised metho ds on mult i-factoria l for different net work sizes (no des) and sa mple n umbers. Data generated by SynTReN and extr acted from E. c oli . 10 rep eats. semi-sup ervised metho ds perfor m better when at lea st 70% of the data a re labeled. T o summarize, a part from the Z-SCORE metho d on kno c k -out data, sup ervised a nd se mi- sup e rvised approa ches cons iderably o utperform unsuper vised metho ds and achieve go o d predictio n accuracies in g eneral for net works of this size. 4 Discussion 4.1 Sim ulated data While simulators such as GenNetW eav er gener ate expr ession da ta that are in g oo d agr e e men t with biological measurements (Marbach et al. , 201 0 ) they r emain inco mplete mo dels, e.g . p ost- transcriptiona l r egulation a nd chromatin states are missing, and a n ev a luation of infer ence metho ds on real data would clear ly b e preferable. How ever, cur ren tly known netw ork structures, even for well-c har acterized or g anisms, ar e fragmentary and only pa rtially correc t repr esen ta tions of the int eractions b et ween g enes (Stolovitzky et al. , 200 7 ). Consequently , there is an unknown but probably large discrepancy betw een the expression data measured and the obs erv ed pa rt o f the actual netw or k that g enerates them, rendering asse ssmen t of inference metho ds on observed gene regulator y netw or k s and their expression v a lues very difficult. W e therefore have limited our ev aluation to in sili c o b enchmarks, but metho ds that fail for simulated da ta are unlikely to succeed in the inference o f real biologic a l netw orks (Bansal et al. , 2 007). 4.2 Linear SVMs Another limitation of o ur study is the choice o f linea r SVMs for the e v a luation of super vised and semi-sup ervised methods. W e prefer linear SVMs ov er more-p ow erful non-linear metho ds for t wo r easons. Firstly , linear SVMs are considerably faster to train and have fewer pa rameters to optimize than no n-linear SVMs – a sig nifican t adv antage in a compre he ns iv e study . Secondly , ident ifying a co mplex system with man y v a riables (in teractio n w eights) from a small num b er of 14 S PE A R M A N S V M - 1 0 + S V M - 3 0 + S V M - 1 0 ± Z - S C O R E S V M - 5 0 + S V M - 3 0 ± S V M - 7 0 + S V M - 5 0 ± S V M - 9 0 + S V M - 1 0 0 ± S V M - 1 0 0 + S V M - 9 0 ± S V M - 7 0 ± 0 . 5 0 . 6 0 . 7 0 . 8 0 . 9 1 . 0 a l l S PE A R M A N S V M - 1 0 + S V M - 1 0 ± S V M - 3 0 + S V M - 3 0 ± S V M - 5 0 + S V M - 7 0 + S V M - 5 0 ± S V M - 9 0 ± S V M - 1 0 0 ± S V M - 1 0 0 + S V M - 7 0 ± S V M - 9 0 + Z - S C O R E k n o c k - o u t Z - S C O R E S PE A R M A N S V M - 1 0 + S V M - 3 0 + S V M - 1 0 ± S V M - 5 0 + S V M - 3 0 ± S V M - 7 0 + S V M - 9 0 + S V M - 1 0 0 ± S V M - 1 0 0 + S V M - 5 0 ± S V M - 9 0 ± S V M - 7 0 ± 0 . 5 0 . 6 0 . 7 0 . 8 0 . 9 1 . 0 m u l t i - fa c t o r i a l S PE A R M A N S V M - 1 0 + S V M - 3 0 + S V M - 5 0 + S V M - 1 0 ± Z - S C O R E S V M - 7 0 + S V M - 5 0 ± S V M - 3 0 ± S V M - 9 0 + S V M - 7 0 ± S V M - 9 0 ± S V M - 1 0 0 ± S V M - 1 0 0 + k n o c k - d o w n Figure 6 : Predictio n a ccuracy (A UC) o f super vised metho ds on m ulti-fa c torial, kno ck-out, kno c k- down and a veraged (all) data g e ne r ated by GenNetW eaver. five-fold cross -v a lidation and 10 re- pea ts ov er netw orks with 3 0 nodes, extrac ted from E. c oli . E rror bars show standard deviation. samples calls for a simple predictor. W e also tried to ev a luate tra nsductiv e SVMs (Joachims, 2 009) but found them very time-consuming to train, and they a c hieved accuracies considera bly lo wer than the semi-super v ised SVMs (data not s ho w n). W e therefore did not p erform a full ev aluatio n and do not r e port res ults for transductive SVM s. 4.3 F ea ture v ectors W e constr uc t feature vectors by co mputing the outer pro duct of the expressio n profiles of tw o genes. Cerulo et al. (2010) constructed feature v ecto rs by conc a tenating the tw o express ion pro- files. The outer pro duct res ults in larger feature vectors ( N 2 vs. 2 N ) but is independent of the order of the gene pair . The tr aining set is therefor e half the size compar ed w ith the concate- nation approa c h ( n ( n − 1 )) and we ac hieved higher prediction accuracies with the linear SVM. Cerulo et al. (20 10) , ho wever, used no n- linear SVMs (RBF) that migh t achieve the s ame or b et- ter acc ur acies on concatenated feature vectors but are more time-co nsuming to train a nd require t wo para meter ( C , γ ) to b e optimized. It therefore remains an op en question, whic h metho d is preferable. SIRENE by Mordelet a nd V ert (200 8) ta k es a different a pproach, with SVMs trained on feature vectors derived from single pr ofiles. How ever, it r equires knowledge ab out the transcriptio n factors 15 amongst the genes, and ca nnot predict interactions b et ween target genes. Since each transcr iption factor is a ssigned a separate SVM, feature vectors ar e of leng th N and the tr aining set has only n samples, the individual SVMs ca n b e trained very efficien tly , but tra ining tim e is multiplied b y the num b er of trans cription factors. 4.4 Un balanced data sets Gene regulatory netw orks tend to be spar se, with the n umber of positive s amples (interactions) t ypically muc h sma lle r than the n umber o f negative samples (non-interactions). Consequently data sets fo r the training o f superv ised methods are heavily un balanced, and this co uld hav e a negative impa ct on the predic tio n accuracy of the classifier. W e therefore tried to w eight p ositive and negative sa mples inv er sely to their ratio, but did not observ e any impr o vements in prediction accuracy (data not sho wn). All ev alua tions in this pap er were there fore p erformed with equally weigh ted ( w = 1) samples. 4.5 Net w ork inference The ev aluation res ults r ev eal large v ariations in prediction a c c uracies a cross all methods. Non- linear metho ds such as MINE do not p erform b etter than linea r Pearson’s correla tion and in general, we find that complex methods a re no more accura te than simple metho ds. T he Z - SCORE metho d and Pearson correlation are the tw o be s t-perfor ming unsupervis e d metho ds. A detailed ana lysis revealed that unsup ervised approaches work well for simple netw ork top olo- gies (e.g . star top ology ) and netw or ks with exclusively activ a ting o r inhibiting in teractions , but fail for more-complex cas e s (see Supplemenary Ma terial). Mixed r egulatory interactions cons titute a fundamental problem for unsup ervised netw ork inference as depicted in Figure 7. Figure 7 : Gene A inhibits gene D and gene B a ctiv a tes gene D. T he resulting ex pression profile of gene D is, how ever, most similar to tha t o f gene C, which do es not regulate g e ne D. Let gene A inhibit g ene D but let gene B activ a te the same gene D. Given the expr e ssion profiles of genes A and B as sho wn in Figure 7, and assuming identical in tera ction weights but with oppo site s igns, the pr ofile for g ene D, res ulting fro m a linea r com binatio n, is most similar to that of gene C and very different from A or B. Consequently , the mo s t-appropriate but er roneous conclusion is to infer a r e gulatory r elationship b etw een C and D. Without an y further infor mation (e.g. kno ck-outs, existing interactions) any method that infer s interactions from the simila r it y o f expression pr ofiles a lone is prone to fail in this common case. Schaffter et al. (2011) iden tify o ther common net work motifs and the methods that tend to infer them inco rrectly , a nd Kr ishnan et al. (2007) show tha t net works o f a cer tain complexity cannot b e reverse-engineer e d from ex pression data alone. 16 5 Conclusion Perhaps the most-imp ortant observ atio n from this ev a luation is the large v a riance in prediction accuracies across all methods. In agreement w ith Haynes and Brent (2 009) we find that a lar ge nu mber o f replicates on net works of v a r ying size is required for r eliable estimates o f the prediction accuracy of a method. Ev aluations o n sing le data sets – e specially o n real da ta – are unsuitable to establish differe nces in the prediction acc ur acy of inference metho ds. On average, unsuper vised metho ds achieve very low prediction accuracies, with the notable exception of the Z-SCORE metho d, a nd a re conside r ably outp erformed by sup ervised a nd semi- sup e rvised methods. Simple corr elation metho ds suc h as Pearson correla tion a re as accur ate as m uch mo r e-complex metho ds, yet muc h faster and para meterless. Unsup ervised methods ar e appropria te for the inference only o f simple netw o rks that are entirely comp osed o f inhibitory or activ ating interactions but not b oth. The Z- SCORE metho d achiev ed the bes t prediction accuracy of a ll methods on k no ck-out data, but has obvious limitations. F o r instance, the metho d fails when a gene is regula ted b y an o r- junction of tw o other genes . How ever, the metho d could ea s ily be g eneralized to multi-knock-out exp erimen ts. On multi-factorial da ta the sup ervised and semi-s upervised metho ds achieved the highest ac- curacies; even with as few a s 10% of kno wn in teractions, the semi-sup ervised metho ds still out- per formed all uns upervised approaches. There was little difference in prediction accuracy for semi-sup ervised metho ds trained on positively lab e led da ta only , compared to training on p ositive and nega tive samples. Apparently semi-sup ervised metho ds can effectively b e trained o n par tial int eraction da ta and non-interaction data are not es sen tia l. These re s ults hav e impo rtan t implica tions for the a pplication of netw o r k inference metho ds in systems biology . Even the b est metho ds are accura te o nly for sma ll netw o r ks of relatively simple top ology , whic h mea ns that larg e-scale or genome-scale regulato ry netw o rk inference from expression data alone is curr en tly not feasible. If inf erence methods ar e to b e applied to data of the scale ge ner ated by mo dern microar ra y platforms, a fea tur e selection step is usually r equired to reduce the size of the inference problem; attempts to a pply netw or k inference to such la rge-scale datasets ma y be premature, and consideration should be given to focus ing the biolog ical question to use smalle r -scale, higher-quality exp erimental data. Our analy sis a lso indicates that certain kinds of biolo gical data are more amenable for accur ate net work inference than others . Most microarray datasets are mo st similar to our m ulti-factor ial simulations, whic h yielde d p oo rly inferred ne tw orks with unsuper vised methods. Increasing the nu mber of samples in the exp eriment (a co mmon strateg y to improv e inference) do es no t in fact generate the hop ed-for improvemen ts. Mor e useful ar e k nock-out data, which o ur simulations show contain more-useful infor mation, and supp ort hig her-quality inference. Bio logists who wish to gain insight into r e gulatory a rc hitecture should consider these limitations when designing exp erimen ts. T o summarize, small netw or ks (as ev a luated here) can be inferred with hig h a c curacy (AUC ≈ 0.9) even with sma ll num b ers of samples us ing sup ervised techniques o r the Z-SCORE metho d. How ever, even with the b est-p erforming metho ds larg e v ariations in prediction accur acy remain, and predictions may be limited to undirected netw orks without self-interactions. F unding W e acknowledge funding fr om the Australian Res e a rc h Council DP11010 3384 and CE 0348221 . References G. Altay and F. Emmert-Streib. Revealing differences in gene net work inference algorithms on the netw or k le vel by ensem ble metho ds. Bioinformatics , 2 6:1738–1 744, 20 10. 17 P . Ba ldi et al. Asse ssing the a ccuracy of prediction algor ithms for classifica tion: an overview. Bioinfo rmatics , 1 6:412–42 4, 2 0 00. M. Ba nsal et al. Ho w to infer gene net works from expression profiles. Mol Syst Biol , 122:78, 20 07. A. J. Butte and I. S. Kohane. Mutual information relev ance net works: functional genomic clus- tering using pair wise en tr op y measur emen ts. Pac Symp Bio c omput , 1:418–4 29, 200 0. D. Camacho et al. C o mparison of rev erse-enginee ring metho ds using an in silico netw o rk. Ann N Y A c ad Sci , 1115 :7 3–89, 2 007. I. Cantone et a l. A yeast synthetic netw ork for in vivo assess ment of reverse-engineering and mo deling approaches. Cel l , 137 :172–181 , 200 9. L. Cerulo et al. Learning gene re g ulatory netw or k s fro m only p ositive and unlab eled data. BMC Bioinfo rmatics , 1 1:228, 2010. L. E lnitski et al. Lo cating mammalian transcr iption factor binding sites : A survey of computa- tional and ex perimental tec hniques. Genome Rese ar ch , 16:14 55–1464 , 2006 . J. J. F aith et al. Large- scale mapping and v alida tion of esc herichia coli tra nscriptional regulation from a comp endium of expr ession profiles. PL oS Biol , 5 :e8, 2007. B. C. Haynes and M. R. Brent. Benchmarking re g ulatory netw o rk reconstructio n with GRENDEL. Bioinfo rmatics , 2 5:801–80 7, 2 0 09. D. Husmeier. Sensitivity and spe cificit y of inferr ing genetic regula tory interactions from micr oarray exp erimen ts with dynamic B a yesian net works. Bioinformatics , 19:227 1–2282, 200 3 . V. A. Huynh-Thu et al. Inferring regulator y netw ork s from expressio n data using tre e -based metho ds. PL oS ONE , 5 :e 12776, 2010. T. J oac hims. Making lar ge-scale s vm learning practical. In B Sc h¨ olkopf, C. Burges, and A Smola , editors, A dvanc es in Kernel M etho ds - Supp ort V e ctor L e arning , pages 169–1 84. MIT Press, Cambridge, MA, 1999. T. Joachims. Retrosp ective on tra nsductiv e inference for text class ification using supp ort vec- tor machines. In Pr o c e e dings of the In ternational Confer enc e on Machine L e arning (ICML) , Montreal, Quebec, 2 009. A. Krishnan et al. Indeterminacy of reverse engineering of gene regulatory net works: the curse of gene elasticity . PL oS ON E , 2:e562, 2007 . P . Lang felder a nd S. Horv ath. WGCNA: an R pack age for weigh ted co rrelation net work analysis. BMC Bioinformatics , 9:559, 2008. F. M. Lop es et al. Comparative study of GRNS inference metho ds ba sed o n fea ture s election by mutual information. In IEEE International Workshop on Genomic Signal Pr o c essing and Statistics , Guada la jar a, JA, Mexico, 20 0 9. P . B . Ma dha mshettiw ar et al. Gene regulatory netw ork inference: ev aluation a nd a pplica tion to ov ar ian cancer allo ws the prior itization of drug targets. Genome Me d , 4:41 , 2 012. D. Marbach et al. Gener ating r ealistic in silic o gene net works for p erformanc e assessment of reverse engineering methods. J Computat Biol , 16:2 29–239, 2 009. D. Marbach et al. Revealing str engths and w eaknesse s of metho ds for gene net work inference. Pr o c Natl A c ad Sci USA , 10 7:6286–6 2915, 201 0. D. Marbach et a l. Wisdom of cr o wds for ro bust gene netw or k inference. Natu r e Metho ds , 9: 796–8 04, 201 2 . 18 A. A. Mar golin et al. ARACNE: an algo rithm for the reco ns truction of gene regulatory netw or k s in a mammalia n cellular cont ext. BMC Bioinformatics , 7:(Suppl 1 ), S7, 2006. P . E. Me yer et al. Information- theo retic inference o f large tr anscriptional regula tory net works. EURASIP J Bioinform Syst Biol , 1:798 79, 20 07. P . E. Meyer et al. A R/Bio conductor pa c k a g e for inferring large transcriptional net works using m utual infor ma tion. BMC Bio informatics , 9 :461, 2008. P . E. Meyer et al. minet : Information-theore tic inference of gene netw orks using ba c kward elim- ination. In The 2010 International C onfer enc e on Bio informatics and Computational Biol o gy , 2010. F. Mo rdelet and J. P . V er t. Sir ene: supe rvised inference of reg ula tory net works. Bioinformatics , 24:i76– i82, 2 008. T. Obayashi and K . Kinoshita. Rank of co rrelation co efficient a s a comparable measur e for bio- logical significance o f gene expression. DNA Rese ar ch , 16:24 9–260, 20 0 9. D. Pe’er and N. Hacohen. Principle s and strategies fo r developing netw ork mo dels in ca ncer. Cel l , 144:86 4–873, 20 1 1. R. J. Prill et al. T ow ar ds a rig orous as sessmen t of systems biology mo dels: the DREAM3 chal- lenges. PL oS ONE , 5:e9202 , 201 0. D. N. Reshef. Detecting nov el asso ciations in large data sets. Scienc e , 334:1 5 18–1524 , 2011. A. Reverter and E. K. Cha n. Combining partial cor r elation and an information theory approach to the reversed eng ineering of gene co -expression netw o rks. Bioinformatics , 24:2491 –2497, 2 008. T. Schaffter et al . GeneNetW eav er: In silic o b e nc hmar k generation and p erformance pr ofiling of net work inference metho ds. Bioinformatics , 27:2 263–227 0, 20 11. G. Stolovitzky et al. Dialogue on reverse-engineering as sessmen t a nd metho ds: the DREAM of high-throughput pathw ay inference . Ann N Y A c ad Sci , 11 1 5:1–22, 2007. G. Stolo vitzky et al. Le s sons from the DREAM2 ch allenges. Ann N Y A c ad Sci , 1158:1 59–195, 2009. T. V an den Bulcke et al. SynTReN: a genera tor of synthet ic ge ne e x pression data for design and analysis of str ucture learning algorithms. BMC Bi oinformatics , 7 :4 3, 2006. A. V. W erhli et al. Comparative ev alua tion of reverse engineering gene r egulatory net works with relev ance netw ork s, gr aphical gaus s ian mo dels a nd bay esian net works. Bioinformatics , 22:2523– 2531, 200 6. G. Y o na et al. Effective simila rit y measures for expression profiles. Bio informatics , 22 :1616–16 2 2, 2006. 19 Supplementary material Sup ervised, semi-sup ervis ed and unsup ervi sed inference of gene regulatory net w ork s Stefan R. Maetsc hk e, Piyush B. Madhamshettiw ar, Melissa J. Da vis and Mark A. Ragan No vem b er 27, 2024 1 1 Unsup ervised This sections contains additional data of unsup ervised metho ds for differen t pe r formance metrics and exp erimen tal data types . 1.1 Metho ds The following three figures show the prediction per formance of unsup e r vised metho ds for three different p erformanc e mea sures s uc h as the Area Under the ROC cur ve (A UC), Matthew’s Cor- relation Coefficient (MCC) and the F1-score. The threshold for the MCC and F1 scor e metr ics were optimized. The AU C do es not have a threshold that requires optimizatio n. All metho ds were ev aluated on m ulti-factorial, kno c k -out, kno c k -do wn and av erag e d (a ll) data generated by GenNetW eav er. Each ev aluation was r epeated 10 times ov er netw orks with 10,...,11 0 no des, extracted from E. c oli and S. c er evisiae netw orks . M I NE M D K E ND AL L S PE A R M AN M R NE T PC I T M R NE T - B C L R S PE A R M AN- C AR A C NE S I G M O I D R N G E NI E E U C L I D M R PE A R S O N Z - S C O R E 0 . 5 0 . 6 0 . 7 0 . 8 0 . 9 1 . 0 a l l M I NE S PE A R M AN K E ND AL L S PE A R M AN- C M D M R NE T M R NE T - B PC I T C L R AR A C NE R N S I G M O I D E U C L I D G E NI E M R PE A R S O N Z - S C O R E k n o c k - o u t M D PC I T G E NI E S I G M O I D M R NE T C L R M R NE T - B M I NE A R A C NE R N E UC L I D Z - S C O R E M R K E ND A L L S PE A R M A N PE A R S O N S PE AR M A N- C 0 . 5 0 . 6 0 . 7 0 . 8 0 . 9 1 . 0 m u l t i - fa c t o r i a l M I NE K E ND A L L S PE A R M A N M R NE T C L R M R NE T - B S PE AR M A N- C A R A C NE PC I T R N M D M R G E NI E S I G M O I D E UC L I D PE A R S O N Z - S C O R E k n o c k - d o w n Figure 1: Prediction accura cy (A UC) of unsup ervised metho ds for different ex perimental data t yp es. Err or ba r s show standar d deviation. 2 While ther e are slight differe nces in the ra nking of the metho ds depending on the chosen per formance metric no drama tic shifts ca n be observed. Z-SCORE and PEARSON remain the bes t per fo rming methods in all cases and the Z-SCORE metho d domina tes all other metho ds for kno c k -out data. M D S I G M O I D M I NE M R NE T K E ND AL L S PE A R M AN S PE A R M AN- C M R NE T - B C L R PC I T AR A C NE R N E U C L I D M R G E NI E PE A R S O N Z - S C O R E 0 . 0 0 . 2 0 . 4 0 . 6 0 . 8 1 . 0 a l l M D M I NE K E ND AL L S PE A R M AN- C S I G M O I D S PE A R M AN M R NE T E U C L I D M R NE T - B C L R R N AR A C NE PC I T G E NI E M R PE A R S O N Z - S C O R E k n o c k - o u t M D S I G M O I D M R NE T PC I T C L R M R NE T - B M I NE AR A C NE R N M R Z - S C O R E E U C L I D K E ND AL L G E NI E S PE A R M AN S PE AR M A N- C PE A R S O N 0 . 0 0 . 2 0 . 4 0 . 6 0 . 8 1 . 0 m u l t i - f a c t o r i a l M D M I NE K E ND AL L S I G M O I D M R NE T PC I T M R NE T - B S PE A R M AN S PE AR M A N- C C L R AR A C NE R N M R G E NI E E U C L I D PE A R S O N Z - S C O R E k n o c k - d o w n Figure 2 : P rediction accur a cy (MCC) of unsup ervised metho ds for differe nt exp eriment al data t yp es. Err or ba r s show standar d deviation. 3 PC I T M D S I G M O I D M I NE K E ND AL L S PE A R M AN S PE A R M AN- C E U C L I D M R NE T R N AR A C NE M R NE T - B C L R G E NI E M R PE A R S O N Z - S C O R E 0 . 0 0 . 2 0 . 4 0 . 6 0 . 8 1 . 0 a l l PC I T S I G M O I D M D M I NE S PE A R M AN- C K E ND AL L S PE A R M AN E U C L I D R N M R NE T AR A C NE M R NE T - B C L R G E NI E M R PE A R S O N Z - S C O R E k n o c k - o u t PC I T M D S I G M O I D G E NI E M R NE T R N AR A C NE M R NE T - B C L R M I NE E U C L I D K E ND AL L Z - S C O R E S PE A R M AN M R S PE A R M AN- C PE A R S O N 0 . 0 0 . 2 0 . 4 0 . 6 0 . 8 1 . 0 m u l t i - f a c t o r i a l PC I T S I G M O I D M D M I NE K E ND AL L S PE A R M AN- C S PE A R M AN M R NE T C L R M R NE T - B AR A C NE R N E U C L I D M R G E NI E PE A R S O N Z - S C O R E k n o c k - d o w n Figure 3: Pr ediction accur acy (F1-scor e) o f unsup ervised metho ds for diff erent ex p erimental data t yp es. Err or ba r s show standar d deviation. 4 1.2 Net w ork size This section shows the predictio n p erformance (AUC) o f the unsup e r vised metho ds for netw orks with different no de num b ers and for the three experimental types (m ulti-fa c to rial, kno ck-do wn, kno c k -out). All expression da ta were simulated with GenNetW eav er and s ub-net works were ex- tracted from E. c oli . 1 0 3 0 5 0 7 0 9 0 1 1 0 NO DE S M D PC I T G E NI E S I G M O I D M R NE T C L R M R NE T - B M I NE AR A C NE R N E U C L I D Z - S C O R E M R K E ND AL L S PE A R M AN PE A R S O N S PE A R M AN- C 0 . 5 5 0 0 . 5 7 5 0 . 6 0 0 0 . 6 2 5 0 . 6 5 0 0 . 6 7 5 0 . 7 0 0 0 . 7 2 5 Figure 4: Prediction a c curacy (AUC) of unsuper vised metho ds on mu lti-factoria l data for different net work sizes. Figure 4 rev ea ls that the b est p erforming unsup ervised metho d o n multi-factorial data is the EUCLID metho d but only on very small netw or ks with 10 to 30 no des. Correlation based metho ds such as PE ARSON, SPEARMAN-C, SPE ARMAN , KENDALL a nd some o ther metho ds show better p erformance on lar ger net works (90 and 11 0 no des) than on smaller netw or ks. 5 1 0 3 0 5 0 7 0 9 0 1 1 0 NO DE S M I NE S PE A R M AN K E ND AL L S PE A R M AN- C M D M R NE T M R NE T - B PC I T C L R AR A C NE R N S I G M O I D E U C L I D G E NI E M R PE A R S O N Z - S C O R E 0 . 5 5 0 . 6 0 0 . 6 5 0 . 7 0 0 . 7 5 0 . 8 0 0 . 8 5 0 . 9 0 Figure 5 : P rediction accur a cy (A UC) of unsuper vised metho ds on kno ck-out data for different net work sizes. On kno c k-out data the most accurate metho d is the Z-SCORE metho d. While the pr ediction accuracy of the Z-SCO RE metho d decreases with netw ork size it still cle a rly outp erforms all other metho ds for net works of all sizes (see Figure 5 ). There is a general tre nd for most metho ds to p erform b etter on the small 10 -node netw or k. Apart from P EARSON, all corr elation based metho ds (SPEARMAN-C, SPE ARMAN, KENDALL, MINE) achiev e very low A UCs on kno ck-out data. 6 1 0 3 0 5 0 7 0 9 0 1 1 0 NO DE S M I NE K E ND AL L S PE A R M AN M R NE T C L R M R NE T - B S PE A R M AN- C AR A C NE PC I T R N M D M R G E NI E S I G M O I D E U C L I D PE A R S O N Z - S C O R E 0 . 5 2 5 0 . 5 5 0 0 . 5 7 5 0 . 6 0 0 0 . 6 2 5 0 . 6 5 0 0 . 6 7 5 0 . 7 0 0 Figure 6: Prediction accura cy (A UC) o f unsup ervised metho ds on kno ck-do wn data for different net work sizes. The r esults on the kno ck-do wn data shown in Figur e 6 are similar to the results on the kno c k- out da ta (see Figure 5). The Z-SCORE metho d rema ins the b est per forming metho d. The larg e ma jor it y o f metho ds p erform b est on the sma ll 10- no de netw o rk – esp ecially the EUCLID metho d, which w a s the b est per former on netw or k s o f this size for multi-factorial data. 7 1.3 Net w ork predictions All ev a lua tion s ho wed la rge v aria tions in the prediction accuracy of the methods. Even for v e ry small net works with only 10 nodes the prediction accuracy ca n v ary from per fect to completely wrong. T o b etter understand the reasons causing the large v a riances we visualiz e d the net works (out of 100) that were predic ted with the highes t and lowest accura c y , using Spea rman’s corr elation as a net work inference method and the A UC as p e r formance metric. Sub-netw orks with 10 nodes were extracted from the E. c oli netw or k and ex pression data w ere sim ula ted with GenNetW e aver. Figure 7: T r ue netw o rk where Sp earman’s c o rrelation failed to recov er the top ology (AU C = 0.508). Green means activ ating , a nd red means inhibiting interactions Figure 7 shows a true ne tw ork where Spe arman’s correlatio n failed to recover the topo logy (A UC = 0 .508). Note that some interactions a re activ ating (green) a nd some interactions are inhibiting (red), which results in a more complex dynamic of the net work than a net work with exclusively activ ating or inhibiting interactions. In c o n tra st, Figur e 8 s ho ws the true netw or k where Sp earman’s corr elation inferr ed the netw or k top ology close to p erfect (AUC = 0.97 1). 8 Figure 8: T rue netw ork where Spear man’s correlation recov ered the topology accur ately (AUC = 0.971). The ne tw ork has only a ctiv a ting (green) interactions. In general, netw or ks with ex clusiv ely activ ating o r inhibiting interactions a nd simple top ologies (e.g. star top ology) c a n b e inferred accurately with unsup ervised metho ds, even on multi-factorial data. How ever, netw o rks with complex top ologies or a mix of a ctiv a ting and inhibiting interactions t ypically canno t be re c overed relia bly from m ulti- fa ctorial data. 9 2 Sup ervised This section co mpares sup e rvised, semi-sup ervised and unsup ervised metho ds, using three differ- ent p erformance metr ic s such a s the Area Under the ROC curve (A UC), Matthew’s Correla tion Co efficien t (MCC) and the F1 -score. All metho ds were ev aluated on m ulti-factorial, kno c k -out, kno c k -do wn and av erag e d (a ll) data generated by GenNetW eav e r. 5-fo ld cr oss-v alidation was used a nd each ev aluatio n was rep eated 10 times over netw o rks with 30 no des, extracted from E. c oli . The results show little differe nce in the ranking of the methods for differen t perfor mance met- rics. The Z-SCO RE metho d achieves the highes t accura cies on the kno ck-out data but p erforms worst o n multi-factorial data. SPEARMAN t ypica lly shows the low est prediction accuracy and semi-sup ervised metho ds ar e effectiv ely r ank ed according to the p ercentage of la beled da ta used. No distinction b et ween semi-sup e rvised methods tr ained on pos itives and negatives and metho ds trained on p ositives-only can be obser ved. S PE A R M AN S VM - 1 0 + S VM - 3 0 + S VM - 1 0 ± Z - S C O R E S VM - 5 0 + S VM - 3 0 ± S VM - 7 0 + S VM - 5 0 ± S VM - 9 0 + S VM - 1 0 0 ± S VM - 1 0 0 + S VM - 9 0 ± S VM - 7 0 ± 0 . 5 0 . 6 0 . 7 0 . 8 0 . 9 1 . 0 a l l S PE A R M AN S VM - 1 0 + S VM - 1 0 ± S VM - 3 0 + S VM - 3 0 ± S VM - 5 0 + S VM - 7 0 + S VM - 5 0 ± S VM - 9 0 ± S VM - 1 0 0 ± S VM - 1 0 0 + S VM - 7 0 ± S VM - 9 0 + Z - S C O R E k n o c k - o u t Z - S C O R E S PE A R M A N S V M - 1 0 + S V M - 3 0 + S V M - 1 0 ± S V M - 5 0 + S V M - 3 0 ± S V M - 7 0 + S V M - 9 0 + S V M - 1 0 0 ± S V M - 1 0 0 + S V M - 5 0 ± S V M - 9 0 ± S V M - 7 0 ± 0 . 5 0 . 6 0 . 7 0 . 8 0 . 9 1 . 0 m u l t i - fa c t o r i a l S PE A R M A N S V M - 1 0 + S V M - 3 0 + S V M - 5 0 + S V M - 1 0 ± Z - S C O R E S V M - 7 0 + S V M - 5 0 ± S V M - 3 0 ± S V M - 9 0 + S V M - 7 0 ± S V M - 9 0 ± S V M - 1 0 0 ± S V M - 1 0 0 + k n o c k - d o w n Figure 9 : Predictio n a ccuracy (A UC) o f super vised metho ds on m ulti-fa c torial, kno ck-out, kno c k- down and av era ged (all) data ge ne r ated b y GenNetW eav er . E rror bars show standard deviation. 10 S PE A R M AN S VM - 1 0 + S VM - 1 0 ± S VM - 3 0 + Z - S C O R E S VM - 3 0 ± S VM - 5 0 + S VM - 5 0 ± S VM - 7 0 + S VM - 7 0 ± S VM - 9 0 ± S VM - 9 0 + S VM - 1 0 0 ± S VM - 1 0 0 + 0 . 0 0 . 2 0 . 4 0 . 6 0 . 8 1 . 0 a l l S PE A R M AN S VM - 1 0 ± S VM - 1 0 + S VM - 3 0 + S VM - 3 0 ± S VM - 5 0 + S VM - 7 0 + S VM - 5 0 ± S VM - 7 0 ± S VM - 1 0 0 ± S VM - 1 0 0 + S VM - 9 0 + S VM - 9 0 ± Z - S C O R E k n o c k - o u t Z - S C O R E S PE AR M A N S V M - 1 0 + S V M - 1 0 ± S V M - 3 0 + S V M - 3 0 ± S V M - 5 0 + S V M - 7 0 + S V M - 5 0 ± S V M - 7 0 ± S V M - 9 0 ± S V M - 9 0 + S V M - 1 0 0 ± S V M - 1 0 0 + 0 . 0 0 . 2 0 . 4 0 . 6 0 . 8 1 . 0 m u l t i - f a c t o r i a l S PE AR M A N S V M - 1 0 + S V M - 1 0 ± Z - S C O R E S V M - 3 0 + S V M - 3 0 ± S V M - 5 0 + S V M - 5 0 ± S V M - 7 0 + S V M - 9 0 ± S V M - 7 0 ± S V M - 9 0 + S V M - 1 0 0 ± S V M - 1 0 0 + k n o c k - d o w n Figure 10 : Predictio n ac c ur acy (MCC) o f sup ervised metho ds o n multi-factorial, kno ck-out, kno ck- down and av era ged (all) data ge ne r ated b y GenNetW eav er . E rror bars show standard deviation. 11 S PE A R M AN S VM - 1 0 + S VM - 3 0 + S VM - 1 0 ± S VM - 5 0 + Z - S C O R E S VM - 3 0 ± S VM - 7 0 + S VM - 5 0 ± S VM - 9 0 + S VM - 9 0 ± S VM - 1 0 0 ± S VM - 1 0 0 + S VM - 7 0 ± 0 . 0 0 . 2 0 . 4 0 . 6 0 . 8 1 . 0 a l l S PE A R M AN S VM - 1 0 + S VM - 1 0 ± S VM - 3 0 + S VM - 3 0 ± S VM - 5 0 + S VM - 7 0 + S VM - 5 0 ± S VM - 9 0 ± S VM - 7 0 ± S VM - 9 0 + S VM - 1 0 0 ± S VM - 1 0 0 + Z - S C O R E k n o c k - o u t S PE AR M A N Z - S C O R E S V M - 1 0 + S V M - 3 0 + S V M - 1 0 ± S V M - 7 0 + S V M - 5 0 + S V M - 3 0 ± S V M - 9 0 + S V M - 1 0 0 ± S V M - 1 0 0 + S V M - 5 0 ± S V M - 9 0 ± S V M - 7 0 ± 0 . 0 0 . 2 0 . 4 0 . 6 0 . 8 1 . 0 m u l t i - f a c t o r i a l S PE AR M A N S V M - 1 0 + S V M - 3 0 + S V M - 5 0 + S V M - 1 0 ± Z - S C O R E S V M - 3 0 ± S V M - 7 0 + S V M - 5 0 ± S V M - 7 0 ± S V M - 9 0 + S V M - 9 0 ± S V M - 1 0 0 ± S V M - 1 0 0 + k n o c k - d o w n Figure 1 1: Prediction a ccuracy (F1-scor e) of super vised metho ds on multi-factorial, kno c k-out, kno c k -do wn and av eraged (all) data generated by GenNetW eaver. Error bars show standa rd deviation. 12
Original Paper
Loading high-quality paper...
Comments & Academic Discussion
Loading comments...
Leave a Comment