Markov Chain Order estimation with Conditional Mutual Information
We introduce the Conditional Mutual Information (CMI) for the estimation of the Markov chain order. For a Markov chain of $K$ symbols, we define CMI of order $m$, $I_c(m)$, as the mutual information of two variables in the chain being $m$ time steps …
Authors: Maria Papapetrou, Dimitris Kugiumtzis
Marko v Chain Order estimation with Conditional Mutual Information M. Papapetrou , D. Kugiumtzis Department of Mathemat ical, Physical and Computational Scienc e, F acult y of Engineering , Aristotle Univer sity of Thessaloniki, 54124 Thessaloniki, Greece Abstract W e introdu ce the Conditional Mutual Inform ation (CMI) for the e stimation of the Markov chain o rder . For a Markov chain o f K symbols, we define CMI of order m , I c ( m ), as the mutual information of two variables in th e chain being m time steps apart, condition ing on the intermediate variables o f the chain. W e find approximate analy tic significance limits based on the estimation bias of CMI and develop a r andom ization significance test of I c ( m ), where the rando mized symbol sequences are formed by ran- dom permutation of the compone nts of the original sy mbol sequence. The sign ificance test is app lied for increasing m an d the Markov chain ord er is estimated by the last order for which the null hyp othesis is rejected. W e pr esent the approp riateness o f CMI-testing on Monte Carlo simulations and comp are it to the Akaike and Bay esian informa tion criteria, the maximal fluctuation method (Peres- Shields estimator ) and a likelihood ratio test for increasing orders using φ -divergence. The order criterion o f CMI-testing turns out to be superior for order s l arger than one, b ut its e ff ecti veness for large orders de pends on data availability . In view of the results from th e simulation s, we inter pret the estimated ord ers by the CMI -testing and th e oth er criteria on genes and intergenic re gions of DN A chains. K e ywor ds: order estimation, Markov chains, conditional mutual information (CMI), random ization test, DN A P ACS: 89.70 .Cf, 05.4 5.Tp 1. I ntroduction Let { x t } N t = 1 denote a symbo l sequence gen erated by a Markov chain { X t } , of an un - known order L ≥ 1 in a d iscrete space of K po ssible states A = { a 1 , . . . , a K } . The objective is to estimate L f rom the symbol sequence { x t } N t = 1 for a limited length N . Many criteria for Markov chain order estimation hav e been proposed and eval- uated in terms of their asymptotic p roperties. The Bayesian inform ation criter ion Email addr esses: mariapap@gen.aut h.gr (M. Papape trou), dkugiu@gen.au th.gr (D. Kugi umtzis) Prep rint submitted to Physica A Nove mber 27, 2024 (BIC) w as proposed to render consistency of the po pular A kaike inf ormation crite- rion (AI C) [9, 1 0, 22]. However , BIC was fo und to pe rform worse than AIC fo r small sequence lengths, questioning the value of asymptotic proper ties in practical prob lems [6, 8, 10, 21]. A more recen t and general criterion than AIC and BIC is the e ffi cient de- termination criterion (EDC), opting for a penalty function from a wide range of possible such f unctions [25]. Peres-Shield s p ropo sed in [ 19] the maximal fluctuatio n method , which com pares transition probabilities for word s of increasing lengths, and Dalevi and Dub hashi [7] m odified it for practical settings and , instead of h aving to set a d if- ferent thr eshold for each problem , they estimate the ord er f rom a sharp ch ange in the transition probabilities. They found th at the Peres-Shield s ( PS) estima tor is simpler, faster and more r obust to no ise than other criteria like AIC and BIC [7]. Another method is that of global dep endency lev el (GDL), also called relati ve entr opy , using the f -di vergence to measure the discrepancy between two proba bility distributions [2]. GDL w as foun d consistent and more e ffi cient th an AIC and BIC on relatively small sequences. Finally , the method of Men endez et al [14 – 16] makes likelihood ratio tests for increasing order s using the φ -di vergence me asures [17]. This proced ure w as found more powerful in tested cases than the existing ch i-square and likelihoo d ratio pr oce- dures, and it has also been applied to DN A [16]. Here, we follow a di ff er ent approach and estimate the Markov chain o rder from sequential hypoth esis testing for the significance of the conditional mutual information (CMI) fo r inc reasing orders m , deno ted as I c ( m ). I c ( m ) is the mutual inf ormation of x i and x i + m condition ing on the inter mediate v ariables o f the cha in, x i + 1 , . . . , x i + m − 1 . A significant I c ( m ) ind icates that the or der of the Markov chain is at least m . Thu s the repetition of th e sig nificance test of I c ( m ) for incre asing m allows for the estimation of the Markov c hain order L from the la st ord er m f or which the null hyp othesis of zero CMI is rejected. W e show that the significance bounds f or I c ( m ) formed by means of app ropriate resampling are more accurate than the approx imate analytic bounds we derived based on previous analy tic results on the bias o f entropy [2 0]. W e further compare the CMI testing with other criter ia for ord er selectio n on simulated Markov chains and DN A sequences. The structu re of the paper is as f ollows. In Sectio n 2, CMI is defined and esti- mated on symbol sequences, an an alytic significance limit of CMI is derived, and a random ization significan ce test is prop osed, form ing our method of CMI-testing for the estimation of the Markov ch ain order . Other method s for estimatin g the Markov chain order are briefly presented. In Section 3 , we assess the e ffi ciency o f the proposed CMI-testing and com pare it to other or der selection criteria on simulatio ns of Markov chains produ ced by randomly chosen transition probability matrices of di ff erent order, as well as transition proba bility matrices estima ted on genes and in tergenic regions of DN A s equen ce. In Section 4, we app ly the CMI testing to the tw o DN A sequences and in vestigate the limitations of ord er estima tion in term s of data size. Finally , con cluding remarks are discussed in Section 5. 2. Conditiona l Mu tual Information and Markov Cha in Order Estimation First we define CMI in ter ms of mutual in formatio n and subsequ ently e ntropies. The Shannon entropy expresses th e informa tion (or un certainty) of a rand om variable 2 X t H ( X ) = − X x p ( x ) ln p ( x ) , where the sum is defined fo r all possible symbols (discrete values) x ∈ A , and p ( x ) is the probab ility of x occur ring in the c hain. The definition o f Shann on entropy is extend ed to a vector v ariable X t = [ X t , X t − 1 , . . . , X t − m + 1 ] from a stationary M arkov c hain { X t } , referred to as word of length m , and reads H ( X t ) = − X x t ,..., x t − m + 1 p ( x t ) ln p ( x t ) , where x t = { x t , x t − 1 , . . . , x t − m + 1 } ∈ A m , p ( x t ) is the probability o f a w ord x t occurrin g in the chain, and the sum is over a ll possible words of K symb ols and length m . The m utual info rmation (MI) o f two rand om variables in the Markov chain being m time steps apart, denoted I ( m ) = I ( X t ; X t − m ), is defined in terms of entropy as [5] I ( m ) = H ( X t ) + H ( X t − m ) − H ( X t , X t − m ) = X x t , x t − m p ( x t , x t − m ) ln p ( x t , x t − m ) p ( x t ) p ( x t − m ) . (1) While I (1) q uantifies the amount of inform ation X t − 1 carries about X t and vice versa, I (2 ) canno t be inter preted accord ingly du e to the p resence of X t − 1 , and the in- formation of X t − 2 about X t , or part o f it, may already be sh ared with X t − 1 . Th us if we are after the gen uine info rmation of X t − 2 about X t , we n eed to account for th e infor- mation of X t − 1 about X t . This is indeed desired when we want to estimate the memory of th e pro cess, i.e . the order of the Markov chain. Th e app ropriate measure f or th is is th e co nditional mutu al inform ation (CMI). CMI o f ord er m is defined as the mutua l informa tion of X t and X t − m condition ing on X t − m + 1 , . . . , X t − 1 [5] I c ( m ) = I ( X t ; X t − m | X t − 1 , . . . , X t − m + 1 ) = I ( X t ; X t − 1 , . . . , X t − m ) − I ( X t ; X t − 1 , . . . , X t − m + 1 ) = − H ( X t , . . . , X t − m ) + H ( X t − 1 , . . . , X t − m ) + H ( X t , . . . , X t − m + 1 ) − H ( X t − 1 , . . . , X t − m + 1 ) = X x t ,..., x t − m p ( x t , . . . , x t − m ) ln p ( x t | x t − 1 , . . . , x t − m ) p ( x t | x t − 1 , . . . , x t − m + 1 ) . (2) CMI c oincides with MI for suc cessi ve r andom variables in the chain, that is I c (1) = I (1). 2.1. Estimation of Cond itio nal Mutual In fo rmation The estimation of CMI is given through the estimation of the joint pro bability and the cond itional pro babilities in (2) by the co rrespon ding relativ e f requen cies. Specifi- cally , th e maximum likelihood estimate (MLE) of p ( x t , x t − 1 , . . . , x t − m + 1 ) is ˆ p ( x t , x t − 1 , . . . , x t − m + 1 ) = n i 1 ,..., i m K m , 3 where n i 1 ,..., i m is the fre quency of o ccurren ce of a word { i 1 , . . . , i m } ∈ A m in the sym- bol seque nce { x t } N t = 1 , defined as n i 1 ,..., i m = P N t = m I( x t = i 1 , . . . , x t − m + 1 = i m ), where I denotes the indicator f unction. Respectively , the M LE of the c ondition al p robab ility p ( x t | x t − 1 , . . . , x t − m ) is ˆ p ( x t | x t − 1 , . . . , x t − m ) = n i 1 ,..., i m , i m + 1 n i 1 ,..., i m . The estimate ˆ I c ( m ) of I c ( m ), by sub stituting the probab ility estimates in (2), inherently su ff ers from th e ine ffi ciency of MLE at hig h dim ensions b eing less accurate with the increase o f m or K and the d ecrease o f N , but also more biased. It has been proved that entropy e stimation in volves a n egati ve bias, i.e. th e estimated value is lower than the real one [ 13, 20]. Consequently , MI estimatio n has positive bias which in creases with K and m [1 3, 20], and thus the estimation of CMI h as a lso positive bias, as CMI is the di ff erence of two MI terms, where th e arguments in the first MI term ha ve join tly a dimension larger by one than that of the second MI term. Expr essing the bias of CMI as the di ff erenc e of the bias of two MI terms, indicates that the CMI estimate has lower bias than th e bias for the respective MI’ s, which h as bee n shown for co ntinuou s variables in [23]. An appr oximate expr ession for the bias of the entropy estimate of a ran dom variable of K symb ols from a sample of size N is gi ven by [20] ˆ H ( X ) − H ( X ) = − ( K − 1) / (2 N ) . Noting that a word X t of length m is equiv alent to a random variable X in K m symbols, we can express in the same way the bias of the entropy estimate for a word X t from a symbol sequence of length N a s ˆ H ( X t ) − H ( X t ) = − ( K m − 1) / (2 N ) . Substituting the expressions for the en tropy b ias in the definition of CMI in terms of entropies in (2), we find the following appro ximation for the bias of the CMI estimate ˆ I c ( m ) − I c ( m ) = K m − 1 ( K − 1) 2 / 2 N . (3) Note tha t the app roxima te bias for I ( X t ; X t − m ) fo r any m is ( K − 1) 2 / 2 N derived f rom (3) for m = 1. From ( 3) it can be seen that the bias o f CMI increases when any of K and m increases and N decreases. 2.2. Ran d omization test for the significa nce o f CMI W e use CMI to estimate the o rder L of a Markov chain. The fun damental proper ty of a Markov chain of order L is p ( X t | X t − 1 , X t − 2 , . . . , X t − L , X t − L − 1 , . . . ) = p ( X t | X t − 1 , X t − 2 , . . . , X t − L ) , meaning that th e distribution of the variable X t of the Markov chain at time t is deter- mined in terms on ly o f the prece ding L variables of the chain. Thus for any lag orde r m ≤ L , we expec t in general two v ariables m time steps apart to be dependent given th e m − 1 intermediate variables, and then I c ( m ) > 0. On the other hand, for m > L it must 4 be I c ( m ) = 0. Note th at it is possible that I c ( m ) = 0 f or m < L , but not f or m = L , as then the M arkov chain orde r would not be L . So, increasing the ord er m , we expect in general when I c ( m ) > 0 and I c ( m + 1) = 0 to have m = L . T o account for com plicated and rather unu sual cases where I c ( m + 1) = 0 o ccurs for m + 1 < L , w e can extend the condition I c ( m ) > 0 and I c ( m + 1 ) = 0 to requir e also I c ( m + 2 ) = 0, and even fur ther up to some order m + k . The condition I c ( m + 1 ) = 0 for m = L does not hold exactly when estimating CMI from finite symbol sequences, and we always ha ve ˆ I c ( m + 1) > 0 due to p ositiv e bias in the estimatio n o f I c ( m + 1 ). T o add ress this, a significa nce test o f I c ( m ) for increasin g m has to be d ev eloped for the null hyp othesis H 0 : I c ( m ) = 0. In th e absence of a rigoro us an alytic null d istribution o f the test statis tic ˆ I c ( m ), we propo se a randomiz ation test using an ensemble of resampled (actually randomized as we preserve the marginal distribution) symbo l sequences in order to form the empirical null distrib ution of ˆ I c ( m ). The test is o ne-sided with alter native hy pothesis H 1 : I c ( m ) > 0, as the estimation b ias of I c ( m ) is positiv e. The random ization test is de veloped i n the following steps. 1. W e generate M rando mized symbol sequence s { x ∗ 1 t } N t = 1 , . . . , { x ∗ M t } N t = 1 , by ra ndom permutatio n of the initial sequen ce { x t } N t = 1 . 2. W e com pute ˆ I c ( m ) o n the o riginal symbol seq uence, de noted ˆ I 0 c ( m ), and on the M r andomiz ed seq uences, denoted ˆ I ∗ 1 c ( m ) , . . . , ˆ I ∗ M c ( m ). 3. W e rejec t H 0 if ˆ I 0 c ( m ) is at the right tail of the em pirical null distribution formed by ˆ I ∗ 1 c ( m ) , . . . , ˆ I ∗ M c ( m ). T o assess this we use rank ord ering, where r 0 is th e rank of ˆ I 0 c ( m ) in the o rdered list o f th e M + 1 values, assumin g ascendin g ord er . The p -value of the one-sided test is 1 − ( r 0 − 0 . 32 6) / ( M + 1 + 0 . 3 48) (this correction for the empirical cumulative function is proposed in [24]). The random ized sequences are by constru ction ind epend ent, but with the same marginal distribution as the orig inal seq uence, and therefo re they ar e consistent with H 0 . The es- timation of L with the p ropo sed CMI-testing in v olves seque ntial implementa tion of the random ization significan ce test of I c ( m ) for increasing m , starting with m = 1. The repetitive procedure sto ps at an orde r m + 1 if no rejection of H 0 is obtaine d an d th en ˆ L = m . T o avoid prematu re ter mination o f the sequen tial testing, wh ich however can only be expected in sp ecial pr actical cases, the termination criterion m ay requ ire that H 0 is not rejected f or more than one orders exceeding ˆ L = m . The termination cr iterion in the CMI-testing does no t requir e a maxim um order to b e defined , which con stitutes a free parameter for other order selection criteria [7, 10]. W e illustrate the proposed CMI- testing with an example of th e e stimation of the order L = 4 of a Markov ch ain of K = 2 sym bols defined b y a randomly selected transition matr ix. The C MI est imate ˆ I c ( m ) f or m = 1 , . . . , 10 compu ted on th ree symb ol sequences of length N = 10 00 generated by this Markov chain is shown in Figu re 1a together with the a pprox imate bias estimate fo r I c ( m ) = 0 d erived in (3). For all thre e realizations, ˆ I c ( m ) ten ds to inc rease fo r m ≤ L , then for m = L + 1 dr ops at the level of the approx imate bias, a nd further increases for m > L but does not exceed the approx imate bias o f zer o CMI . Th ough the appro ximate bias s eems to d iscriminate significant I c ( m ) for m ≤ L fro m insignificant I c ( m ) for m > L , it does not constitute an accurate upper bo und of significan ce to be used as a criterio n f or the estimation of L . Note that in Figure 1a not all three ˆ I c ( L + 1) are below the approxima te bias value. The 5 use of randomized sequen ces turns out to provide more a ccurate significance limits. As shown in Figur e 1b for one o f th e thr ee re alizations, when m ≤ L , ˆ I 0 c ( m ) is larger than any ˆ I ∗ i c ( m ) f or the M = 1 000 rand omized sequences, but it is smaller or within th e ra nge of ˆ I ∗ i c ( m ), i = 1 , . . . , M when m > L . The p -values of the tests shown in Figure 1c for the three realizations co nfirms the cor rect estimation o f L = 4 using the CMI -testing, being less than the sign ificance limit α = 0 . 0 5 for m ≤ L and larger f or m > L . I n th e next Section, these finding s are established by means of Monte Carlo simulations and compare d to other known order estimation criteria. 2.3. Other criteria for Markov chain or der estimation There are various Markov chain order estimato rs in the literature [2, 6 – 10, 14– 17, 19, 21, 22, 25], and we briefly discuss her e the m ost pro minent ones that we also consider in th e com parative study . T he first is th e well-k nown Ak aike’ s infor mation criterion ( AIC) [9, 10, 22], which uses the Kullback-Le ibler inform ation to define the likelihood ratio (LR) statis tic o f k -th ord er versus L -th order Markov chain n k , L = − 2 N X i = 1 ln f ( x i | ˆ θ k ) / f ( x i | ˆ θ L ) , where ˆ θ L is the unre stricted maximum likelihood estimate (MLE) of θ . The AIC func- tion is AIC( k ) = n k , L − 2( K L + 1 − K k + 1 )( K − 1) , and the estimated order is ˆ k = arg min 0 6 k 6 L AIC( k ). Katz [10] applied the Bayesian informatio n criterion (BIC) to the prob lem o f Markov chain order estimation. Similarly to AIC, BIC is defined as BIC( k ) = n k , L − ( K L + 1 − K k + 1 )( K − 1) ln N , and the ord er estimate is ˆ k = arg min 0 6 k 6 L BIC( k ). Though AIC is known to b e inco n- sistent and BIC consistent o rder estimate [6], it was shown that BIC do es not perf orm as well as AIC for small sample sizes [6, 10]. The Peres-Shields estimator [19] uses the so-called fluctuation function ∆ k x ( υ ) = max a ∈ A N x ( υ a ) − N x ( τ k ( υ ) a ) N x ( τ k ( υ )) N x ( υ ) , where N x ( υ ) den otes the frequency of occurrence of the word υ of length l in { x t } N t = 1 and τ k ( υ ) den otes the k -su ffi x of υ , i.e. τ k ( υ ) = υ l l − k + 1 . The initial exp ression of the Peres-Shields estimator is rath er complicated and Dalevi and Dubhashi [7] prop osed a simpler estimator, still close to the or iginal Peres-Shields estimator , gi ven as ˆ k = arg m ax k ≥ 0 ( ∆ k x ( υ ) / ∆ k + 1 x ( υ )) and we use this estimator in the comparative study de noted as PS. Menendez et al [14] start with the observation that the LR test can b e expr essed in terms of the Kullback-Lieb ler d iv ergence, which belong s to the class of the so-called 6 φ -divergence mea sures. Then they g eneralize LR for orders k an d k + 1 fo r any φ - div ergence given a s S φ = 2 φ ′′ (1) X a 1 ,..., a k + 1 n a 1 ,..., a k X a k + 1 ˆ p ( a k + 1 | a 2 , . . . , a k ) φ ˆ p ( a k + 1 | a 1 , . . . , a k ) ˆ p ( a k + 1 | a 2 , . . . , a k ) ! , where φ ′′ is th e secon d derivati ve of φ . For φ ( x ) = x log x − x + 1 we get th e stand ard LR in ter ms of Kullback- Liebler d iv ergence. Menend ez et al [16] su ggest using φ ( x ) = ( λ ( λ + 1) ) − 1 ( x λ + 1 − x + λ (1 − x ) ) for λ = 2 / 3 , and they rep eat LR test f or in creasing k order until no rejection is o btained, wher e S φ follows the Chi-squared distribution with ( K k + 1 − K k )( K − 1) degrees of freed om. W e adopt this fo rm of the test in th e compara ti ve study and denote it Sf. 3. Monte Carlo Simulations W e compar e the CMI-testing to th e ap proxim ate CMI bias estimate of (3), as we ll as other known criteria for the estimation of the Markov chain order L , and for this we use Monte Carlo simulations f or varying param eters L , K and N . F o r each param - eter setting, we use 100 realizatio ns and for the CMI-testing M = 1 000 ran domized sequences for eac h realiza tion, and for all estimation method s the order is sou ght in the ran ge m = 1 , . . . , L + 1. I n the fir st simula tion setup, Markov chain s are der i ved by r andom ly set transition probability matric es o f given order L , while in the seco nd simulation setup Markov ch ains are derived b y transition matrices of given or der L , estimated on two DNA seq uence of g enes and inte rgenic region s. The results on the latter setting will give us the ground s for interpr eting the r esults from the estimation of the Markov chain order on the DN A sequences in Sec. 4. 3.1. Ran d omly selected transition pr oba bilities First, we confirm th e results about the illustrati ve examp le of Figure 1 using 100 realizations. As m increases from 1 to L , ˆ I c ( m ) increases and lies over the appr oximate bias fo r I c ( m ) = 0 defined in (3), as shown by the box plots in Figur e 2a and indica ted by th e num ber of ca ses ˆ I c ( m ) exceed ing th e limit o f the bias app roximatio n for each m . Howe ver, when m = L + 1, ˆ I c ( m ) falls belo w this approximated bias for only about half o f the 100 realizations, indicating that th e approximate b ias cannot estab lish the significance of I c ( m ). On the other hand, si gnificanc e is well-established by the propo sed CMI-testing, and th e tran sition from sign ificant to insign ificant I c ( m ) at m = L can be safely detected. As sho wn in Figure 2b, for all but one realization H 0 : I c ( L ) = 0 is r ejected at the significan ce lev el α = 0 . 05, an d only for 8 rea lizations H 0 : I c ( L + 1 ) = 0 is rejected at the same α . W e note that fo r m = 1 the p ower of ˆ I c ( m ) is very low (r ejection is o btained for o nly 57 cases), and improves as m increases towards L . The first reason is that in gen eral the rand omization test is conservati ve [11], e.g. note that ˆ I c (1) is over th e significance bias limit far m ore often than th e significan ce limit drawn b y the randomized sequences. Th e second and m ost importan t reaso n is s pecific to the simulation setu p. The rand om selection o f the tra nsition m atrix determ ines on av erage even depen dence of one symbol in the chain to the L pre ceding symbols. Thus the kn owledge of x t − 1 contributes p artially (by a factor of about 1 / 4 fo r ou r example 7 T able 1: Numb er of times the corr ect order L is estimated in 100 realization s by the criteria CMI, AIC, BIC, PS and Sf. The 100 symbo l sequences of leng th N (b eing 500, 1 000 and 6000 as indica ted in the first row) are g enerated by a M arkov chain of K = 2 symbols with a randomly selected transition probability matrix of o rder L , for L varying as given in the secon d row . The best success rate for each L is highligh ted. criterion N = 500 N = 1000 N = 60 00 L = 2 L = 3 L = 4 L = 5 L = 7 L = 2 L = 4 L = 6 L = 8 L = 2 L = 4 L = 6 L = 8 CMI 81 92 95 94 7 3 87 91 98 91 9 3 98 95 97 AIC 66 62 52 38 2 7 5 68 33 2 7 7 80 60 36 BIC 69 56 35 1 0 77 5 9 1 0 88 80 5 9 0 PS 78 72 73 63 3 7 88 77 71 47 9 7 98 99 96 Sf 86 60 46 28 0 9 2 42 29 0 9 7 3 1 40 with L = 4) to the to tal inform ation about x t , and ther efore ˆ I ( x t ; x t − 1 ) = ˆ I c (1) is small and can often be at the b order of being statistically significant. Th e bias o f ˆ I c (1) here is 1 / (2 N ) (see (3) for K = 2) and thus very close to zero, so that the distribution of ˆ I ∗ i c (1) from the ran domized sequences is asymm etric and mor e likely to be bro ader to the right than for a larger bias. The information fro m x t − 2 about x t is at the same le vel as f or x t − 1 when accountin g for x t − 1 , but now the bias of ˆ I c (2) is d oubled and th e distribution for the rando mized sequence s is more symmetric and less bro ader to the r ight, so that ˆ I c (2) may be at the right tail of th e n ull distribution more of ten. This a rgument explains the increase of the percentag e of rejections as m increases from one to L . W e co mpare the CMI- testing, and refer to it simply as CMI, to fou r known cr i- teria for the estimation of L : the Akaike’ s inf ormation criterion (AIC) [9, 1 0, 2 2], the Bayesian in formatio n criterion (BIC) [6, 8, 10, 21], the criterio n of Dale v i and Dubashi which is based on th e Peres an d Shield ’ s e stimator (PS) [7, 19], and the criterion o f Menendez et al ( Sf) [ 15, 16]. T able 1 p resents th e fre quency of estimating co rrectly L for Mar kov chains of the first simulation setup , K = 2, N = 5 00 , 1000 and N = 600 0. For L = 2, Sf scores hig hest with CMI being close behin d, but for larger L the suc- cess rate of Sf decreases steadily while CMI e stimates the correct o rder almost alw ay s, scoring mu ch high er than all the other criteria. For the largest o rder L = 7 examined for N = 500, the success rate of CMI decreases, prob ably due to insu ffi cient data size for such a large o rder, but th e oth er criteria fail com pletely to estimate this order and only PS man ages it f or 37 of the r ealizations. All methods imp rove their perfor mance when the sequen ce length increases to N = 1000 but at about th e same degree so th at the main di ff erenc es per sist. For larger L CMI maintains the h ighest success r ate at a lev el over 90%, even for L = 8, while the o ther criteria fail, with Sf drop ping again to the zero level for L = 8 . AIC and BIC follow a similar decreasin g success r ate with L down to the zero level with BIC bein g worse, and PS attains hig her success rates for larger L b ut still muc h lo w er than for CMI. When the chain length further inc reases ( N = 6 000), PS improves and p erform s a s well as CMI. The estimation o f L is m ore data d emanding when there ar e more symb ols K . As shown for K = 4 in T able 2, for N = 500, tho ugh CMI, PS and Sf succeed to identify 8 T able 2: Same as for T ab le 1, but for K = 4 . criterion N = 50 0 N = 1 000 N = 60 00 L = 2 L = 3 L = 4 L = 5 L = 2 L = 3 L = 4 L = 5 L = 6 L = 2 L = 4 L = 5 L = 6 CMI 100 100 1 8 1 98 100 96 2 3 9 6 100 100 5 AIC 0 0 0 0 2 0 0 0 0 37 0 0 0 BIC 0 0 0 0 0 0 0 0 0 32 0 0 0 PS 96 81 46 23 100 8 9 46 21 14 1 00 100 61 19 Sf 100 72 0 0 100 100 0 0 0 10 0 100 62 0 the correct order for L = 2 , 3 (with CMI s coring highe st), all b u t PS f ail for L > 3 with the score of PS falling slowest. For larger N ( N = 1000 and N = 6000) th e failure of th e cr iteria oc curs fo r larger L . AIC and BIC fail completely an d on ly fo r L = 2 and N = 6000 they have a su ccess r ate at abo ut o ne third. Again CMI keep s the hig h success rate as L incr eases until it collapses due to lack of su ffi cient data, b ut so do the other criteria already for sma ller L . F or example, for L = 3 an d N = 1000 bo th CMI and Sf sco re hig hest, b ut fo r L = 4 CMI still scor es very hig h while Sf has dr opped to zero score. Gener ally , Sf ha s th e te ndency to under estimate the ord er for larger L . Specifically , for the above simulation when L = 4, Sf estimates m = 1 , m = 2 , m = 3 at the rates 52% , 32 % , 16 % respectively . For larger L , PS tends to maintain some positi ve success rate when all other criteria fail completely (almost completely for CMI). The results o f th e simula tion setup of rand omly selected transition m atrices showed that CMI overall outperforms the o ther criteria, whereas PS scores well for large L (at cases even higher than CMI), an d Sf is best for very small L but scores poorly fo r larger L . AIC and BIC perfor m well for small numb er of symbols K , b ut their r equirem ent for data size incr eases faster with K than for the oth er cr iteria. BIC ten ds to p erform better than AI C for very small L , but this situation is reversed when L increases. PS and CMI keep the highest ra te for larger o rders over all settings. Howe ver, C MI stays ahead when th e length o f symbol sequences is smaller, wh ile the succ ess rate of PS seems to fall slo wer when th e order becomes larger . 3.2. T ransition pr oba bilities estimated on DNA DN A consists of f our nucleo tides, the two pur ines, adenin e (A) an d g uanine (G), and the two pyrimidin es, cytosine (C) and thymine (T), so DNA sequence can be con- sidered as a symbolic sequence o n the symbols A,C,G,T . In our analysis we use a large segment of the Ch romosom e 1 of the plant Arabidopsis th aliana . W e use two sequences, one joining to gether the genes, which contain non-cod ing r egions, called introns, in betwee n the co ding regions, called exons, and another sequence joinin g to- gether the intergenic region s wh ich have no n-codin g character . Th e seq uences used here are segments of the long sequences used in [12]. For the second simulation setup we form the Markov cha ins f rom transition ma- trices of given order L estimated o n the two DNA sequences of genes an d intergen ic regions, each of length N = 6 000. W e make the simu lations for K = 4 symb ols (A, C, G, T) and K = 2 symbo ls (purines, p yrimid ines). 9 T able 3: Same format of results as fo r T able 1 , but for transition matrices of g iv en ord er L estimated from a DN A sequenc e of genes of length N = 60 00 in the form of pur ines and pyrimidines ( K = 2) and all the four nucleotides ( K = 4) . criterion K = 2 K = 4 L = 2 L = 3 L = 4 L = 5 L = 2 L = 3 L = 4 L = 5 CMI 50 65 15 8 93 66 35 0 AIC 63 82 15 2 87 0 0 0 BIC 4 0 0 0 0 0 0 0 PS 56 58 13 9 73 42 14 8 Sf 50 20 1 0 99 19 0 0 T able 4: Sam e as for T able 3, but for the DN A sequence of intergenic regions. criterion K = 2 K = 4 L = 2 L = 4 L = 5 L = 6 L = 7 L = 2 L = 3 L = 4 L = 5 CMI 81 83 50 4 4 16 94 6 6 45 8 AIC 85 88 27 1 0 79 0 0 0 BIC 42 0 0 0 0 0 0 0 0 PS 8 1 43 27 28 14 92 28 1 0 21 Sf 85 9 1 0 0 98 23 1 0 The probability transition matrices of any ord er L estimate d on the DNA sequenc es giv e mor e comp licated structures of the Mar kov chains and make the e stimation of L harder than wh en they are randomly selected. As shown in T able 3 fo r the gene sequence, all criteria score lo wer than for the respecti ve orders L o f the first simulation setup even for very small L , though we use q uite large sequenc es ( N = 6 000). CMI is gener ally b est for K = 4, e.g. for L = 3 CMI e stimates the correct orde r fo r 2 / 3 o f the rea lizations with PS being seco nd best estimating cor rectly for 42 realizatio ns, Sf for on ly 1 9, and AIC and BIC f or no ne. Ho wever , AIC perform s better than the other criteria when K = 2, being best for L = 2, L = 3 a nd L = 4 followed by PS a nd CMI (and Sf for L = 2). For both K = 2 and K = 4, as L in creases the percentag e of success rate falls sharply for the other criteria b ut more regularly for CMI and PS. For the intergenic regions the results are somehow better for all criteria. As shown in T able 4, for K = 2 AIC scores hig hest for L = 2 and L = 4, with CMI fo llowing very clo sely (and Sf only fo r L = 2 ). As L incre ases th e percentag e of success rate f alls sharply for the oth er criteria b ut mor e regularly f or CMI and PS, while C MI scor es highest maintaining a success rate at about 50% for L = 5 and L = 6. The same rapidly decr easing success rate for L > 2 holds for K = 4 a nd fo r all but CMI criteria. Nev ertheless, CMI fails a lso to estimate the co rrect order f or L > 6 an d L > 4 wh en K = 2 an d K = 4, r espectively . The latter indicates the limit of orders that can be estimated with CMI for N = 6 000, so that if t he real DN A sequ ence has larger or der (or ev en infinite) this co uld not be estimated by CMI with suc h limited sequenc e.Generally , 10 AIC outper forms the other criter ia for smaller orders and fewer sy mbols. Howe ver, CMI and PS scor e hig hest for larger L , while CMI p erform s better than PS fo r larger K . 4. Application on DN A sequences In recent year s, much of the statistical analy sis of DN A sequences is focused on the estimation o f properties of coding and non-coding region s as well as on the dis- crimination of these re gions. There has been e vidence that there is a di ff erent st ructur e in cod ing and non -codin g sequence s an d that th e non -codin g sequenc es ten d to h av e long ra nge correlatio n, whereas the corr elation in co ding sequen ces exhibits exponen- tial decay [1, 4, 18]. H ere we use intergenic and gene sequences. Th e latter is a mixture of co ding region s ( exons) and non-codin g regions (intro ns), a nd th erefore we expect to have also long correlation du e to th e no n-codin g regions in it, b ut it should be less than the c orrelation in the in tergenic r egions consisting only of non-codin g parts. Thus both DNA sequen ces canno t be c onsidered as Markov chains, at least not of a moderate order, and the estimation o f the order L sho uld increase with the data size. W e estimate the order L of a h ypoth esized Markov Chain o n Chrom osome 1 of plant A rabidop sis thaliana by th e CMI-testin g and the other criteria. W e make the computatio ns for bo th genes and intergenic regions of len gth N = 10 000 and N = 10000 0 and for K = 2 (purine s, pyrimidines), and the estimated order s from all cr iteria are shown in Fig ure 3. First we n ote th at all criteria ten d to estimate larger order as N increases, and f or th e same N they find larger ord er for th e intergenic seq uence, b oth features being in agreement with t he discussion above. CMI establishes best these tw o features. The di ff er ence in the ord er of genes and in tergenic regions h olds for both N and th eir ord ers increase th e m ost fr om 3 and 6 for N = 100 00 to 9 and 1 2 for N = 10000 0, respectively . AIC estimates the same order s as CMI for N = 10 000, but for N = 100000 only the estimated o rder f or gen es incre ases to 6 a pproac hing the order for the intergenic region staying at a bout th e same level. The other three criteria estimate smaller o rders than CMI and AIC for N = 10000. Moreover , PS gives for N = 10 000 the reverse pattern of the order for genes being 3 and for intergenic re gions being 2, which changes t o 3 a nd 9 f or N = 1 00000 , respectively . BIC and Sf gi ve order estimates closer to the expected two f eatures, but the o rder estimation i s at a lower level than fo r CMI with Sf giving larger orders tha n BIC. CMI is the most co nsistent to the hypoth esis of lo ng range c orrelation in the intergenic sequ ence, and at a lesser degree to the gene sequence, as it provides the l argest depend ence of the order to the sequence length and maintains larger order for the intergenic sequ ence. 5. Discussion In this work we prop ose the use of th e measure o f co nditional mutual inf ormation (CMI) for the estimation of the order o f Markov cha in, in an analogou s way the partial autocorr elation is used for the estimation of the order of an au toregressive model in time series [3] . Among others, a main d i ff erence is that the significance limits for partial autocorrelation are d efined p arametrically (under mild c ondition s), while for 11 CMI only app roximate lim its have been r eported. Ou r simulations on analytic lim its for the bias of CMI, wh ich we have w o rked out, showed that they c annot provide accurate estimation of the Markov chain order L . Therefore we ha ve built a scheme called C MI-testing, applying i teratively a randomiza tion significan ce test for CMI, and the estimation of L is g iv en by the largest order m for which CMI is foun d statistically significant. Thus CMI- testing d oes not implicate any m aximum order, as fo r examp le the criteria of AIC and BIC. W e com pared CMI-testing to a numb er o f other known or der selection criteria using Monte Carlo simulations of Markov chains of varying order L and n umber of symbols K , and for di ff e rent seque nce length s N . Ran domization tests tend to be more co nser- vati ve for small data sizes, but we fou nd tha t CMI-testing cou ld id entify the cor rect L ev en at s mall sequences, e.g . fo r K = 2, N = 500 and L = 5 the success r ate was 94%. For larger K and L , a nd fo r smaller N , th e accuracy of th e estimatio n worsened, but still compa red to the othe r criteria it was generally the highe st. F o r sma ll L , other criteria could score higher but C MI-testing always followed c losely . The simulation s showed the approp riateness of CMI-testing in the setting s of no n- trivial structures in th e symb ol seq uences, inv olving hig h Ma rkov chain or der L . This was fur ther co nfirmed b y the simulation s on Markov chain s estimated on DN A se- quences, but also when applied , along with other criteria, to two real DN A sequ ences, one comprised of genes and the other of intergenic regions. Many reported works con- verge to that inte rgenic regions (consisting solely of n on-cod ing DN A) ha ve long range correlation s, and genes (containing coding and non-c oding DN A) have a m ixture of short and lo ng ran ge correlation s. As th e estimation o f CMI is computationally in- tensiv e, we made co mputatio ns on DN A seque nces up to the length N = 10 0000, fo r which CMI-testing g av e the lar gest Markov chain orders 9 and 12 for the gen es and in- tergenic sequences, respectively , being b oth high er than the orde rs ob tained by any o f the o ther criteria. This confir ms the ability of CMI-testing in id entifying large order s, as confirmed also in the simulations. T o the best of our knowledge, this is the first work using CMI for the estimation of Markov cha in order, and it cer tainly bears fu rther improvement. For the rando mization significance test we use r andom ly shu ffl ed sequen ces irresp ectiv e of the or der L , and we attribute to this lack of any dep enden ce in the surrog ate sequences the obser vation that for orders larger than the correct order L th e original CMI is o ften at the lower tail o f the distribution of the CMI on th e surrog ates. One possible improvement is to adjust the resampled sequen ces to the tested ord er , e.g. to b e gen erated from Markov chains o f order being one less than the tested order . Howe ver, the genera tion of such random ized sequences is not straightforward and it would additiona lly add to the heavy computatio nal cost in CMI-testing. The latter is a disadvantage of CMI-testing in prob- lems were com putation time m ay be an issue or wh en the seq uence length is very lar ge as fo r DN A. A para metric significance test would be a solutio n, which may co me at the cost of reduce d acc uracy as, to the best of our knowledge, there is no exact analytic distribution of CMI. W e curren tly work on this issue de veloping appr oximation s f or the CMI distribution. 12 References [1] Almir antis, Y ., Prov ata, A., 1 999. Lon g an d short range cor relations in genome organization. Journal of Statistical Physics 97, 233–26 2. [2] Baigo rri, A., Gon c ¸ alves, C., Resend e, P ., 2 011. Markov ch ain order estimation and χ 2 -diver gence measure. arXi v:m ath / 050 6080 v 1. [3] Box , G. E. P ., Jenkin s, G. M., Reinsel, G. C., 199 4. Time Series Ana lysis: Fore- casting and Control, 3rd Edition. Prentice-Hall, Ne w Jersey . [4] Buld yrev , S. V ., Do kholy an, N. V ., Go ldberger, A. L., Havlin, S., Pen g, C.-K., Stanley , H. E., V iswanathan , G. M., 1998. Analysis of DNA seq uences using methods of statistical physics. Physica A 249, 430–43 8. [5] Cover , T . M., Thomas, J. A., 19 91. Elements of Information Theory . W iley , Lon- don. [6] Csisz ´ ar , I., Shields, P . C., 2000 . The c onsistency of the BIC Markov o rder esti- mator . The Annals of Statistics 28, 1601– 1619. [7] Dalevi, D., Dubh ashi, D., 2005. The Peres-Shield s order estimator fo r fixed and variable length Markov M odels with applicators to DN A sequ ence similarity . Lec- ture Notes in Computer Science 3692, 291–3 02. [8] Dalevi, D., Dubha shi, D., Hermansson, M. , 2006. A ne w order estimator for fixed and variable leng th Markov mod els with applications to DNA seq uence similarity . Statistical Applications in Genetics and Molecular Biology 5, 1–24. [9] Gu ttorp, P ., 199 5. Stochastic Modeling o f Scientific Data. Stochastic Modeling Series. Chapman and Hall. [10] Katz, R., 1981 . On som e criteria for estimating the or der of a Markov chain. T ech nometric s 2 3 (3), 243–24 9. [11] Kugiumtzis, D ., 2008 . Evaluation of su rrogate and bootstrap tests for nonlinear ity in time series. Studies in Nonlinear Dynamics & Econometr ics 12 (4). [12] Kugiumtzis, D., Prov a ta, A., 2004. Statistical analy sis of gene and intergenic DN A sequ ences. Physica A 342 (3–4), 623–638 . [13] Li, W ., 199 0. Mutual inform ation functions versus correla tion function s. Journal of Statistical Physics 60 (5–6), 823–83 7. [14] Men ´ endez, M., Pardo, J., Pardo , L., 2001 . Csis z ´ ar’ s φ - diver gences for testing the order in a Markov chain. Statistical Papers 42 (3), 313–32 8. [15] Men ´ endez, M., Pardo, J., Pardo, L., Zogr afos, K., 2 006. On tests of depend ence based on min imum φ -divergence estimato r with con straints :an application to modeling DN A. Comp utational Statistics and Data Analysis 51 (2), 1100–1 118. 13 [16] Men ´ endez, M. , P ardo, L., Pardo, M., Zografos, K., 2011. T esting the or der of Markov dependen ce in DNA sequence s. Methodo logy and Computing in Applied Probability 13, 59–74 . [17] Pardo, L., 2006. Statistical inference based on di vergence measures. Ch apman and Hall. [18] Peng, C.-K., Buldyrev , S. V ., Goldberger, A. L., Ha vlin, S., S ciortino , F ., Simons, M., Stanley , H. E., 1992. Long-range correlation in nucleotide-sequence s. Nature 365 (6365) , 168– 170. [19] Peres, Y ., Shields, P ., 2005 . T wo n ew Markov order e stimators. arXiv:math / 0506 080 v1. [20] Roulston , M., 1999. Estimating the errors o n measured entropy a nd mutual infor- mation. Physica D 125, 285–294 . [21] Schwarz, G., 1978. Estimating th e dim ension of a mod el. The Annals of Statistics 6 (2), 461–46 4. [22] T o ng, H., 1975. Determination of the order of a Markov ch ain by Akaike’ s Infor- mation Criterion. Journal of Applied Probability 12 (3), 488–497 . [23] Vlacho s, I., Kugiumtzis, D., 2010 . Non -unifo rm state space reconstru ction and coupling detection. Physical Re view E 82, 01620 7. [24] Y u , G.-H., Hu ang, C.-C., 2 001. A distribution free plottin g po sition. Stochastic En viron mental Research And Risk Assessment 15 (6), 462–47 6. [25] Zhao , L., Dorea, C., Gonc ¸ alv es, C., 2001 . On d etermination o f the order of a Markov chain. Statistical Infere nce of S tochastic Processes 4, 273– 282. 14 0 2 4 6 8 10 0 0.02 0.04 0.06 0.08 0.1 0.12 0.14 0.16 0.18 0.2 m I c (m) (a) 0 2 4 6 8 10 0 0.02 0.04 0.06 0.08 0.1 0.12 0.14 0.16 0.18 0.2 m I c (m) (b) original randomized bias 0 2 4 6 8 10 0 0.2 0.4 0.6 0.8 1 1.2 m p−value for I c (m) (c) Figure 1: ( a) CMI vs o rder m for three realiza tions of a Markov cha in determin ed b y a randomly selected transition matrix ( K = 2, L = 4, N = 1000) . Sup erimposed is the approx imate b ias estimate for zero CMI denoted with a dashed grey (online red) line . (b) CMI vs order m for o ne of the three realizations in (a) a nd fo r 1 000 random ly shu ffl ed sequen ces, as indicated in the legend. (c) Th e p -value v s ord er of the randomization significance test fo r the three r ealizations in ( a). Th e horizontal dashed grey (online red) li ne is fo r the significance le vel α = 0 . 05 . 15 0 0.02 0.04 0.06 0.08 0.1 0.12 0.14 0.16 1 2 3 4 5 m 75 91 99 99 48 I c (m) (a) 0 0.2 0.4 0.6 0.8 1 1 2 3 4 5 m 57 80 97 99 8 p−value for I c (m) (b) Figure 2: Distribution of ˆ I c ( m ) in (a) an d p - values in (b) against the order m p resented as boxp lots from 100 realizations o f the Markov chain as in Figu re 1. The nu mber below each boxplot is for the realizations for which ˆ I c ( m ) is over th e appro ximate significance bias (d isplayed by a grey (c yan online) d ashed line) in (a) , and the p - value of the ra ndomiza tion significance test is below the significance level α = 0 . 05 (displayed by a dashed line) in (b). AIC BIC PS Sf CMI 0 2 4 6 8 10 12 DNA order (a) gene intergenic AIC BIC PS Sf CMI 0 2 4 6 8 10 12 DNA order (b) gene intergenic Figure 3: The estimated o rder L o f a Markov chain on Chromo some 1 of plant A rabidopsis thalian a (genes and intergenic region s) by the CMI- testing a nd the other criteria. The computation s are made for number of symbols K = 2 and length N = 10 000 in (a) and N = 10 0000 in (b). 16
Original Paper
Loading high-quality paper...
Comments & Academic Discussion
Loading comments...
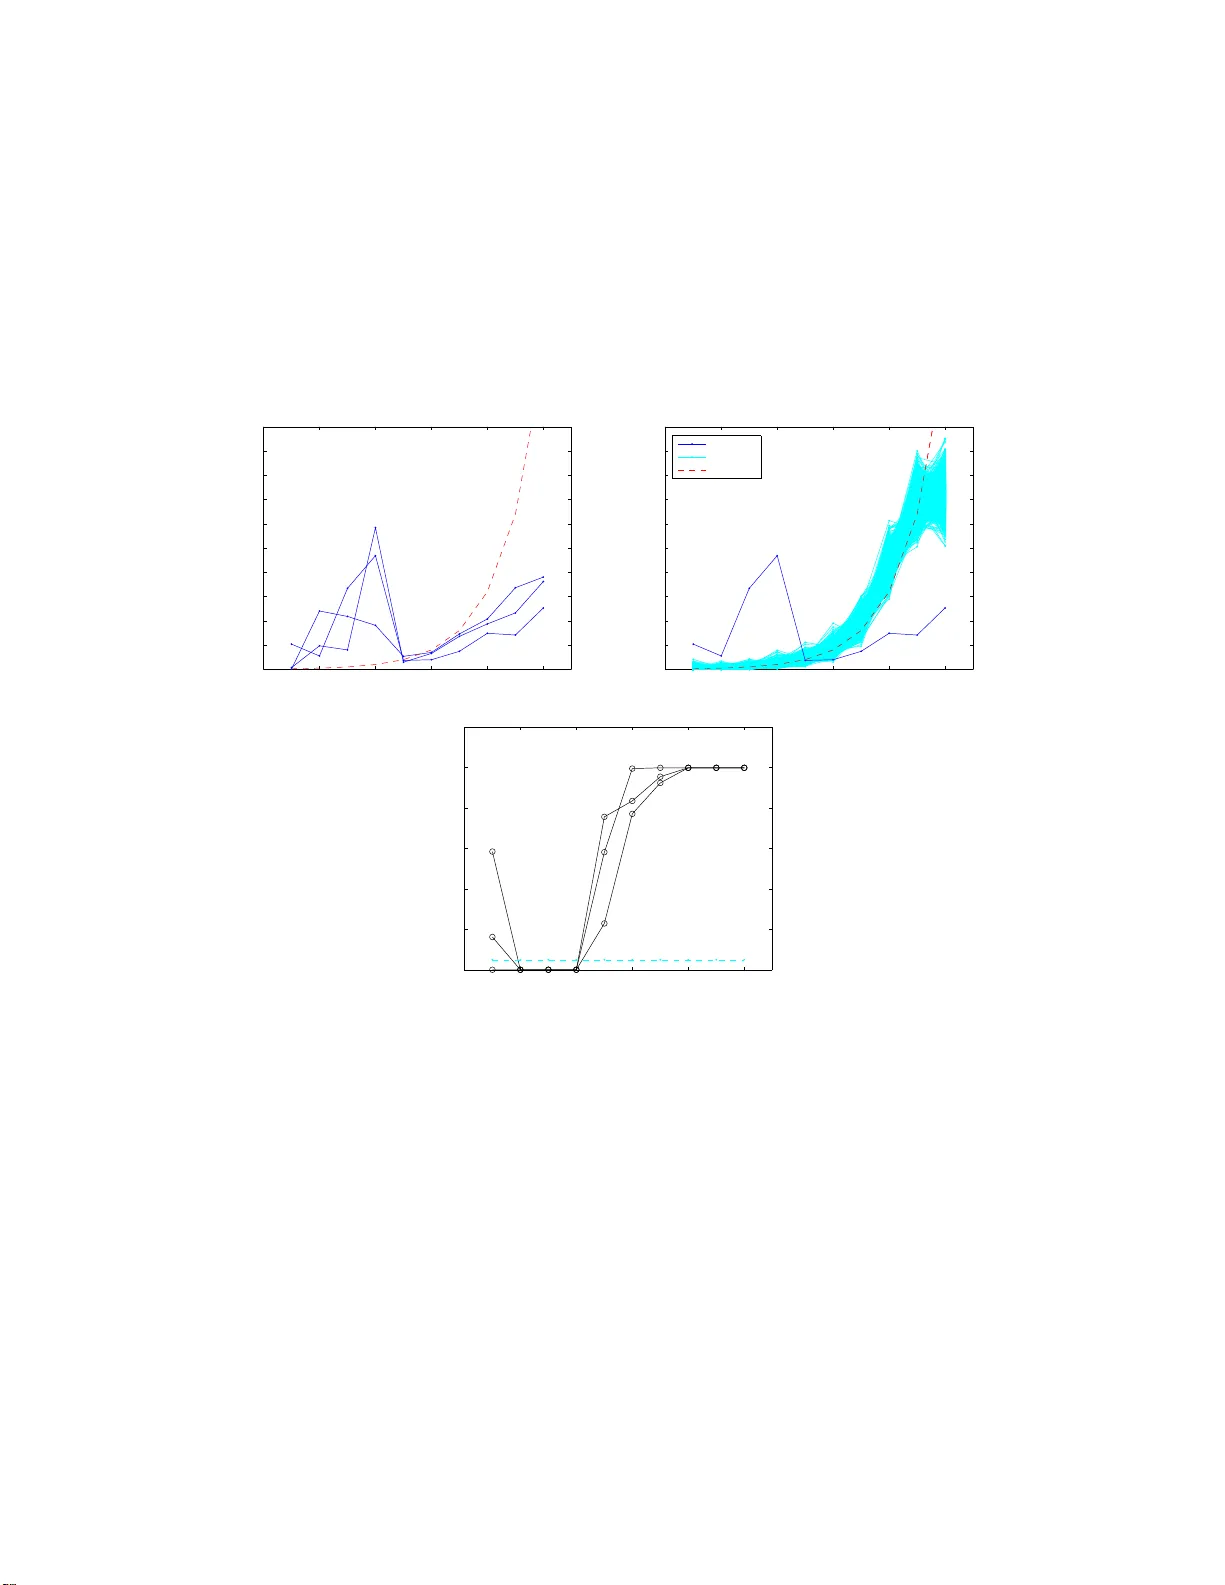
Leave a Comment