easyGWAS: An integrated interspecies platform for performing genome-wide association studies
Motivation: The rapid growth in genome-wide association studies (GWAS) in plants and animals has brought about the need for a central resource that facilitates i) performing GWAS, ii) accessing data and results of other GWAS, and iii) enabling all us…
Authors: Dominik Grimm, Bastian Greshake, Stefan Kleeberger
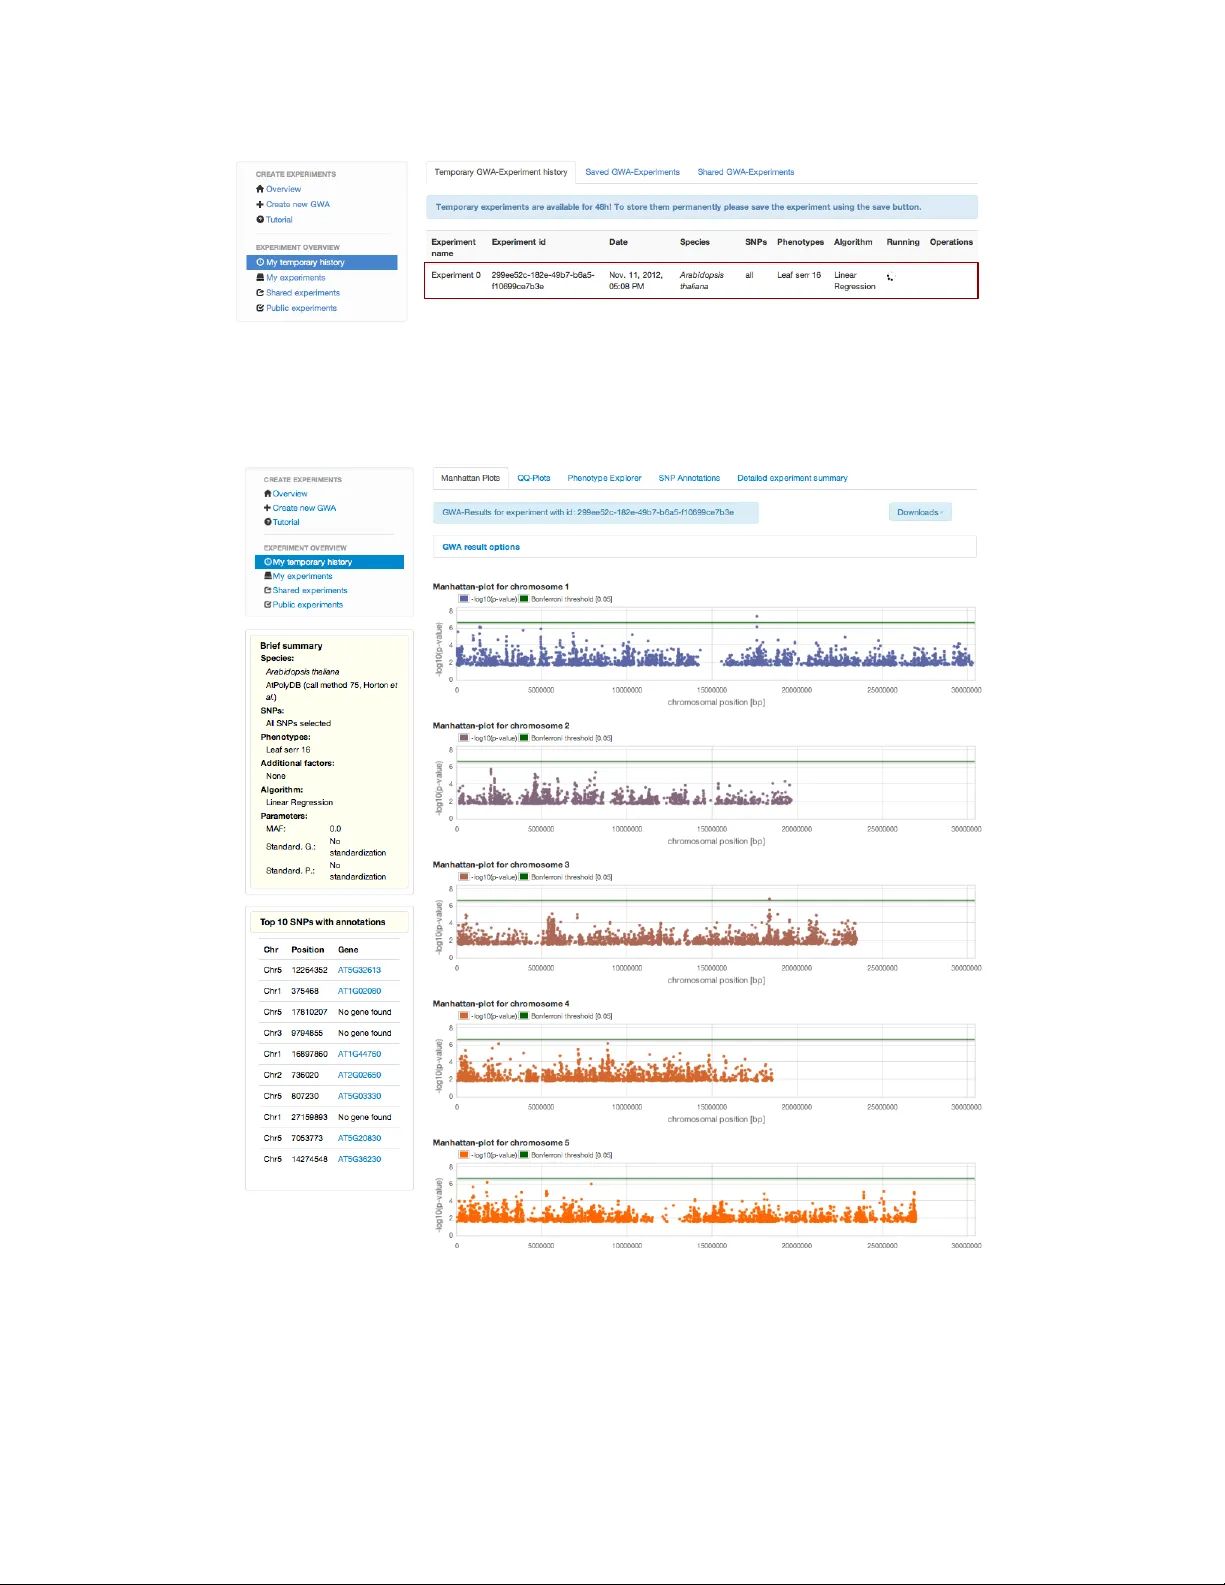
e asyGW AS : An in tegrated in tersp ecies platform for p erforming genome-wide asso ciation studies Dominik Grimm 1 , Bastian Greshak e 1 , Stefan Kleeb erger 1 , Christoph Lipp ert 1 , Oliv er Stegle 1 , Bernhard Sc h¨ olk opf 2 , Detlef W eigel 3 and Karsten Borgw ardt 1 , 4 1 Mac hine Learning and Computational Biology Research Group, Max Planck Institute for Dev elopmental Biology and Max Planc k Institute for Intelligen t Systems, T ¨ ubingen, German y 2 Departmen t of Empirical Inference, Max Planck Institute for In telligent Systems, T¨ ubingen, Germany 3 Departmen t of Molecular Biology , Max Planc k Institute for Developmen tal Biology , T ¨ ubingen, German y 4 Cen ter for Bioinformatics T ¨ ubingen, Eb erhard Karls Univ ersit¨ at, T ¨ ubingen, German y Con ten ts 1 Motiv ation 3 1.1 Difficulties in p erforming GW AS across traits and species . . . . . . . . . . . . . . . 3 1.2 Role of e asyGW AS . . . . . . . . . . . . . . . . . . . . . . . . . . . . . . . . . . . . . 4 1.3 F unctionalit y . . . . . . . . . . . . . . . . . . . . . . . . . . . . . . . . . . . . . . . . 4 1.4 In ter-compatibility with statistical genetics soft w are pack ages . . . . . . . . . . . . . 4 2 Example 4 3 Conclusion and future plans 6 A Data: Genot ypic & phenotypic data and meta information 7 A.1 Av ailable published data . . . . . . . . . . . . . . . . . . . . . . . . . . . . . . . . . . 7 A.2 Ho w to upload new data . . . . . . . . . . . . . . . . . . . . . . . . . . . . . . . . . . 8 A.2.1 Phenot ypic data and meta information . . . . . . . . . . . . . . . . . . . . . . 8 A.2.2 New genot ypic data . . . . . . . . . . . . . . . . . . . . . . . . . . . . . . . . 8 B Integrated metho ds to p erform genome-wide asso ciation studies 8 B.1 Metho ds to perform a GW AS . . . . . . . . . . . . . . . . . . . . . . . . . . . . . . . 9 B.2 T ransformations to standardize data . . . . . . . . . . . . . . . . . . . . . . . . . . . 10 C The w eb application interface 10 C.1 The e asyGW AS wizard and experiment history . . . . . . . . . . . . . . . . . . . . . 10 C.2 The data center . . . . . . . . . . . . . . . . . . . . . . . . . . . . . . . . . . . . . . . 13 1 C.3 The download cen ter . . . . . . . . . . . . . . . . . . . . . . . . . . . . . . . . . . . . 14 D The web application back end 14 E T utorials 15 E.1 Ho w to p erform a GW AS easily? . . . . . . . . . . . . . . . . . . . . . . . . . . . . . 15 E.2 Ho w to upload an own phenot yp e and p erform a GW AS on it? . . . . . . . . . . . . 18 E.3 Ho w to store, share or publish y our p erformed GW AS? . . . . . . . . . . . . . . . . . 19 E.4 Ho w to download summary statistics of y our results? . . . . . . . . . . . . . . . . . . 20 E.5 Ho w to download publicly a v ailable data? . . . . . . . . . . . . . . . . . . . . . . . . 20 2 Abstract Motiv ation: The rapid growth in genome-wide asso ciation studies (GW AS) in plants and animals has brough t ab out the need for a central resource that facilitates i) p erforming GW AS, ii) accessing data and results of other GW AS, and iii) enabling all users regardless of their bac kground to exploit the latest statistical techniques without ha ving to manage complex softw are and computing resources. Results: W e present e asyGW AS , a w eb platform that provides metho ds, to ols and dynamic vi- sualizations to p erform and analyze GW AS. In addition, e asyGW AS mak es it simple to repro duce results of others, v alidate findings, and access larger sample sizes through merging of public datasets. Av ailability: Detailed metho d and data descriptions as well as tutorials are av ailable in the supplemen tary materials. e asyGW AS is av ailable at h ttp://easygwas.tuebingen.mpg.de/. Con tact: dominik.grimm@tuebingen.mpg.de 1 Motiv ation Genome-wide asso ciation studies (GW AS) are an in tegral to ol for discov ering the p olygenic arc hi- tecture underlying many complex traits. The recent steady growth of GW AS applications across sp ecies (e.g. Ar abidopsis thaliana [1, 2, 3], Dr osophila melano gaster [4]) has generated a wealth of genot ypic and phenot ypic data, which mak es it p ossible to search for significan t asso ciation signals for multiple traits in one sp ecies or related traits in differen t sp ecies. F urther analysing the shared asso ciations across traits may provide inv aluable insights for genetics and ev olutionary biology: First, comparing results of GW AS in different sp ecies ma y enable statistical v alidation of asso cia- tion signals, for instance, to further supp ort findings in human genetics by replicating compatible results in mo del organisms. Second, one can examine the hypothesis that genetic factors influencing phenot yp es can b e traced back to related genes and m utations across sp ecies. By discov ering these common genetic origins of phenotypes, we may gain a deep er understanding of the adaptation of sp ecies and p ossibly of the conv ergen t or parallel evolution of complex traits. 1.1 Difficulties in p erforming GW AS across traits and sp ecies Obtaining genome-wide asso ciation mapping results across m ultiple studies, traits or even species, ho wev er, is still a cumbersome enterprise, whic h is complicated b y three problems: First, several soft ware pac k ages (e.g. PLINK [5]) or sp ecies-sp ecific w ebsites (e.g. DGRP [4], Matapax [6], Emma- Serv er [7]) allo w to p erform genome-wide asso ciation studies on a giv en dataset. How ev er, they either do not provide genot yp e and phenotype data at all or only for one single sp ecies. Second, existing databases for GW AS results (e.g. GW AS Catalog [8]) fo cus primarily on human genetics and presen t summary statistics only for the top scoring lo ci. This is despite the fact that the most significant genetic lo ci alone often explain only a small fraction of the heritability of complex traits [9]. Third, databases for human genotypic and phenot ypic data such as NCBI dbGaP [10] require a formal application and ev aluation b efore data access can b e granted. Data from GW AS 3 in mo del organisms and crops is more easily accessible in principle, but can only b e obtained from individual w ebsites in a v ariet y of data formats. If one wan ts to run asso ciation studies with iden tical parameter settings on these datasets, one has to p erform tedious data prepro cessing and data integration steps first. 1.2 Role of e asyGW AS The field is missing a platform that allows for easy and op en access to published genot yp e and phe- not yp e data from mo del organisms and crops and is able to p erform GW AS on different traits and sp ecies. Here, w e announce the release of e asyGW AS , an in teractive and easy-to-use online platform, whose purpose is to fill this gap. e asyGW AS is a v ailable at http://easygw as.tuebingen.mpg.de/ and enables users to p erform GW AS online on their o wn priv ate or publically a v ailable data and to store and publish phenotypic data, meta information on the samples and GW AS results. 1.3 F unctionality Genot ypic and phenotypic data from a con tinuously growing set of published GW A studies are prestored in e asyGW AS . Users can either work with these public phenotypes or upload their own phenot yp es. Phenotype data uploaded by the user can either b e kept priv ate for primary analyses, shared with a restricted set of collaborators, or made publicly a v ailable to the comm unit y such that other researchers can reuse them in their GW AS analyses. e asyGW AS allows to p erform univ ariate asso ciation tests in an in teractive manner, without the need to manage any computing resources or soft ware. Dep ending on whether the phenotype is binary or con tinuous, e asyGW AS offers suitable t yp es of mapping algorithms to the user. The results of a completed GW AS can then b e visualized in Manhattan plots with gene annotations for the top scoring signals. The example in section 3 and the Supplemen tary Material includes detailed instructions on ho w to perform GW AS in e asyGW AS . 1.4 In ter-compatibilit y with statistical genetics softw are pack ages If the user wan ts to p erform an analysis, which is curren tly only a v ailable in existing statisti- cal genetics softw are pack ages but not in e asyGW AS , the user can export e asyGW AS data and store them lo cally in a file format readable for these softw are pack ages. Data exp ort to PLINK, comma-separated files (CSV) and hierarchical data format (HDF5) file format is already av ailable in e asyGW AS . 2 Example In this example of usage, we demonstrate ho w to perform a GW A study in the plan t model organism A r abidopsis thaliana . W e use an already published phenotype FLC , which is related to the flo wering time of the plant. F or the FLC phenotype, RNA w as extracted from leav es after four weeks of gro wth and gene expression levels were determined by northern h ybridization quan tified relativ e to 4 b eta–tubulin expression. Creating a new GW A exp erimen t is divided into several intuitiv e steps. T o b e able to follow our instructions, the user should first navigate to the e asyGW AS exp erimen t wizard by clicking on GW AS Center and then on Create new GW AS . 1. First, the user selects a sp ecies and a dataset. In our example, w e select the sp ecies Ar a- bidopsis thaliana and the dataset AtPolyDB (c al l metho d 75, Horton et al.) and then clic k on Contin ue . 2. In the second step, the user has to select a phenotype. Here the user has the c hoice to select a published , priv ate/shared or public phenotype. Published phenotypes are accompanied b y a p eer-review ed research article, public phenotypes were made public by another user, but need not originate from a publication. Additionally , the user can upload own data (see Supplemen tary Materials or the online F AQ for detailed tutorials). Here, we select an already published phenotype FLC [3]. F or this purp ose, we select the tab 2.1 Select an existing published phenotype and type in to the input field the name of the phenotype FLC . Auto- completion will supp ort the user to select the correct phenot yp e. W e pro ceed by clicking on Con tin ue . 3. In this step, users can add additional factors such as principle comp onents or cov ariates (e.g. en vironmental factors, gender sp ecific characteristics). In our example, we do not add any additional factors. W e click Contin ue in the tab 3.1 No additional factors . 4. No w the user has to select genot ypic data. Here, all pro vided SNPs, sp ecific c hromosomes or a region of SNPs can b e selected. W e select chromosome 1 and 5 in the tab 4.2 Select one or sev eral c hromosomes for Ar abidopsis thaliana by chec king the b o xes and clic k on Select c hromosomes . 5. T o p erform a GW AS, w e hav e to select the asso ciation metho d w e in tend to use. In the algo- rithms view, one has options to also apply differen t transformations or filter to the data, such as normalizing the phenotypes. The selection of metho ds and transformations is dep enden t on the c hosen data. Our web application is analyzing the data on the fly and is enabling only those options that are applicable for the chosen data. Here w e k eep the default settings using a Linear Regression without any transformations. Then we click on Con tinue . 6. In the last step, users can chec k all inputs and can mak e adjustments if necessary . If everything is correct, the exp erimen t can b e submitted to the computation servers. F or this purp ose, we simply click on Submit Exp erimen t . Finally , the exp erimen t is submitted and all computations are p erformed in the background. The curren t view refreshes ev ery 3 seconds. In the meanwhile, users can submit new experiments or bro wse the data. Nevertheless, this example is finished in around 60 seconds and you will get automatically redirect to the result view to analyze the results. In the result view we pro vide 5 dynamic Manhattan plots. Every single SNP can b e explored in more detail by mo ving the mouse o ver a single p oin t in the plot. On the left we provide a list with the top 10 SNPs and in which gene they are lo cated. In our example the user can see at a glance, that for example the top three SNPs are located in chromosome 5. Additionally , we pro vide a more detailed SNP annotation view, quan tile-quantile plots (QQ-plots) and a phenot yp e sp ecific view with details ab out the phenotype (see Supplementary Materials for a detailed description and screenshots). Summary statistics can b e downloaded in v arious formats for further analysis with third party to ols. Additional detailed tutorials (supp orted b y screenshots) about uploading, sharing and do wnloading data are included in the Supplementary Materials. 3 Conclusion and future plans e asyGW AS is designed to b e a dynamically evolving platform with a gro wing num ber of functions and prestored datasets. As of no w, e asyGW AS offers published genot ypic and phenot ypic data for Ar abidopsis thaliana [1, 2, 3] and Dr osophila melano gaster [4] and users can upload their o wn phenot ypic data. e asyGW AS enables single-lo cus mapping with population structure correction for a single trait at a time. In future versions of e asyGW AS , w e plan to extend the list of sp ecies and to allo w users to upload their own genotypic data, while retaining data qualit y and reliabilit y . F urther metho ds for m ulti-lo cus and m ulti-trait mapping and for automatically retrieving shared asso ciation signals across traits will b e included. In summary , we b eliev e that e asyGW AS will foster new t yp es of genetic analyses, b y providing a con v enient framework, whic h includes data and algorithms for obtaining GW AS results across traits, studies and sp ecies. 6 A Data: Genotypic & phenot ypic data and meta information A.1 Av ailable published data T o easily perform genome-wide asso ciation studies (GW AS) across differen t species a v ariet y of pub- lished genotypes and phenot yp es are pre-stored in the e asyGW AS database. As of No vem b er 2012, data for Ar abidopsis thaliana and Dr osophila melano gaster are a v ailable in our public database. F or A r abidopsis thaliana we included different data sources. The first dataset [’A tPolyDB (call metho d 75, Horton et al. )’] includes 1,307 samples presented by Horton et al. in 2012 [1]. F urthermore, w e included 107 phenotypes, describ ed and analyzed by A tw ell et al. [3]. These 107 phenot yp es are measured for a subset of these 1,307 samples. The second dataset [’80 genomes data (Cao et al. )’] includes 80 samples from the first phase of the 1001 genomes pro ject in Ar abidopsis thaliana [2]. The genome matrix from the 1001 genomes website 1 w as used to retrieve all single nucleotide p olymorphisms (SNPs). F or this purp ose, w e excluded all p ositions with incomplete information and kept all p ositions with at least one consecutive nucleotide. All SNPs in these Ar abidopsis thaliana datasets are homozygous ones. Eac h allele in the SNPs is enco ded as describ ed in T able 1. ma jor allele minor allele ma jor allele 0 1 minor allele 1 2 T able 1: SNP enco ding F or the species Dr osophila melano gaster we in tegrated a dataset [’Drosophila Genetic Reference P anel (DGRP , Mack ay et al. )’] with 172 samples [4], sequenced and analyzed by Mack a y et al. , as well as three phenot yp es [4, 11, 12, 13] (six phenotypes, after splitting those in to male and female). Missing SNPs in the Dr osophila melano gaster genome were imputed using the ma jority allele (differen t mo des of imputation are curren tly b eing included into e asyGW AS and will b e a v ailable so on). Additionally w e in tegrated gene annotations for all organisms. This information is used to identify if a SNP is lo cated within a gene or not. Publicly av ailable genotypes and phenotypes are accompanied b y additional meta information such as growth conditions in Ar abidopsis thaliana or wolb achia status in Dr osophila melano gaster . All datasets were downloaded from their official websites (T able 2). 1 www.1001genomes.org 7 A tPolyDB (call method 75, Horton et al. ) Genot yp es h ttps://cynin.gmi.o ea w.ac.at/home/resources/atp olydb Phenot yp es h ttps://cynin.gmi.o ea w.ac.at/home/resources/atp olydb h ttp://arabidopsis.gmi.o ea w.ac.at:5000/DisplayResults/ 80 genomes data (Cao et al. ) Genot yp es h ttp://1001genomes.org/data/MPI/MPICao2010/releases/ Ar abidopsis thaliana annotations Annotations h ttp://www.arabidopsis.org/ Drosophila Genetic Reference Genot yp es h ttp://dgrp.gnets.ncsu.edu/freeze1/Illumina P anel (DGRP , Mack a y et al. ) + 454 SNP genotypes filtered for GW AS/ Phenot yp es h ttp://dgrp.gnets.ncsu.edu/freeze1/Phenotypes/ Dr osophila melano gaster annotations Annotations ftp://ftp.flybase.net/releases/FB2008 10/dmel r5.13/gff/ T able 2: Data sources for all integrated organisms A.2 Ho w to upload new data A.2.1 Phenot ypic data and meta information Registered users can upload priv ate data such as phenotypes, cov ariates or meta information using the e asyGW AS wizard (see T utorial 5.2 ). This data can b e used to p erform new GW AS or can b e shared with collab orators and colleagues. F urthermore, data can made b e public to the scientific comm unity . W e distinguish b et ween published and public data. Published data is integrated by the e asyGW AS team using data from p eer-review ed publications. How ev er, public data was made public b y any e asyGW AS user. W e also provide a contact form for authors who would like to hav e their published phenot yp e data integrated in to e asyGW AS through the e asyGW AS team, rather than uploading their data themselves. A.2.2 New genot ypic data Un til no w, we pro vide differen t datasets for tw o sp ecies. W e plan to include datasets from different sp ecies to pro vide a ric her selection of genot ypic and phenot ypic data. T o retain qualit y , w e pro vide an application form whic h users can use to send a formal data submission application to us. W e then will ev aluate the request. After successful ev aluation, we will provide an upload link and after successful upload and quality insp ection of the data, our team will include the data into our database (Figure 1). A future extension will b e a priv ate upload option for small genotypic data sets. B In tegrated metho ds to p erform genome-wide asso ciation stud- ies In general, p erforming a genome-wide asso ciation study is not trivial. There are three main asp ects that hav e to b e considered. The first category is data prepro cessing. The scien tist has to kno w ho w to enco de, normalize and filter the genot yp es, phenotypes and cov ariates. Second, the scientist has to know which metho d can b e used for whic h kind of data. There are binary and con tinuous phenot yp es as well as homozygous and heterozygous genot yp es. Only sp ecific metho ds can b e applied to a sp ecific type of data. Third, it is crucial to decide whether one should correct for 8 ATGCATGCATGCATC A CCATGCATGCTAGCTACG Individual 1 ATGCA G GCATGCATCCCCATGCATGCTAGC G ACG Individual 2 ATGCATGCATGCATC A CCATGCATGCTAGC G ACG Individual 3 ATGCATGCATGCATC A CCATGCATGCTAGC G ACG Individual n ... .......................................................................... New Genotype Data Steps to submit new Genotype data Su b m i s s i o n fo r m a) Describe the genotype data (Species,#SNPs...) b) Describe additional phenotypes, covariates or meta- information c) Submit form 1. Apply for submission 2. We check the request 3. Upload link is provided 4. We integrate the new data into our published database Figure 1: Application pro cess to submit new genot ypic data p opulation stratification or laten t confounding factors. F urther, some of these metho ds are hard to parameterize or complicated to set up. One of the strengths of e asyGW AS is that it provides sev eral implemented metho ds and data transformations out of the b o x. This helps the user to easily p erform a genome-wide asso ciation study . B.1 Metho ds to p erform a GW AS The initial v ersion provides several univ ariate algorithms, such as linear regression, linear mixed mo dels (EMMAX [14], F aSTLMM [15]) and the Wilcoxon rank-sum test. Linear regression can b e used to find single asso ciations b et ween a single SNP and a phenotype. Linear mixed mo dels are used to correct for p opulation structure, family structure and cryptic relatedness at the same 9 time. T o all these metho ds one can add cov ariates, such as principle comp onents (PCs), environ- men tal factors or gender sp ecific characteristics. Additionally , the Wilcoxon rank-sum test can b e used for homozygous genotypes. These metho ds are state-of-the-art, more metho ds will b e added con tinuously . New metho ds for multi-mark er disco v ery such as t wo-locus search using graphical computing units (GPUs) and multi-trait discov ery will b e added in the near future. B.2 T ransformations to standardize data T o transform phenot ypic and genotypic data we added several metho ds. Genotypes can b e stan- dardized, one can zero-mean the data and/or divide by unit v ariance. Phenotypes can b e trans- formed in the same w a y . Additionally , phenotypes can b e log-transformed, square ro ot and box-co x transformed. Figure 2 illustrates a scheme of all options. Genotype T ransformation zero-mean zero-mean & unit-variance Phenotype T ransformation log10 SQRT Box-Cox GW A mapping Linear Regression FaSTLMM EMMAX Wilcoxon rank-sum test Figure 2: Scheme off all p ossible transformations and GW A mapping metho ds C The w eb application in terface The web application contains three main parts. There is one view to plan, p erform and store GW AS, a second view to browse and analyze the data and a third view to do wnload av ailable datasets. In the following, we will describ e all sections in detail. C.1 The e asyGW AS wizard and exp erimen t history The first section contains all necessary to ols to plan, p erform and analyze whole genome-wide asso ciation studies. Here registered users can use a step-by-step procedure (softw are wizard) to easily create new exp erimen ts (s ee T utorial 5.1, Figure 3a). The wizard is divided into sev eral steps. First the user has to choose an a v ailable sp ecies and dataset. In the next step a single phenot yp e can b e selected. Here it is p ossible to select an already published, priv ate or public phenot yp e. Additionally , one can upload an own phenot yp e. W e distinguish b et ween published and public phenot yp es. Published phenot yp es are already published, whereas public phenotypes 10 a) b) c) Figure 3: Screenshot from the GW A exp eriment view. Creating new GW A exp erimen ts and sharing the results with collab orators or the scientific comm unity are phenot yp es uploaded by a sp ecific user and made public to the communit y . After chosen a phenot yp e it is p ossible to add additional factors to the exp erimen t, suc h as principle comp onents or one or several cov ariates. Cov ariates are meta information such as environmen tal factors or gender sp ecific characteristics. T o pro ceed the user has to select genot ypic data. T o do so, it is p ossible to select all genot ypic data, meaning all av ailable SNPs. F urthermore, sp ecific c hromosomes or a range of SNPs can b e selected. The last step provides different algorithms, standardizations and filters. The selection of metho ds is based on the selected genotypic and phenot ypic data in the previous steps. The summary view in the end pro vides all user sp ecific selections and offers the user to adjust settings or to submit the exp eriment to the computation work ers. Eac h exp erimen t p erformed is sa ved in a temp orary exp eriment history (Figure 3b). Here all exp erimen ts are stored for primary analysis for at least 48h. T o k eep in teresting findings, users can store exp erimen ts p ermanen tly in their priv ate profile. T o simplify scientific exchange, all exp erimen ts can b e shared via the w eb application with collab orators and colleagues (Figure 3c). Sharing exp erimen ts and data can preven t lab orious extracting of data and findings. F urthermore, data and exp eriments can b e made public to the scientific communit y . All summary statistics can b e downloaded to further analyze the data using third part y to ols. P erforming GW AS can b e time consuming. Due to an adv anced technology (see Web applic ation infr astructur e ) the user can con tinue working using the w eb application while the exp erimen t is computed in the bac kground at the same time. Automated email notifications are send out as so on the computations are done. Additionally , the user can track the status of all exp erimen ts through the temp orary history (Figure 4). T o examine individual experiments eac h exp erimen t has an in teractive results page. Figure 5 sho ws a screenshot of the result page. The view is divided into tw o parts. The left part provides general information. Here a short summary table informs ab out all settings made by the user, e.g. which sp ecies, dataset and parameters w ere selected (Figure 5a). At a glance the user can see the top 10 SNP annotations with the smallest p-v alues (Figure 5b). Dynamic Manhattan-plots for all c hromosomes are rendered in the right half (Figure 5c). Each SNP within the Manhattan plot is in teractive, meaning that the user is able to insp ect single SNPs getting live information like the corresp onding p-v alue or in which gene the SNP is lo cated. The green line in each Manhattan- 11 Figure 4: Screenshot from temp orary exp erimen t history . The red highlighted ro w indicates that the exp eriment is still computing. a) b) c) d) e) f) g) Figure 5: Screenshot showing the result page of an exp erimen t. plot is the Bonferroni threshold. The alpha significance level can b e adjusted using the plotting options (Figure 5d). The strength of population structure confounding can b e easily explored with 12 Q-Q plots (Figure 5e) and the genomic control λ . T o see the actual distribution of a phenot yp e, the Phenotyp e Explor er shows histograms for transformed and non-transformed phenotypes and computes a Shapiro-Wilk test to test the n ull hypothesis that the data was drawn from a normal distribution (Figure 5f ). T o examine if SNPs of in terest are lo cated within genes, significant lo ci are summarized in a gene-annotation view (Figure 5g). C.2 The data center The second main section of the web application is the Data Center . Here, the user can browse a v ailable data, such as samples, phenotypes and cov ariates. Detailed information can b e accessed for eac h data entry , suc h as meta and/or geographical information (Figure 6). Asso ciated publi- cations are pro vided for all published entries. The Data Cen ter contains t wo main views. One for published and public data and a second for all user sp ecific priv ate/shared data. Priv ate data is only visible to the owner of the data. Note that priv ately shared data b elongs to the owner, meaning that only the owner has the p ermission to delete or m odify shared data. Figure 6: Data center with detailed information ab out sample, phenotypes and cov ariates 13 C.3 The do wnload cen ter The third section provides additional download options. Here, whole datasets (genotypic and phenot ypic data) for all integrated sp ecies can b e downloaded in different file formats. A t the momen t w e provide the following formats: PLINK[5], comma-separated files (CSV) and hierarchical data format 5 (HDF5) 2 . D The w eb application bac k end The back end of the web application is completely written in Django 3 a web framework for Python. F or the w eb design, w e used the Cascading St yle Sheets (CSS), pro vided b y Twitter Bootstrap 4 . T o Message-Broker Hybrid database server Postgresql HDF5 file format Webserver Periodic session workers Computation workers Internal server structure (invisible to the user) Clients Figure 7: Scheme of the web application infrastructure handle the huge amoun t of SNP data we developed a hybrid database mo del using a P ostgreSQL database and the HDF5 2 file format. Here all SNPs, asso ciated p ositions and chromosome indices as w ell as all phenotypes and cov ariates are stored in the HDF5 file. Additional phenot yp e, sample, 2 h ttp://www.hdfgroup.org/HDF5/ 3 h ttps://www.djangopro ject.com 4 h ttp://twitter.gith ub.com/b ootstrap/ 14 co v ariate and meta information are stored in the PostgreSQL database. HDF5 files are highly optimized to handle huge files and can b e accessed fast and easily . As GW A mappings are resource consuming all computations are distributed to differen t computation serv ers (w orkers). T o sc hedule differen t tasks smartly we are using a message broker (RabbitMQ 5 ). This broker distributes the differen t tasks to single work ers (Figure 7). The back end is w ell designed to easily extend the functionalit y of e asyGW AS using additional no vel metho ds. New sp ecies and datasets can b e in tegrated within hours, dep ending on the size of the data. If more computational p o wer is needed, new work ers can b e added dynamically . E T utorials In this section we pro vide v arious tutorials on ho w to use e asyGW AS . W e demonstrate how to actually p erform a genome-wide asso ciation mapping, ho w to upload o wn priv ate phenot yp es and ho w to share or mak e them public for collab orators and/or the scientific communit y . F urthermore, w e sho w how to do wnload summary statistics of GW A exp eriments and published genot yp e and phenot yp e data. Screenshots are attached to all imp ortan t steps. E.1 Ho w to perform a GW AS easily? In this tutorial w e demonstrate ho w to easily p erform a GW A study using Ar abidopsis thaliana and already published phenotype FLC (flow ering time related phenotype). 1. If not already done: Create a new e asyGW AS account and log in. 2. Na vigate to the e asyGW AS wizard Men u: GW A-Exp erimen ts → Create new GW A 3. First, select a sp ecies and a dataset. Here we choose the sp ecies Ar abidopsis thaliana and the dataset AtPolyDB (c al l metho d 75, Horton et al.) [1] and click Con tinue . 4. Select a phenotype. Here the user has the c hoice to select published, priv ate/shared and public phenot yp es. Additionally the user can upload his own data (see T utorial 5.2). Here 5 h ttp://www.rabbitmq.com 15 w e select a published phenotype FLC [3]. F or this purp ose, select the tab 2.1 Select an existing published phenotype and t yp e into the input field the name of the phenotype ( FLC [3]). Auto-completion will help you to select the correct one. Click Con tinue . 5. In the follo wing step y ou can add additional factors suc h as principle comp onents or co v ariates (e.g. environmen tal factors, gender sp ecific characteristics). In this tutorial we do not add an y additional factors. Click Con tinue in the tab 3.1 No additional factors . 6. No w we ha ve to select genot ypic data. Y ou hav e to choose if you lik e to use all provided SNPs, sp ecific chromosomes or a region of SNPs. F or this tutorial we select chromosome 1 and 5 in the tab 4.2 Select one or sev eral chromosomes for Ar abidopsis thaliana by c hecking the b o xes. Clic k Select chromosomes . 16 7. T o p erform a GW AS w e ha ve to select a metho d we intend to use. In the algorithms view one has options to also apply different transformations or filter to the data. The selection of metho ds and transformations is depe nden t on the c hosen data. Our web application is analyzing the data on the fly and is enabling only those options that are applicable for y our data. Here w e keep the default settings using a Linear Regression without any transformations. Clic k Con tinue . 8. In the last step y ou can c heck all your inputs again and do necessary adjustments. If ev- erything is correct, you can submit y our exp eriment to the computation servers. F or this 17 purp ose, simply click Submit Exp erimen t . 9. Finally y our exp eriment is submitted. All computations are running in the background. The curren t view gets refreshed every 3 seconds. In the mean while y ou could submit new exp erimen ts or browse the data. Nev ertheless, this exp erimen t is finished in around 60 seconds and you will get automatically redirect to the result view. E.2 Ho w to upload an o wn phenot yp e and perform a GW AS on it? Here we show how to easily upload new phenotypic data and how to p erform a GW AS with it. 1. Na vigate to the e asyGW AS wizard Men u: GW A-Exp erimen ts → Create new GW A 2. First, select a sp ecies and a dataset. Here we choose the sp ecies Ar abidopsis thaliana and the dataset AtPolyDB (c al l metho d 75, Horton et al.) [1] and click Con tinue . 3. No w na vigate to 2.2 Upload new phenot ypic data and download the linked demo file. Clic k on Cho ose File and upload the demo file. Clic k on Con tinue . 18 4. Finally pro ceed like in T utorial 5.1. Y ou may try different algorithms and transformations. E.3 Ho w to store, share or publish y our performed GW AS? T o k eep in teresting findings and exp erimen ts users can sa ve their results p ermanen tly using the sa ving functionality in My temp orary history . Here you can rename your exp erimen t and sa ve it in your exp erimen t history My exp erimen ts . T o simplify data exc hange b et w een colleagues and the scientific comm unity one has the p ossibilit y to share and publish sa ved exp erimen ts. F or this purp ose, op en the category My exp erimen ts and clic k on either Share Exp erimen t or Publish exp eriment . Note that if you like to publish an exp erimen t whic h w as p erformed on priv ate phenotypes and/or cov ariates, one has to publish all dep endent priv ate data. Please provide meaningful and useful names. 19 Provide meaningful names E.4 Ho w to do wnload summary statistics of y our results? F or each exp erimen t summary statistics can b e do wnloaded using the do wnload assistan t at the GW AS result page. Clic k on Do wnload Summary Statistics and c ho ose one of your preferred formats. Righ t now there are c hoices for comma-separated files (CSV) and hierarc hical data format 5 (HDF5 2 ). The summary statistic files contain p-v alues for each lo ci and chromosome. The HDF5 file has additional information on which samples were used. E.5 Ho w to do wnload publicly av ailable data? T o download whole genotype and phenotype data you can use the Do wnload Center in the main men u. Here you can do wnload all a v ailable data for each sp ecies and dataset in v arious formats, supp orting PLINK[5], CSV and HDF5 format. 20 References [1] Horton, M. W., Hanco c k, A. M., Huang, Y. S., T o oma jian, C., At w ell, S., Auton, A., Muliyati, N. W., Platt, A., Sp erone, F. G., Vilhjalmsson, B. J., Nordb org, M., Borevitz, J. O., and Bergelson, J. Nat Genet 44 (2), 212–216 F ebruary (2012). [2] Cao, J., Schneeberger, K., Osso wski, S., Gn ther, T., Bender, S., Fitz, J., Koenig, D., Lanz, C., Stegle, O., Lippert, C., W ang, X., Ott, F., Mller, J., Alonso-Blanco, C., Borgw ardt, K., Sc hmid, K. J., and W eigel, D. Natur e Genetics 43 (10), 956–963 Octob er (2011). PMID: 21874002. [3] A tw ell, S., Huang, Y. S., Vilhjlmsson, B. J., Willems, G., Horton, M., Li, Y., Meng, D., Platt, A., T arone, A. M., Hu, T. T., Jiang, R., Muliyati, N. W., Zhang, X., Amer, M. A., Baxter, I., Brac hi, B., Chory , J., Dean, C., Debieu, M., Meaux, J. d., Ec ker, J. R., F aure, N., Kniskern, J. M., Jones, J. D. G., Michael, T., Nemri, A., Roux, F., Salt, D. E., T ang, C., T o desco, M., T raw, M. B., W eigel, D., Marjoram, P ., Borevitz, J. O., Bergelson, J., and Nordb org, M. Natur e 465 (7298), 627–631 March (2010). [4] Mac k a y , T. F. C., Ric hards, S., Stone, E. A., Barbadilla, A., Ayroles, J. F., Zhu, D., Casillas, S., Han, Y., Magwire, M. M., Cridland, J. M., Ric hardson, M. F., Anholt, R. R. H., Barrn, M., Bess, C., Blanken burg, K. P ., Carb one, M. A., Castellano, D., Chab oub, L., Duncan, L., Harris, Z., Jav aid, M., Jay aseelan, J. C., Jhangiani, S. N., Jordan, K. W., Lara, F., Lawrence, F., Lee, S. L., Librado, P ., Linheiro, R. S., Lyman, R. F., Mac key , A. J., Munidasa, M., Muzn y , D. M., Nazareth, L., Newsham, I., Perales, L., Pu, L., Qu, C., Rmia, M., Reid, J. G., Rollmann, S. M., Rozas, J., Saada, N., T urlapati, L., W orley , K. C., W u, Y., Y amamoto, A., Zhu, Y., Bergman, C. M., Thorn ton, K. R., Mittelman, D., and Gibbs, R. A. Natur e 482 (7384), 173–178 F ebruary (2012). PMID: 22318601. [5] Purcell, S., Neale, B., T o dd-Bro wn, K., Thomas, L., F erreira, M. A. R., Bender, D., Maller, J., Sklar, P ., de Bakker, P . I. W., Daly , M. J., and Sham, P . C . Americ an journal of human genetics 81 (3), 559–575 September (2007). PMID: 17701901. [6] Childs, L. H., Lisec, J., and W alther, D. Plant Physiolo gy 158 (4), 1534–1541 April (2012). [7] Bennett, B. J., F arb er, C. R., Orozco, L., Min Kang, H., Ghazalp our, A., Siemers, N., Neubauer, M., Neuhaus, I., Y ordano v a, R., Guan, B., T ruong, A., Y ang, W.-p., He, A., Ka yne, P ., Gargalovic, P ., Kirchgessner, T., Pan, C., Castellani, L. W., Kostem, E., F ur- lotte, N., Drake, T. A., Eskin, E., and Lusis, A. J. Genome R ese ar ch 20 (2), 281–290 January (2010). [8] Hindorff, L. A., Sethupath y , P ., Junkins, H. A., Ramos, E. M., Meh ta, J. P ., Collins, F. S., and Manolio, T. A. Pr o c e e dings of the National A c ademy of Scienc es of the Unite d States of A meric a 106 (23), 9362–9367 June (2009). PMID: 19474294. 21 [9] Manolio, T. A., Collins, F. S., Co x, N. J., Goldstein, D. B., Hindorff, L. A., Hun ter, D. J., McCarth y, M. I., Ramos, E. M., Cardon, L. R., Chakrav arti, A., Cho, J. H., Guttmacher, A. E., Kong, A., Kruglyak, L., Mardis, E., Rotimi, C. N., Slatkin, M., V alle, D., Whittemore, A. S., Bo ehnk e, M., Clark, A. G., Eic hler, E. E., Gibson, G., Haines, J. L., Mack ay , T. F. C., McCarroll, S. A., and Visscher, P . M. Natur e 461 (7265), 747–753 Octob er (2009). [10] Mailman, M. D., F eolo, M., Jin, Y., Kimura, M., T ryk a, K., Bagoutdinov, R., Hao, L., Kiang, A., Pasc hall, J., Phan, L., P op o v a, N., Pretel, S., Ziy abari, L., Shao, Y., W ang, Z. Y., Sirotkin, K., W ard, M., Kholo do v, M., Zbicz, K., Beck, J., Kimelman, M., Shevelev, S., Preuss, D., Y asc henko, E., Graeff, A., Ostell, J., and Sherry , S. T. Natur e genetics 39 (10), 1181–1186 Octob er (2007). PMID: 17898773 PMCID: PMC2031016. [11] Harbison, S. T., Y amamoto, A. H., F anara, J. J., Norga, K. K., and Mac k a y , T. F. C. Genetics 166 (4), 1807 –1823 April (2004). [12] Morgan, T. J. and Mack a y , T. F. C. Her e dity 96 (3), 232–242 March (2006). PMID: 16404413. [13] Jordan, K. W., Carb one, M. A., Y amamoto, A., Morgan, T. J., and Mack ay , T. F. Genome Biolo gy 8 (8), R172 August (2007). [14] Kang, H. M., Sul, J. H., Service, S. K., Zaitlen, N. A., Kong, S.-y ., F reimer, N. B., Sabatti, C., and Eskin, E. Nat Genet 42 (4), 348–354 April (2010). [15] Lipp ert, C., Listgarten, J., Liu, Y., Kadie, C. M., Da vidson, R. I., and Heck erman, D. Nat Meth 8 (10), 833–835 Octob er (2011). 22
Original Paper
Loading high-quality paper...
Comments & Academic Discussion
Loading comments...
Leave a Comment