Identifying differentially expressed transcripts from RNA-seq data with biological variation
Motivation: High-throughput sequencing enables expression analysis at the level of individual transcripts. The analysis of transcriptome expression levels and differential expression estimation requires a probabilistic approach to properly account fo…
Authors: Peter Glaus, Antti Honkela, Magnus Rattray
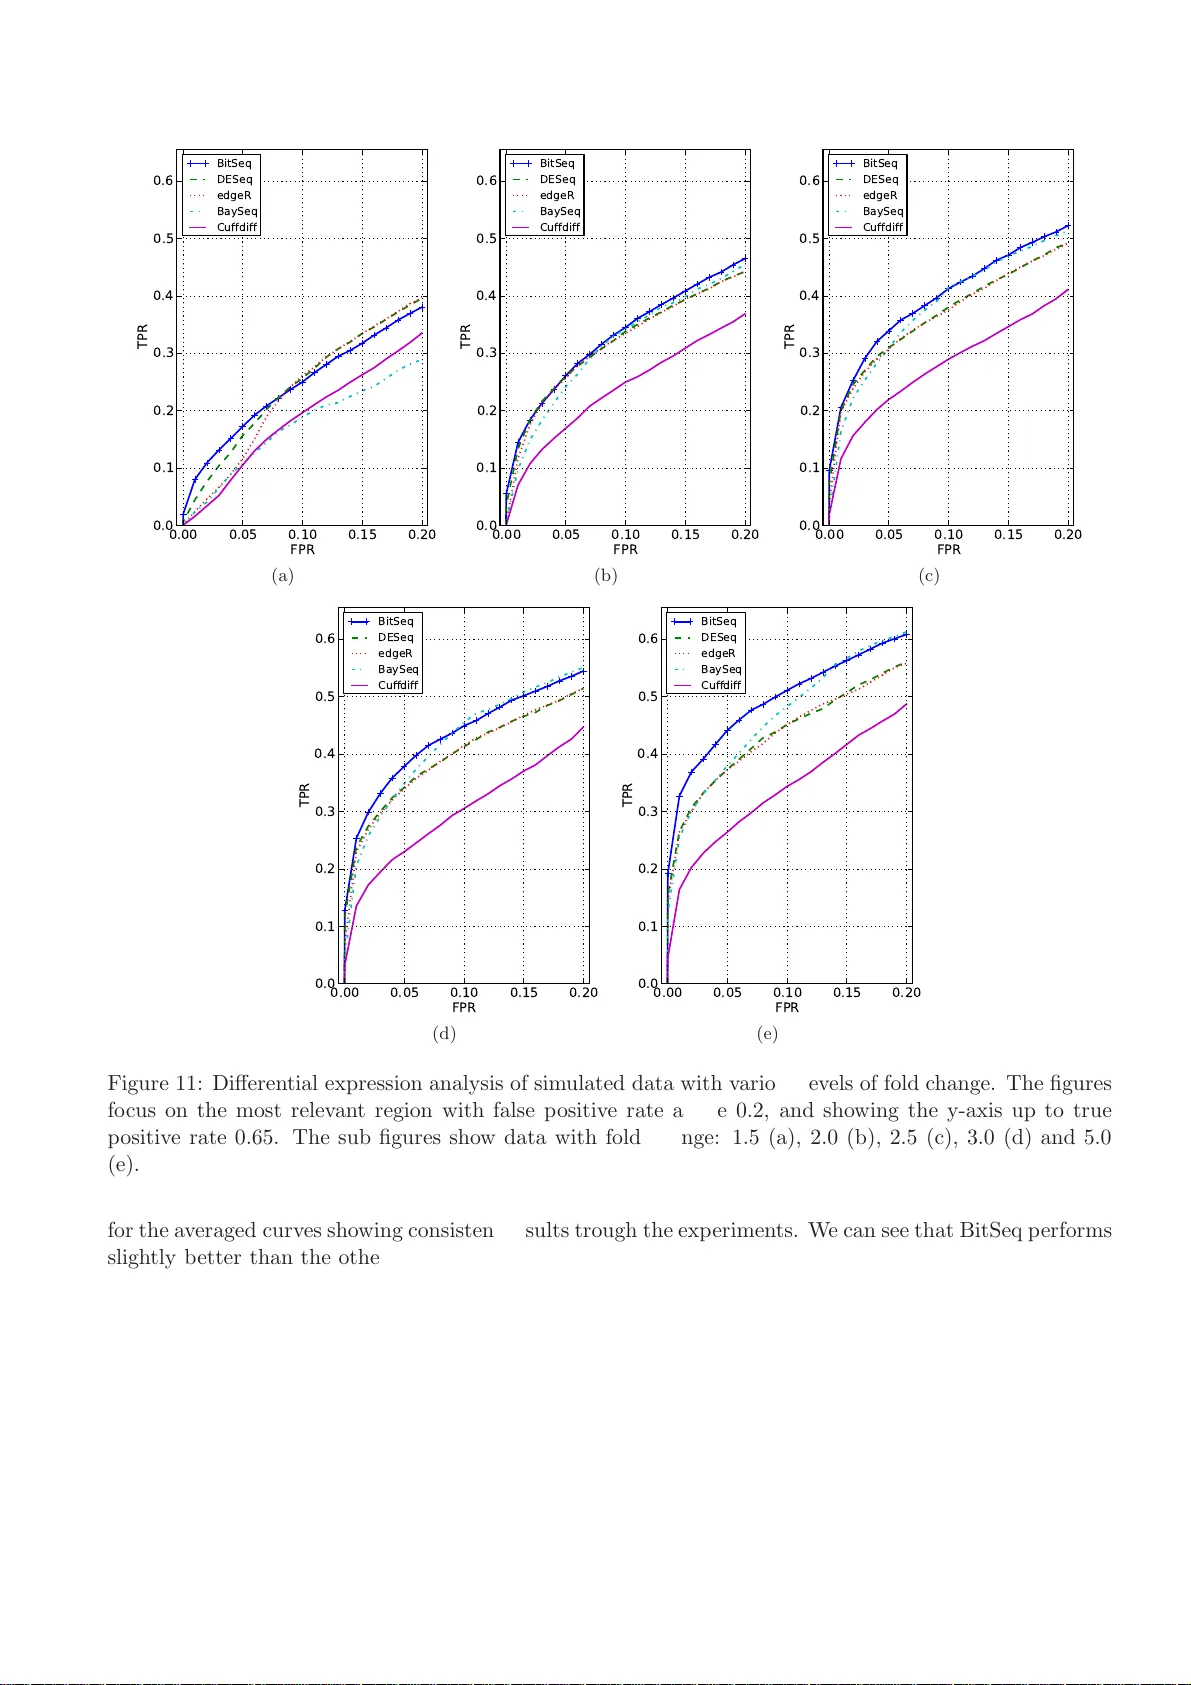
Iden tifying differen tially expressed transcripts from RNA-seq data wit h biological v ariation P eter Glaus 1 , ∗ , An tti Honk ela 2 , ∗ † and Magn us Rattray 3 , ∗ , † 1 School of Computer Science, Univ er sit y of Manc hester, Oxford Road, Manchester M13 9PL, UK 2 Helsinki Institute for Information T echnology HI IT, Depar t men t of Computer Science, Univ ersity of Helsinki, Helsinki, Finland 3 Department of Computer Science and Sheffield Institute of T rans lational Neuroscience, The Universit y of Sheffield, Sheffield S10 2HQ, UK No ve m b er 12, 2018 Abstract Motiv ation: High-throughput sequencing enables expres sion analysis at the level of individual transcripts. The a nalysis of transcriptome expressio n levels and differential expression estimation r e- quires a proba bilistic approach to pro perly account for ambiguity caused by s h ared exons and finite read sa mpling as well as the intrinsic biologica l v ar iance o f transcript expression. Results: W e present BitSeq (Bayesian Inference of T ra nscripts from Sequencing data), a Bayesian approach for estimation of trans cript ex pression level from RNA-seq experiments. Inferred relative expression is represented by Marko v c hain Mon te Carlo (MCMC) samples from the poster ior probabilit y distribution of a generative mo del of the read data. W e prop ose a nov el metho d for differential expr ession analysis across replicates which pr opagates uncertaint y fro m the sample-level mo del while mo delling biological v ariance using an expressio n-lev el-dep enden t prior. W e de m onstrate the adv antages of our metho d us ing sim ulated data as w ell a s an RNA-seq datas et with technical and biological replication for bo t h studied conditions. Av ailabilit y: The implement ation of t he transcriptome expression estimation and differe n tial ex- pression analysis, B it Seq, has bee n written in C++ . Con tact: glau s@cs.man.a c. uk , an tti.honkel a@hiit.fi , M.Rat tray@sheff i eld.ac.uk 1 In tro duction High-throughput sequencing is an effectiv e approac h for transcriptome analysis. This m e tho dolog y , also called RNA-seq, has b ee n us e d to analyse unkn o wn transcrip t sequences, estimate gene expression le v- els and study single n ucleotide p olymorphisms (W ang et al. , 2009). As sho wn by ot her researc h e rs (Mortaza vi et al. , 2008), RNA-seq p ro vides man y adv an tages o v er microarra y tec hnology , although ef- fectiv e analysis of RNA-seq data r e mains a c h a llenge. A fu ndamen tal task in the analysis of RNA-seq d a ta is the ident ification of a set of differen tially ex- pressed genes or trans c ripts. Results fr o m a d i fferen tial expression (DE) analysis of in dividual transcripts are essen tial in a div erse range of problems suc h a s iden tifying differences b et ween tissues (M ortaza vi et al. , 2008), und e rstanding d e v elopmenta l c h a nges (Gra vele y et al. , 2011) and regulator such as microRNA tar- get p redicti on (Xu et al. , 2010). T o carry out an effectiv e DE analysis it is imp ortan t to obtain accurate ∗ to whom corresp o ndence should b e addressed † These authors contributed eq uall y to this work. 1 ! " # $ # " " %& " " ' #( ) * + * , + , ' - . / 0 , , Figure 1: D iagram showing the BitSeq analysis p i p eline divided in to t wo separate stages. In Sta ge 1, transcript expression leve ls are estimated using reads from ind ivi dual sequencing exp erimen ts. In step 1, reads are alig ned to the transcriptome. In step 2, the probabilit y of a read originating from a giv en transcript P ( r n | I n ) is co m puted fo r eac h alignmen t based on Eq. (1 ) . These probabilities are used i n step 3 of the analysis, MCMC sampling fr o m th e p osterior d istribution in Eq. (3 ) . In Stage 2 of the analysis, the p osterior distributions o f transcript expression level s from m ultiple conditions and replicas are used to in fer the pr o b abilit y that transcrip t s are different ially expressed. In step 4, a s uita ble normalisation for e ac h exp erimen t is estimated. The normalised expression samples are fur ther u sed to infer expression-dep enden t v ariance h yp erparameters in step 5. Using these results, r e plicates are summarized by estimating th e p er- condition mean expression for eac h transcript, E q. (4 ) , in step 6. Finally , in step 7, samples repr ese n ting the distribution of within-condition expr e ssion are used to estimate the p robabilit y of positiv e log ratio (PPLR) b et wee n conditions, w hic h is used to rank transcrip ts based on DE b elief. estimates of exp ression f o r eac h sample but it is equally im portant to pr o p erly account for all sour c es of v ari- ation, tec hn ic al and biological, to a void spur io us DE c alls (Robinson and S m yth, 2007; Anders and Hub er, 2010; Oshlac k et al. , 201 0 ). In this contribution we address b o th of these problems b y dev eloping i n te- grated probabilistic m odels of the read generation pro cess and the biological replication pro cess in an RNA-seq exp erimen t. During the RNA-seq exp erimen tal pro cedure, a studied sp ecimen of transcriptome is synthesised into cDNA, amplified, fr a gmen ted and th e n sequenced by a high-throughp ut sequ e n cing device. This pr ocess results in a d a taset consisting of up to hundreds of millions of short sequen c es, or r e ads, enco ding observ ed n u cl eotide sequences. T he length of the reads dep ends on the sequencing platform and currently t ypically ranges fr om 25 to 300 b a s e pairs. Reads ha ve to b e either assem b le d into tr a nscript sequen c es or aligned to a reference genome by an aligning to o l, to determine the sequence they originate from. With pr o p er sample pr e paration, the num b er of reads aligning to a certain gene is app ro ximately prop ortional to the abundance of fragmen ts of transcripts for that gene within the sample (Mortaza vi et al. , 2008) allo wing researc hers to study gene expression (Clo onan et al. , 2008; Marioni et al. , 2008). Ho w ev er, during the pro cess of tr a n scription, most euk ary otic genes can b e spliced into d i fferen t transcripts which share parts of their s e quence. As it is the transcripts of genes that are b eing sequenced d uring RNA-seq, it is p ossible to distinguish b et ween individual transcripts of a gene. Several metho ds ha ve b een prop osed to estimate transcrip t expression lev els (Li et al. , 2010; Nicolae et al. , 2010; Katz et al. , 2010; T u rro et al. , 2011). F u rthermore, W ang et al. (2010) sho w ed that estimati ng gene expression as a sum of transcript expression leve ls yields more pr e cise results than inferring the gene expression by summing reads ov er all exons. Since the transcrip t of origin is undecidable for r e ads a ligning to shared subsequ e nce, estimatio n of transcript expression lev els has to b e completed in a probabilistic manner. Initial studies of transcript expression used the Exp ectatio n-Maximizatio n (EM) app roa c h (Li et al. , 2010; Nicolae et al. , 2010). Th is 2 is a maximum lik eliho od pro cedure whic h on l y provides a p oin t estimate of tr a n script abundance and do es not measure the uncertaint y in these estimates. T o o v ercome this limitatio n , Katz et al. (2010) used a Ba y esian app roa c h to captur e the p osterior distribu tio n of the transcrip t expression level s using a Marko v c hain Monte Carlo (MCMC) algorithm. T urro et al. (2011) ha ve also prop osed MCMC estimation for a mo del of read counts ov er r e gions that can corresp ond to exons or other suitable su bparts of tr a n scripts. In this con tribution w e presen t Bit Seq (Ba ye s i an Inference of T ranscripts from Sequencing data), a new metho d for inferring transcript exp ressio n and analysing expr e ssion c hanges b et wee n conditions. W e use a probabilistic m odel of th e read generation pro ce ss similar to th e mo del of Li et al. (2 010) and w e dev elop an MCMC algorithm for Bay esian in fe rence o ver the mo del. Katz et al. (201 0 ) dev elop ed an MCMC algorithm for a similar generativ e mo del bu t our mo del differs from theirs b ecause we allo w for m u lt i-aligned r ea d s mappin g to differen t ge nes. F urthermore, w e inf e r the o v erall relativ e expression of transcripts across the transcriptome whereas Katz et al. (2010) f ocus on relativ e expression of transcripts from the same gene. W e ha ve implemente d MCMC u sing a collapsed Gibbs sampler to sample fr o m th e p osterior d istribution of mo del parameters. In man y gene expression stud ie s expression leve ls are u sed to select genes w it h differences in expression in t w o conditions, a pro ce s s r e ferred t o as a DE analysis. W e prop ose a no ve l metho d for DE analysis that includes a mo del of biological v ariance while also allo wing f o r the technical uncertaint y of transcrip t expression which is represented b y samples from the p osterior p robabilit y distribu t ion obtained from the probabilistic mo del of read generatio n. By retaining the f ull p osterior distrib utio n, r a ther than a p oin t estimate s ummary , we can propagate uncertaint y from the in i tial read summ a rization stage of analysis in to the DE analysis. Similar strategies ha ve b een sho wn to b e effectiv e in the DE analysis of microarray data (Liu et al. , 2006; Rattra y et al. , 200 6) but giv en the in heren t un ce rtain ty of reads mapping to m ultiple transcrip t s w e exp ect t he approac h to brin g ev en more adv an tages for transcript- lev el DE analyses. F urth e rmore, th is m e tho d accounts for d e creased tec h nica l repro ducibilit y of RNA-seq for lo w-expressed tr a n scripts recent ly rep orted by Laba j et al. (2011) and can decrease the n u m b er of transcripts falsely id e n tified as different ially expressed. 2 Metho ds The BitSeq analysis p ipeline consists of tw o m a in stages: transcript expr e ssion estimation and d iffe ren tial expression assessment, see Figure 1. F or the transcrip t expression estimation the inp ut data are single-end or pair-end rea d s fr o m a single sequencing run. The m e tho d pro duces samples from the inferred probabilit y distribution o v er transcripts’ expr e ssion lev els. This distribu ti on can b e summarized by the sample mean in case one is only intereste d in expression. The DE analysis uses p osterior samples of expression lev els from t w o or more conditions and all a v ailable replicates. The cond it ions a re summarized by inferr i ng the p osterio r distribution of condition mean expression. Samples from the p osterior distr i butions are compared to score the transcripts based on the b elief in change of exp ressio n lev el b et ween conditions. 2.1 Stage 1: T ranscript expression es timation The initial in terest when dealing with RNA-seq d at a is estimation of expression lev els within a sample. In this w ork, we focus on the t ranscript expression le v els, mainly represen ted b y θ = ( θ 1 , . . . , θ M ), the relativ e abundance of transcrip ts’ fr a gmen ts within the studied sample, where M is the total n umber of transcripts. This can b e furth e r transform e d into relativ e expression of transcripts θ ( ∗ ) m = θ m / ( l m ( P M i =1 θ i /l i )), where l m is th e length of the m -th transcript. Alternativ ely , expression can b e repr ese n ted by r e ads p er kilob ase p er mil lion mapp e d r e ads , RP K M m = θ m × 10 9 /l m , int ro duced by Mortaza vi et al. (2008). W e use a generativ e mo del of the d a ta, depicted in Figure 2, whic h mod el s the RNA-seq data as indep enden t observ ations of in dividual r e ads r n ∈ R = { r 1 , . . . , r N } , dep ending on the relativ e abundan c e 3 θ I n r n N Z n act θ act Figure 2: Graphical represent ation of the RNA-seq data probabilistic mo del. W e can consider the observ ation of reads R = ( r 1 , . . . , r N ) as N conditionally ind e p enden t ev en ts, with eac h observ ation of a read r n dep ending on the transcript (or isoform) it originated from I n . The probabilit y o f sequen c ing a giv en transcript I n dep ends on the relativ e exp ression of fragmen ts θ and the n o ise indicator Z act n . The noise indicator v ariable Z act n dep ends on noise parameter θ act , and indicates that the transcript b eing sequenced is regarded as n oi se, whic h enables observ ation of lo w qualit y and u n-mappable reads. of transcripts’ fragmen ts θ and a noise parameter θ act . The parameter θ act determines the n u m b er of rea ds regarded as noise and enables the mo del to accoun t f o r unm a pp ed r e ads as well as for lo w-qualit y reads within a sample. Based on the parameter θ act , indicator v ariable Z act n ∼ Bern( θ act ) determines whether read r n is considered as noise or a v alid sequence. F or a v alid sequence, the pro cess of s e quencing is b eing mo delled. Under the assumption of reads b eing uniformly s e quenced f rom the m o lecule fragments, eac h read is assigned to a transcript of origin by the indicator v ariable I n , which is giv en b y categorica l distribution I n ∼ Cat ( θ ). F or a trans c ript m we can express the probabilit y of an observed alignmen t as th e prob a b ili t y of c ho osing a sp ecific p osition p an d sequencing a sequence of giv en length w i th all its m i smatc hes, P ( r n | I n = m ) = P ( p | m ) P ( r n | seq mp ). F or paired-end reads we compute the join t probabilit y of the alignmen t of a whole pair, in wh i c h case we also hav e to consider f rag men t length distribu ti on P ( l ), P ( r (1) n , r (2) n | I n = m ) = P ( p | l, m ) P ( l | m ) P ( r (1) n | seq mlp 1 ) P ( r (2) n | seq mlp 2 ) . (1) Details of alignment probabilit y computation in c luding optional p osition and sequence-sp ecific bias cor- rection m e tho ds are pr e sen ted in Supp le men tary Material. F or ev ery aligned read, we also calculate the probabilit y that the r e ad is from neither of the aligned trans c ripts, but is r e garded as sequencing error or noise P ( r n | noise). Th i s v alue is calculated by taking the probabilit y of the least pr o bable v alid alignmen t corrupted with tw o extra b a s e mismatc hes. The join t probabilit y distribu ti on of the mo del can n o w b e written as P ( R, I , Z act , θ , θ act ) = P ( θ ) P ( θ act ) × Q N n =1 P ( r n | I n ) P ( I n | θ , Z act n ) P ( Z act n | θ act ) , (2) where w e u se w eak conjugate Diric hlet and Beta pr io r d istributions for θ and θ act , resp ec tiv ely . The p osterior d i stribution of the mo del’s p a rameters giv en the data R can b e simp lified by inte grating o v er all p ossible v alues of Z act : P ( I , θ , θ act | R ) ∝ P ( θ ) P ( θ act ) Q n ; I n 6 =0 P ( r n | I n )Cat( I n | θ ) θ act × Q n ; I n =0 P ( r n | noise)(1 − θ act ) . (3) According to th e mo del an y read can b e a result of sequen c ing either strand of an arbitrary transcript at a rand o m p osition. Ho wev er, the probabilit y of a read originating from a lo cation where it do es not align is n eg ligible. T h us the term P ( r n | I n )Cat( I n | θ ) θ act has to b e ev aluated only for transcripts and p ositions to wh i c h the read do es align. T o accomplish this we fi rst align the reads to th e trans c ript sequences us i ng the Bo wtie alig nment to ol (Langmead et al. , 200 9), preservin g p ossible m ultiple ali gnmen ts to differen t transcripts. W e then pre-compute P ( r n | I n ) only for the v alid alignments. (See steps 1-2 in Figure 1.) 4 The closed form of the p osterior d ist ribution is n o t analytical ly tractable and an approxi mation has to b e u sed. W e can analytically m a rginalise θ and apply a collapsed Gibbs sampler to pro duce samp le s from the p osterior probabilit y distribution o ver I n (Geman and Geman, 1993; Griffiths and Steyve rs, 2004). These are used to compute a p osterior for θ , wh ic h is the main v ariable of int erest. F ull up date equ a tions for the sampler are give n in S upplemen tary Material. In the MCMC appr o ac h, m ultiple chains are sampled at the same time and con verge n ce is monitored using th e b R statistic as describ ed by Gelman et al. (2 003). The b R sta tistic is an estimate of a p ossible scale reduction of the marginal p osterior v ariance and provi des a measure of usefulness of pro ducing more samples. P osterior samples of θ provide an a s se ssmen t of the abundance of individual transcripts. As w ell a s provi ding an accurate p oin t estimate of the expr essio n lev els through the mean of the p osterior, the p robabilit y d istribution pro v i des a measure of confid ence for the results, which can b e used in f urther analyses. 2.2 Stage 2: Com bining data from m ultiple replicates and estimating differen tial expression T o ident ify transcripts th a t are truly differentia lly expr e ssed it is necessary to account for biological v ariation b y using replication for eac h experimental condition. Our metho d summarizes th e se replicates b y estimating the biolo gical v ariance and inferring p er-condition mean expression lev els for e ac h transcript. During the differentia l expression analysis we consider the logarithm of transcrip t expression lev els y m = log θ m . The mo del for d a ta originating fr o m multiple replicates is illustrated in Figure 3. W e u se a hierarc h i cal log-normal mo del of within-condition expr e ssion. The p rior o v er the b io logica l v ariance is dep enden t on the mean expr e ssion leve l across conditions and the prior parameters (h yp er-parameters) are learned from all of th e data by fitting a n o n-parametric r e gression mo del. W e fit a mo del for eac h gene using the expression estimates from Stage 1. A nov el asp ect of our S ta ge 2 app roa c h is that we fit mo dels to p osterior samp l es obtained f rom the MCMC sim ulation from Stage 1, whic h c an be considered “pseudo-data” represen ting expression corrupted b y tec h nica l noise. A pseudo-data v ector in constructed using a single MCMC sample f o r eac h r e plicate across all conditions. Th e p osterior distribution o ve r p er-condition means is inferred for eac h pseud o- data v ector using the mo del in Figure 3 (describ ed b elo w). W e th e n use Ba yesia n mo del-a v eraging to com b i ne the evidence from eac h pseudo-data vecto r and determine th e p robabilit y of d iffe ren tial expression. This approac h a llows us to account for t he in trinsic tec hnical v ariance in the d a ta; it is also compu t ationally tractable b ecause the mod el for a s i ngle pseudo-data v ector is conjugate and therefore inferen c e can b e carried out exactly . This effectiv ely regularize s our v ariance estimate in the case that the num b er of replicates is lo w. As sho wn in Section 3.5 this pro vides impro ved con trol of error rate s for w eakly expressed transcripts where the technical v ariance is large. F or a condition c we assume R c replicate datasets. The log- expression from replicate r , y ( cr ) m is assumed to b e distribu t ed according to a normal distribu tio n with cond i tion mean exp ressio n µ ( c ) m , norm a lised by replication sp ecific constant n ( cr ) , and precision λ ( c ) m , y ( cr ) m ∼ Norm( µ ( c ) m + n ( cr ) , 1 /λ ( c ) m ). As our parameters represent the relativ e expression lev els in the sample, BitSeq implicitly incorp orates normalisation b y th e total num b er of r e ads or th e RPKM measur e , as w as done when generating the resu l ts in th i s p ublicati on. F u rther n o rmalisation can b e implemen ted u sing the normalisation constant n ( cr ) , w hic h is c onstan t for all transcripts of a given replicate and can b e estimated prior to probabilistic mo deling usin g , for examp l e, a quant ile based metho d (Robins o n and Oshlac k, 2010) or any other suitable tec hn ique. The condition mean expression is normally distribu te d µ ( c ) m ∼ Norm( µ (0) m , 1 / ( λ ( c ) m λ 0 )) with mean µ (0) m , whic h is empirically calculated from multi ple samples, and scaled pr ec ision λ ( c ) m λ 0 . T he p rior distribu t ion o ve r p er-transcript, co ndition specific precision λ ( c ) m is a Gamma d ist ribution with h yp erparameters α G , β G , whic h are fixed for a group of tr a n scripts with similar expression lev el, G . 5 n (cr) λ 0 R c C M α G β G R c C λ m (c) μ m (c) μ m (0) y m (cr) Figure 3: Graph ic al model o f the biological v ariance in tr a nscript exp ressio n experim e n t. F or r e plicate r , condition c and tr a n script m , the observ ed log-expression lev el y ( cr ) m is normally distributed around the normalised condition mean expression µ ( c ) m + n ( cr ) with biologic al v ariance 1 /λ ( c ) m . The condition mean expression µ ( c ) m for eac h condition is normally distribu te d with o verall m e an exp ression µ (0) m and scaled v ariance 1 / ( λ ( c ) m λ 0 ). The inv erse v ariance, or p reci sion λ ( c ) m , for a giv en transcr i pt m follo ws a Gamma distribution with expression-dep enden t hyp erparameters α G , β G , whic h are constant f o r a group of transcripts G w i th similar expression. The hyp erparameters α G , β G determine the distribution o v er p er-transcript precision paramet er λ m whic h v aries with the expr essio n level of a transcript (see Sup pleme n tary Figure 3 of the supplementa ry material). F or this reason, we inferred these hyp erparameters from the d at aset for v arious lev els of expres- sion, prior to the estimation of precision λ m and mean exp ression µ m . W e u se d the s a me mo del as Figure 3 applied join tly to m u lt iple transcripts with similar empirical mean expression leve ls µ (0) m . W e s e t a u ni- form pr io r for the hyp erparameters, marginalized out condition means and precision, and u sed a MCMC algorithm to sample α G , β G . The samples o f α G , β G w ere smo othed b y Lo wess regression (Clev eland, 1981) against empirical m e an expression to p rodu c e a single pai r o f h yp erparameters for eac h group of transcripts with similar expression leve l. This mo del is conjugate and th u s leads to a clo sed fo rm p osterior distribu t ion. T his allo ws us to directly sample λ m and µ m giv en eac h pseudo-data ve ctor y m constructed from the Stage 1 MCMC samples: P ( µ m , λ m | y m ) = Q C c =1 Gamma( λ ( c ) m | a c , 1 /b c ) Norm µ ( c ) m µ (0) m λ 0 + P R c r =1 ( y ( cr ) m − n ( cr ) ) λ 0 + R c , 1 λ ( c ) m ( λ 0 + R c ) , (4) a c = α G + R c 2 , b c = β G + 1 2 ( µ (0) m ) 2 λ 0 + + P R c r =1 y ( cr ) m − n ( cr ) 2 − µ (0) m λ 0 + P R c r =1 y ( cr ) m − n ( cr ) 2 λ 0 + R c ! . Samples of µ ( c 1 ) m and µ ( c 2 ) m are used to compu te the pr o b abilit y of expression lev el of transcript m in condition c 1 b eing greater than the expr e ssion lev el in condition c 2 . This is done b y counting the fraction of samples in whic h the mean expression from the first condition is greater, that is P ( µ ( c 1 ) m > µ ( c 2 ) m | R ) = 1 N P N n =1 δ ( µ ( c 1 ) m,n > µ ( c 2 ) m,n ) which w e refer to as the Probabilit y of Po sitiv e Log-Rati o (PPLR). Here, n = 1 . . . N represents one s a m ple from the ab o ve p osterior distribution for eac h of N indep endent pseudo-data v ectors. Su bsequen tly , ord e ring transcripts based on P PLR pro duces a r a nking of most probable up-regulated and do wn-regulated transcripts. This kind of one-sided Ba y esian test has previously b een used f o r the analysis of microarray data (Liu et al. , 2006). 6 (a) A n ti-correlation of transcripts. (b) No observ able correla- tion. (c) Posterior distribution of expression level s for eac h transcript. Figure 4: In p lo ts (a) and (b) w e sho w the p osterior transcript expr e ssion densit y for pairs of transcripts from the s a me ge ne. This is a densit y map constructed using the MCMC expression samples for these three transcripts. In (c) we sho w th e marginal p osterior distribution of expression lev els of the same trans c ripts as illustrated by histograms of MCMC samp l es. The s e quencing d at a is from miRNA-155 stud y published b y Xu et al. (2010). 3 Results and Discussion 3.1 Datasets W e carried out exp erimen ts ev aluating b oth gene expression estimatio n accuracy as we ll as differen tial expression analysis precision. F or the ev aluation of bias correction effects as w ell as comparison with other metho ds (T able 1) we used paired-end RNA-seq data from the Microarra y Qualit y Con trol (MAQC) pro ject (Shi et al. , 2006) (Short Read Archiv e accession num b er SRA012427 ), b ecause it cont ains 907 transcripts whic h w ere also analysed b y T aqMan qR T-PC R. The r esults fr o m qR T-PCR prob es are generally re- garded as groun d truth expression estimates for comparison of RNA-seq analysis metho ds (Rob erts et al. , 2011). W e used RefSeq refGene tr a nscriptome annotation, assembly NCBI36/hg18 in order to ke ep results consisten t with qR T-PCR data as w ell as previously pub lished comparisons by Rob erts et al. (2011). The second dataset used in our ev aluation was originally pub l ished by Xu et al. (201 0) in a stud y fo cused on id e n tification of microRNA ta rgets and pro vides tec hnical as well as b io logical replicates for b oth studied conditions. W e u se this d a ta to illustrate th e imp o rtance of biologica l replicates for DE analysis (Figure 5, Supp le men tary Figure 3 f o r biological v ariance) and the adv anta ges of u sing a Ba yesia n approac h for b oth exp ressio n inference and DE analysis (Figure 4). F or the purp ose of ev aluating and comparing BitSeq t o existing differen tial expression analysis metho ds, w e crea ted artificia l RNA-seq datasets with kn o wn expression leve ls and differentiall y expressed tr a n scripts. W e selected all trans c ripts of chromosome 1 from human genome assem bly NCBI37/hg19 and simulate d t wo biologica l replicates for eac h of th e t w o conditions. W e initially sample th e expression for all replicates using the same m e an r e lativ e expression and v ariation b et ween replicates as were observ ed in the Xu et al. data estimates. Afterwa rds we randomly c ho o se one third of the transcrip ts a n d shift one of the conditions up or down b y a kno wn fold c hange. Give n th e adjusted expression lev els, we generated 300k single-end reads uniformly distributed along the transcripts. The reads w ere rep orted in F astq format with Phred scores rand omly generate d according to empirical distribution learned f rom the SRA012427 dataset. With the error pr o babilit y given by a Ph red score, we generated base mismatc hes along th e reads. 3.2 Expression lev el inference Figure 4 demonstrates the am b i guit y that may b e presen t in the pro cess of expr e ssion estimation. In Figures 4 (a ) and 4(b) we sh o w the densit y of samples from the p osterior distr ibution of expression lev els for t wo pairs of t ranscripts. The expression lev els of transcrip t s u c 010oho.1 and u c0 10ohp.1 (F ig. 4 (a)) 7 read mo del BitSeq Cufflinks RSEM MMSEQ uniform 0.7677 0.7503 0.7632 0.7 614 non-uniform 0.8011 0.8056 0.7633 — T able 1: C o mparison of expr e ssion estimation accuracy against T aqMan qR T-PCR d a ta and the ef- fect of non-uniform read distribution mo dels using co r rela tion coefficien t R 2 of a v erage expression from three tec hnical replicates with the 893 matc hin g transcr i pts analysed by qR T-PCR. The sequencing data (SRA01242 7) is part of the MAQC p ro ject and was originally p ublished by Shi et al. (2006). are negativ ely correlat ed. On the other hand transcripts uc010oho.1 and uc001b wm.3 exhibit n o visible correlation (Fig. 4 (b)) in th e ir expression leve l estimates. Ev en though this kind of correlation does not ha ve to imply biological significance, it d oes p oin t to tec h nical diffi c ulties in the estimation pro cess. These transcripts share a significant amount of sequence and the consequent read mapping am biguity leads to greater un ce rtain ty in expression estimates (See S upplemen tary Figure 1(d) for transcript pr o fi le ). Ba y esian inference can b e us e d to assess the uncertain t y due to suc h confoun ding factors, unlike th e maxim um lik eliho od p oin t estimates p ro vided by an EM algorithm. T he marginal p osterior p robabilit y of tran sc ript expr e ssion for eac h transcript is sho w n in Figure 4(c). In our analysis pip eline, the marginal p osterior distribu t ions are p ropaga ted into the differen tial expression estimation stage, th us the uncertain t y from expression estimation is tak en in to accoun t when assessing wh et her there is strong evidence that transcripts are differential ly expr e ssed. 3.3 Expression estimation accuracy and read distribution bias correction Initially , it was assumed that high-thr o u ghput sequencing pr oduces r e ads un iformly d istributed along transcripts. How ev er, more recent studies sho w biases in the read distrib utio n dep ending on the p osition and surroun ding sequence (Do h m et al. , 20 08; W u et al. , 2011; Ro b erts et al. , 2 011). Our generativ e mo del for transcript expression inference (Figure 2) includes a m odel of the und erlying read distribution w hic h in the P ( r n | I n = m ) term that is calculated as a p re-processing step. The current BitSeq imp le men tation con tains the option of us i ng a un iform read d e nsit y mo del or using the mo del p roposed by R o b erts et al. (2011) whic h c an account for p ositional and sequence bias. The effect of co r rect ing for read d i stribution was analysed u sing the S RA0 12427 dataset and r e sults are presented in T able 1. W e also compare BitSeq w it h three other transcript expression estimatio n metho ds: Cufflinks v0.9.3 (Rob erts et al. , 2011), MMSEQ v0.9.18 (T urro et al. , 2011) and RSEM v1.1.14 (Li and Dewe y, 2011). The d at aset cont ains thr e e tec hn ic al replicates. These w ere analysed separately and the resulting estimates for eac h metho d we re a v eraged together. Sub sequen tly , we calculated the squ a red Pearson correlation co e fficien t ( R 2 ) of the a verag e expression estimate and th e resu lt s of qR T-PCR analysis. All four metho ds used with th e default uniform read d istribution mo del pr o vide s i milar lev el of accuracy with BitSeq p erforming sligh tly b etter than the other three metho ds. Both BitSeq and Cufflinks use the same method for read distr ibution b ia s correction and pro vide impro v ement ov er the uniform mo del similar to improv emen ts previously rep orted b y Rob erts et al. (2011). W e used v ersion 0.9.3 of Cu fflinks (as us e d b y Rob erts et al. ) since we foun d that the most recen t stable v ersion of Cufflin ks (v ers i on 1.3.0) leads to muc h worse p erformance for b oth uniform and bias-corrected mo dels (see Sup plemen tary results Section 2.2). The RSEM pac k age u ses its o wn metho d for bias correction based on the relativ e p osition of fragments, which in th i s case did not improv e the expression estimation accuracy for the selected transcrip t s. W e we r e not able to compare the bias corrected results of MMSEQ (T urro et al. , 2011) due to an error in an external R p ac k age mseq used for the bias correction. Ho w ever, the bias correctio n of mseq pac k age itself was already compared against Cufflin ks on the same dataset sho w i ng sligh tly w orse accuracy and less imp ro v ement (Rob erts et al. , 2011). 8 (a) (b) (c) (d) Figure 5: Comparison of BitSeq to naive approac h for combining replicates with i n a condition for tr a n - script u c0 01a vk.2 of the Xu et al. dataset. (a) Initial p osterior distributions of trans c ript expression lev els for t wo conditions (lab e led C0, C1), with t wo biolog ical r e plicates eac h (lab eled R0, R1). (b) Mean expr e s- sion lev el for eac h condition u sing the naiv e app roac h for com bin ing replicate s. The p osterior distributions from replicates are joined into one d a taset for eac h condition. (c) Inferred p osterior distr i bution of mean expression lev el for eac h condition u sing the probabilistic mod e l in Fig ure 3. (d) Distribu ti on of differences b et w een conditions from b oth appr o ac hes show that the naiv e ap proac h leads to ov erconfiden t conclusion. In case o f BitSeq, the ma jor impro v ement of accuracy originate s from using the effec tiv e length normal- ization. T o compare the resu lt s w it h qR T-PC R, the relativ e expression of fragmen ts θ h a s to b e con verte d in to either r e lativ e exp ressio n of transcripts ( θ ∗ ) or RPK M units. Using th e bias corrected effectiv e length for this con version leads to the h ig her correlation with qR T-PCR (Supplementary T able 1). T his means that using an expression measure adju ste d b y the effectiv e length, suc h as RPKM, is more suitable than normalized read count s for DE analysis. F or more results comparing the transcrip t expression estimation accuracy and within gene relativ e expression accuracy , please refer to supp le men tary material Section 2.3. 3.4 Differen tial expression analysi s W e use the Xu e t al. dataset to demonstrate the DE analysis pro c ess of BitSeq. This dataset c on tains tec hnical and biologica l replication for b oth studied conditions. W e obs e rv ed significan t difference b et w een biologica l and tec hnical v ariance of exp ression estimates (S upplemen tary Figure 3). F urthermore, the prominence of biological v ariance increases with transcript expression lev el. W e illustrate ho w BitSeq handles biological replicates to accoun t for this v ariance in Figure 5, by sh o wing the mo delling pro cess for one example transcript give n only tw o b io logica l replicates for eac h of tw o conditions. Figure 5(a) sh o ws histograms of expression le vel samples pr oduced in the fi rst stage of our pip eli ne. BitSeq p robabilistic ally infers condition mean expression leve ls using all rep l icates. F or comparison, we used a n ai v e w ay of combining tw o replicates by combining the p osterior distributions of expression in to a single distribution. The resu lt ing p osterior d i stributions for b oth approac h e s are d e p ict ed in Figures 5(b) and 5(c). The probabilit y of differen tial expression for eac h transcript is assessed by compu t ing the difference in p osterior expr essio n distrib utio ns of the tw o conditions. Resulting d istributions of differences for b oth approac hes are p ortra ye d in Figure 5(d) with ob vious difference in the lev el of confid e n ce . The naiv e approac h r e p orts high confidence of u p-reg ulation in the second condition, with the p robabilit y of p ositiv e log ratio (PPLR) b eing 0 . 995. When biological v ariance is b eing c onsidered b y inferring the condition mean expression, the s i gnificance of differentia l expression is d ec reased to PPLR 0 . 836. 9 0.00 0.05 0.10 0.15 0.20 FPR 0.0 0.2 0.4 0.6 0.8 1.0 TPR BitSeq DESeq edgeR BaySeq Cuffdiff (a) 0.00 0.05 0.10 0.15 0.20 FPR 0.0 0.2 0.4 0.6 0.8 1.0 TPR BitSeq DESeq edgeR BaySeq Cuffdiff (b) 0.00 0.05 0.10 0.15 0.20 FPR 0.0 0.2 0.4 0.6 0.8 1.0 TPR BitSeq DESeq edgeR BaySeq Cuffdiff (c) 0.00 0.05 0.10 0.15 0.20 FPR 0.0 0.2 0.4 0.6 0.8 1.0 TPR BitSeq DESeq edgeR BaySeq Cuffdiff (d) Figure 6: R OC ev aluation of transcript lev el DE analysis using artificial dataset, comparing BitSeq with alternativ e app roa c hes. The curve s are av eraged o ver 5 runs with d iffe ren t set of transcripts b eing d iffe r - en tially expr e ssed b y fold change uniformly distrib uted in th e interv al (1 . 5 , 3 . 5). W e discarded transcrip t s without any r e ads in it ially generated as these provi de n o signal. P anel (a) s ho ws global a verage b eha viour while in (b), (c) and (d) transcripts w ere divided into 3 e qually sized groups based on the logged mean generativ e read count : [0 , 1 . 061), [1 . 061 , 2 . 940) , [2 . 940 , ∞ ), resp ectiv ely . 3.5 Assessing DE p erformance with simula ted data Using artificially simula ted d a ta with a pr e defined set of differenti ally expressed transcripts, w e ev aluated our approac h and compared it w it h four other metho ds commonly used for different ial expression analysis. DESeq (Anders and Hu ber, 2010), edgeR (Robinson et al. , 2010), ba ySeq (Hardcastle and Kelly, 2010) w ere d esig ned to op erate on th e gene lev el and Cuffd i ff (T rapnell et al. , 2010) on the transcript lev el. Despite not b eing designed for this p urp ose , w e consider the fir st th ree in this comparison as the use case is very similar and there are no other w ell kn o wn alternativ es b esides C uffdiff that w ould us e replica tes for transcript lev el DE analysis. All other metho ds b eside Cu ffdiff u se BitSeq Stage 1 trans c ript exp ression estimates conv erted to coun ts. Details regarding us e of these m e tho ds are provided in the Supp l emen tary material, Section 2.5. Figure 6 sho ws the ov erall results as w ell as split in to three parts based on the expression of the transcripts. The ROC c urve s w ere generated b y a v eraging o ver 5 runs with different transcripts b eing differen tially expr e ssed and the figur e s are fo cused on the most significant DE calls with false p ositiv e r a te b elo w 0 . 2. Ov erall (Figure 6(a)), BitSeq is the most accurate metho d, follo w ed fi rst by baySeq, then edgeR and DESeq with Cuffdiff fur t her b ehind. This tren d is esp ecially clear for low er expression lev els (Figure 6(b), 6(c)). The o veral l p erformance here is fairly lo w b ecause of high leve l of b i ologic al v ariance. F or highest expressed transcripts (Figure 6(d)), DESeq and ed g eR sho w slightl y higher true p ositiv e rate than BitSeq and baySeq, esp ecially at larger false p ositiv e rates. F urther d e tails and m o r e results from the DE analysis comparison can b e foun d in the sup plemen tary m a terial Section 2.5. 4 Conclusion W e h a v e present ed metho ds for transcript expression lev el analysis and differentia l exp ression analysis that aim to mo del th e un ce rtain ty present in RNA-seq datasets. W e used a Bay esian approac h to pr o vide a probabilistic mod e l of transcriptome sequencing and to samp le from the p osterior distribu ti on o f the transcript expr e ssion lev els. The m odel incorp orates read and alignmen t qu a lit y , adjusts for non-unif o r m read distributions and accoun ts for exp erimen t-sp ecific f rag m e n t length distribution in case of paired-end 10 reads. The accuracy of inferred expression is comparable and in s o me cases o utp erforms other comp e t- ing metho ds. Nev ertheless, the ma jor b enefit of using BitSeq for transcript expression inference is the a v ailabilit y of full p osterior d ist ributions useful for fur ther analysis. The inferr e d distributions of transcr i pt expression lev els can b e f urther analysed by the second stage of BitSeq for DE analysis. Giv en biological r e p lic ates, BitSeq accoun ts f o r the intrinsic noise and v ariation and pro duces more reliable estimates of expression lev els within eac h condition, thus pro vid i ng few er f a lse differen tial expression calls. W e wan t to highlight th a t in order to m a k e m o st accurate d i fferen tial expres- sion assessment , exp erimen tal d e sign m ust include biologica l replication. BitSeq is capable of combining information from multiple biological a nd te chnical replicas and co mparing m ultiple conditions. F urther studies including m u lti ple replicates are n e cessary to inv estigate the effects of library preparation an d biologica l v ariance. Ac kno wledgemen t F unding : This work was supp orted un der the Eu ropean ERASysBio+ initiativ e pro j e ct SYNER GY b y the Biotec hnology and Biologic al Sciences Research Council [BB/I00476 9/2 to M.R.] and the Academ y of Finland [135311 to A.H.]; b y the Academ y of Finland [121179 to A.H.]; and the IST Pr o gramme of the Europ ean Communit y , under th e P ASCAL2 Net w ork of Excellence [IST-2007-2168 86]. T his publication only reflects the authors’ views. References Anders, S. and Hub er, W. (201 0). Differen tial expressio n analysis for se quence count data. Genome Biol , 11 (10 ) , R106. Cleveland, W. S. (19 81). LOWESS: A Pr ogram for Smo othing Scatterplots by Robust Lo cally Weigh ted Reg ression. Am S tat , 35 (1). Clo onan, N. et al. (200 8). Stem cell tr anscriptome profiling via massive-scale mRNA sequencing. Nat Metho ds , 5 (7), 613–9 . Dohm, J. C., Lo t taz, C., Bor odina, T., and Himmelbauer, H. (2008). Substantial biases in ultra -short read data sets from high-throughput DNA sequencing. Nucleic A cids R es , 36 (16), e105. Gelman, A., Carlin, J. B ., Stern, H. S., and Rubin, D. B. (20 03). Bayesian Data Analysis . Chapman and Hall/CRC, 2 e dit ion. Geman, S. and Geman, D. (19 93). Sto ch astic relaxa t ion, Gibbs distributions and the Bayesian restoratio n of image. J Appl St a t , 20 , 25–62 . Grav eley , B. R. et al. (2011). The developmen tal tra nscriptome of Dro sophila melanogas t er. N a tur e , 471 (733 9), 473–4 79. Griffiths, T. L. and Steyvers, M. (2004). Finding scientific topics. Pr o c Natl A c ad Sci USA , 101 Suppl , 522 8–35. Hardcastle, T. J. and K elly , K. A. (20 10). baySeq: Empiric al Bay esian Metho ds F or Identifying Differential Expres- sion In Sequence Count Data. BMC Bioinformatics , 11 (1), 422 . Katz, Y., W ang, E. T., Airoldi, E. M., and Burge, C. B. (201 0). Analysis and desig n of RNA sequencing exp erimen ts for iden tifying isoform regulatio n. Nat Metho ds , 7 , 1009– 1015. Laba j, P . P ., Leparc , G. G., Linggi, B. E., Ma rkillie, L. M., Wiley , H. S., and Kr eil, D. P . (2 011). Char acterization and improv ement of RNA-Seq pr ecision in q u antitativ e tr anscript expressio n profiling . Bioinforma tics , 27 (13), i383–i3 91. 11 Langmead, B ., T rapnell, C., Pop, M., and Salzb erg, S. L. (20 09). Ultr afast a nd memo ry-efficien t alig nm ent of sho rt DNA sequences to the h uma n genome. Genome Biol , 10 (3), R25. Li, B . and Dew ey , C. N. (2011). RSEM: accurate transcr ipt quantification from RNA-Seq data with or without a reference genome. BM C Bioinformatics , 12 , 32 3. Li, B., Ruotti, V., Stewart, R. M., Thomson, J . A., and Dew ey , C. N. (2010). RNA -Seq gene expressio n estimation with read mapping uncertaint y . Bio informatics , 26 (4 ) , 49 3–500. Liu, X., Milo, M., Lawrence, N. D., and Rattray , M. (2006 ). P robe-level measur emen t error improv e s a ccuracy in detecting differential gene expressio n. Bioinformatics , 22 (17 ), 2 107–13. Marioni, J. C., Mason, C. E ., Mane, S. M., Stephens, M., and Gilad, Y. (2008). RNA-seq: an assessment of technical repro ducibilit y and compa rison with gene ex pression arrays. Genome Res , 18 (9), 150 9–17. Mortazavi, A., Williams, B. A., McCue, K., Sc hae ff e r, L., and W old, B. (2008). Mapping and quantifying ma m malian transcriptomes by RNA-Seq. Nat Metho ds , 5 (7), 621–8 . Nicolae, M., Mangul, S., M, I., and Zeliko vsky , A. (2010). Estimation of alterna tiv e splicing isofor m frequencies from RNA-Seq data. In Pr o c. 10th Int l Conf. on Algori thms in Bioinformatics , pag es 202–2 14. Springer- V erla g. Oshlack, A., Robinson, M. D., and Y oung, M. D. (2010). F r om RNA-seq reads to differential express ion results. Genome Biol , 11 (12), 220 . Rattray , M., Liu, X., Sanguinetti, G., Milo, M., and Lawrence, N. D. (2 006). Propa gating uncertain ty in microar ra y data analysis. Bri ef Bioinform , 7 (1), 37–4 7. Rob erts, A., T rapnell, C., Donaghey , J ., Rinn, J . L., and Pach ter, L. (2 011). Improving RNA-Seq expression estimates by corr ecting for frag men t bias. Genome Biol , 12 (3), R22. Robinson, M. D. and Oshlack, A. (2010). A sca ling nor malization metho d for differential expression ana lysis of RNA-seq data. Ge nome Biol , 11 (3), R25. Robinson, M. D. a nd Smyth, G. K. (2007 ). Modera ted statistical tests for a ssessing differences in tag a bun dance. Bioinfo rmatics , 23 (21), 2 881–2887 . Robinson, M. D., McCarth y , D. J ., and Sm yth, G. K . (2010). edgeR: a Bio conductor pack age for differ en tial expression analysis of digital gene expressio n data. Bioi n f ormatics , 26 (1), 1 39–40. Shi, L. et al. (2006). The MicroArray Q ualit y Control (MAQC) pro ject shows inter- and in tr aplatform repro ducibility of gene expression measurements. Nat Biote chnol , 24 (9), 1 151–61. T rapnell, C. et al. (201 0). T ranscr ipt assembly and quantification by RNA-Seq reveals unanno tated tra n scripts and isoform switching during cell differentiation. Nat Biote chnol , 28 (5), 516–5 20. T urro , E. et al. (2011). Haplo t yp e and isofor m sp ecific expressio n e stimation using multi-mapping RNA-seq rea ds. Genome Biol , 12 (2), R13 . W ang, X., W u, Z ., a nd Zhang , X. (2010). Isofor m abundance inference provides a more accur ate estimation of gene expression levels in RNA-seq. J Bioinform Comput Biol , 8 , 177 –192. W ang, Z., Gerstein, M., and Snyder, M. (2009 ). RNA-Seq: a revolutionary to ol for tra nscriptomics. Nat R ev Genet , 10 (1), 57– 63. W u, Z., W ang, X., and Z h ang, X. (2011). Using no n-uniform read distribution mo dels to improv e isofor m expression inference in RNA-Seq. Bio informatics , 27 (4 ) , 50 2–508. Xu, G. et al. (2010). T ranscriptome a n d ta rgetome analysis in MIR1 55 expressing ce lls using RNA-seq. RNA , pages 1610– 1622. 12 Supplemen tary Information A Metho ds A.1 Alignmen t probabilities W e presen t the alignmen t probability computation for the case of paired end r ea d s. F or s i ngle reads, the terms related to fr a gmen t or in se rt length d i stribution and the other paired read disapp ear. F or a giv en transcript I n = m ; m ∈ { 1 , . . . , M } , the p robabilit y of observing a p a ir of reads ( r (1) n , r (2) n ) is determined by the probabilit y of the read b eing sequenced from a sp ecific s t rand s at a s pecific p osition p with a sp ecific insert length l and the p robabilit y of rep orting th e r e ads after sequen c in g th e sequences ( seq (1) mlps , s e q (2) mlps ), P ( r (1) n , r (2) n | I n = m ) = P ( l | m ) P ( p | l , m ) P ( s | m ) P ( r (1) n | seq mlps ) P ( r (2) n | seq mlps ) . (5) Unless a strand sp ecific sequencing proto col is used, the probabilit y of observing a read from either str a nd is th e same, P ( s | m ) = 1 / 2, and can b e ignored. Th e fragmen t length distribu tio n P ( l | m ) is assumed to b e log-normal with its parameters giv en by t he user or estimated from read p a irs with only a sin g le transcript alignmen t. The probabilit y of sequen c ing a giv en p osition is in general P ( p | I n = m, l ) = b m ( p ) P l m − l r +1 p =1 b m ( p ) . (6) where b m ( p ) d e notes bias for a particular p ositio n p on trans c ript m . F or a constan t b m ( p ) corresp onding to a uniform read d istribution, this r e duces to P ( p | m ) = 1 / ( l m − l r + 1) whic h only d epend s o n the lengths of the transcript l m and the read l r . W e calculate the p robabilit y of obser vi ng a s e quence based on the read’s qualit y base scores an d mismatc hes. The Phr e d sco r e can b e con verted in to probabilit y of base-calling error p err ,i . The fin a l sequence probabilit y is now obtained as P ( r ( j ) n | seq mps ) = Y i ∈ matc hes (1 − p err ,i ) Y i ∈ mismatch es p err ,i , (7) where the pr o babilit y of err o r for a giv en base i is b a sed on the Phred score p err ,i = 10 − Phred i / 10 . A.1.1 Bias estimation Our mo del can easily incorp orate a correction for p osition and sequence sp ecific biases. One example of such a mo del is presen ted by Rob erts et al. (20 11) f o r correcting the fragmen tation bias. Under th is mo del, we h a v e b m ( p ) = b s, 5 m ( e 5 ) b s, 3 m ( e 3 ) b p, 5 m ( e 5 ) b p, 3 m ( e 3 ) , (8) where b s, 5 m ( e 5 ) and b s, 3 m ( e 3 ) are the sequence sp ecific biases f o r 5’ and 3’ end s of th e fr a gmen t, r e sp ectiv ely , and b p, 5 m ( e 5 ) and b p, 3 m ( e 3 ) are the corresp onding p ositional biases. W e us e separate v ariable length mark ov m odels to capture the bias for eac h end. The str uct ure of this mo del is the same as that of Rob erts et al. (2011), p resen ted in Figure 2 of the supplementa ry metho ds. F or the sequence bias th e se are b s, 5 m ( e 5 ) = 21 Y n =1 ψ 5 ,R n,π n ψ 5 ,U n,π n , (9) 13 whic h are based on 21 probabilities ψ 5 n,π n from 8 b a ses b efore and 12 bases after the read s t arting p osition. Here ψ 5 ,R refers to the biased and φ 5 ,U to a u niform mo del, n is a no de or a p osition, π n are the parents of no de n and ψ 5 n,π n is the pr o babilit y of base X at no de (or p osition) n giv en the b a s e s observ ed on paren t nod e s π n . T he mo del has 744 parameters in a ll, with eac h no de ha ving 0, 1 or 2 parents a s in the mo del of Rob erts et al. (2011). The parameters are estimated from empirical f requencies using reads with a single alignment. F or a read r aligning to trans c ript m we in c rease appropriate probabilities ψ 5 ,R b y 1 /θ m , w here θ m is an initial coarse expression estimate obtained by runn ing BitSeq with uniform read distribution mo del b eforehand. In the cont rasting uniform m odel for all K = l m − l r + 1 p ossible p ositions of r e ad of length l r , the appropriate p robabiliti es ψ 5 ,U are increased by 1 θ m K . The mo del b s, 3 m ( e 3 ) is similar. In addition to the sequence-sp ecific bias, there is a mo del for p o sitional bias within the transcript. This is b p, 5 m ( e 5 ) = ω R l m ,e 5 /l m ω U l m ,e 5 /l m , (10) where ω l,p is th e probabilit y for starting p osition within transcrip t of length l on p osition p . The pr o b a- bilities are m odelled w i thin 5 transcrip t length bins and 20 bins of r el ativ e p osition. Th e probabilities are again estimated from empirical f requencies of reads with single alignmen ts taking into accoun t exp ression θ . A.2 Effectiv e length compu tation F or the pu rp o se of rep orting normalized measure such as RP KM, θ , the relativ e expression of fragmen ts, has to b e normalized by the amount of r e ads or fr a gmen ts that can b e pro duced by a u nit of trans c ript. When assum ing uniform read distribution of single-end reads, this w ould b e l m − l r as the num b er of starting p ositions for a read of length l r . F or pair-end reads, the effectiv e length of a transcript has to accoun t for fragmen t length distrib utio n as we ll, l ( ef f ) m = l m X l f =1 p ( l f | m ) ∗ ( l m − l f ) . (11) With the use of read distribu ti on with bias correction, w e learn m o re ab out the distribu ti on of fragments and th u s can u se this information wh en computing the effectiv e length. In this case, the effectiv e length tak es in to account bias weig ht for eve ry p osition of the transcript, l ( ef f + bias ) m = l m X l f =1 p ( l f | m ) l m − l f X p =1 b m ( p ) (12) As we show later in Section B.2 of this S upplemen tary material, u sing the bias corrected effectiv e length can substantial ly improv e the accuracy of our metho d. A.3 Gibbs sam pling in exp ression estimation (Stage 1) W e apply a collapsed Gibbs samp l er for Stage 1 estimation by marginalising out the expression lev el and noise lev el parameters θ and θ act and iterativ ely resamp l ing the isoform assignmen ts I n of eac h r e ad giv en 14 the assignment s of other reads I ( − n ) . T he full up date ru l es f o r the sampler are P ( I n | I ( − n ) , R ) = Cat( I n | φ ∗ n ) , (13) φ ∗ n 0 = P ( r n | noise)( β act + C ( − n ) 0 ) / Z ( φ ∗ ) n , m 6 = 0; φ ∗ nm = P ( r n | I n )( α act + C ( − n ) + ) ( α dir + C ( − n ) m ) ( M α dir + C ( − n ) + ) / Z ( φ ∗ ) n , C ( − n ) m = P i 6 = n δ ( I i = m ) , C ( − n ) + = P i 6 = n δ ( I i > 0) , with Z ( φ ∗ ) n b eing a constant n o rmalising φ ∗ n to sum up to 1, and α dir = 1 , α act = 2 , β act = 2. As an alternativ e, it is also p ossible to u se a r eg u la r Gibb s sampler alternating b et we en samp l ing I n and θ . Th e corresp onding up date ru l es are P ( I n | θ , θ act , R ) = Cat( I n | φ n ) , (14) φ n 0 = P ( r n | noise)(1 − θ act ) / Z ( φ ) n , m 6 = 0; φ nm = P ( r n | I n ) θ m θ act / Z ( φ ) n , P ( θ | I , θ act , R ) = Dir( θ | ( α dir + C 1 , . . . , α dir + C M )) , (15) P ( θ act | I , θ , R ) = Beta( θ act | α act + N − C 0 , β act + C 0 ) , (16) C m = P N n =1 δ ( I n = m ) . This approac h is usu a lly less efficien t in practice, though. A.4 Differen tial Expression model (stage 2) The Differen tial Exp ression (DE) mo del is sho w n in Figure 3 of the main pap er. W e consider data from conditions c = 1 . . . C with num b er of r e plicates for eac h condition denoted R 1 , . . . , R C . W e fi t the mo del to ea c h transcr i pt m indep enden tly u sing “pseu do- data” y ( cr ) m = log θ ( cr ) m whic h is creat ed from MCMC samples from Stage 1. One sample of θ ( cr ) m is dra wn for eac h ( r , c ) combination to create a pseud o -data v ector y m of length P C c =1 R c . Inf e rence is carried out indep endently f o r eac h p se udo-data v ector and the results are then combined as describ ed in the main text. This allo ws the technical err o r from Stage 1 to b e p ropaga ted through the mo del. Sin c e the mo del is conjugate then the in fe rence for eac h ps e udo-data v ector is exactly tractable an d no further MCMC is r equired to sample the cond i tion means. A.4.1 P arameter estimation for ea c h tra ns cript The condition means a re denoted µ m = ( µ (1) m , . . . , µ ( C ) m ) and we are intereste d in inf e rring the p osterior distribution o v er the means given one pseudo-data v ector y m . T he mo del is d efined as, y ( cr ) m ∼ Norm( µ ( c ) m , 1 /λ ( c ) m ) µ ( c ) m ∼ Norm( µ (0) m , 1 / ( λ 0 λ ( c ) m )) λ ( c ) m ∼ Gamma( α G , β G ) with hyper-p a rameters λ 0 , α G , β G whic h are estimated from group s of transcripts with similar mean ex- pression across conditions. The hyp er-parameter µ (0) m is fi xed at th e empirical mean transcript expression across conditions. 15 p ( µ m , λ m | y m ) ∝ p ( y m | µ m , λ m ) p ( µ m ) p ( y m ) ∝ C Y c =1 p ( µ ( c ) m ) p ( λ ( c ) m ) R c Y r =1 p ( y ( cr ) m | µ ( c ) m , λ ( c ) m ) ∝ C Y c =1 Gamma( λ ( c ) m | a c , b c )Norm µ c λ 0 µ (0) m + S y c λ 0 + R c , 1 λ ( c ) m ( λ 0 + R c ) ! a c = α G + R c 2 b c = β G + 1 2 λ 0 µ (0) m 2 + S 2 y c − ( λ 0 µ (0) m + S y c ) 2 λ 0 + R c ! where S y c d e notes P R c r =1 y ( cr ) m and S 2 y c denotes P R c r =1 y ( cr ) m 2 . A.4.2 Hyp er-parameter estimat ion across transcript groups F or hyp er-paramet er estimation w e consider a set of transcripts m = 1 . . . M ′ in a group g of tran sc ripts with similar expression. The h y perp a r a meter µ 0 is no w set to the mean expression p er g roup of transcripts and λ 0 is set to 2.0. W e hav e pseud o -data s a m ples y ( cr ) m for eac h tr a n script and we are in terested in h y perp a r ame ters α and β , wh e re β is the rate of Gamma d i stribution. The mo del is defin ed as, y ( cr ) m ∼ Norm( µ ( c ) m , 1 /λ ( c ) m ) µ ( c ) m ∼ Norm( µ (0) m , 1 / ( λ ( c ) m λ 0 )) λ ( c ) m ∼ Gamma( α, β ) P ( α, β ) ∼ Uniform(0 , ∞ ) The hyper-parameter p osterior distribu ti on is given by , P ( α, β | y ) ∝ P ( α, β ) P ( y | α, β ) ∝ M ′ Y m =1 C Y c =1 P ( y c m | α, β ) ∝ M ′ Y m =1 C Y c =1 Z dλ ( c ) m p ( λ ( c ) m | α, β ) Z dµ ( c ) m P ( µ ( c ) m | λ ( c ) m ) R c Y r =1 P ( y ( cr ) m | λ ( c ) m , µ ( c ) m ) ∝ M ′ Y m =1 C Y c =1 β α Γ( α ) Γ( α + R c ) β + 1 2 λ 0 µ (0) m 2 + S 2 y c − ( λ 0 µ (0) m + S y c ) 2 λ 0 + R c α + R c . This distribution is not in a stand a rd form and w e use Metrop olis-Ha s t ings Rand o m w alk MCMC to sample α and β . W e then use lo wess smo othing across groups to estimate the mean hyp e r-parameter for eac h transcript according to its emp iric al mean expression leve l across cond it ions. 16 (a) Anti-correla tion of transcripts. (b) No observ able correlation. (c) Anti-correlatio n of transcripts.. (d) T ranscript sequence profile. Figure 7: In plots (a), (b) and (c) w e sho w the p osterior transcript exp ressio n dens i t y fo r pairs of transcr i pts from the same gene. This is a d ensit y m a p co nstructed using the MCMC expr e ssion sa mples for these three transcrip t s. In ( d) w e sho w t ranscript sequence profile obtained fr o m the UCSC genome br o wser. The sequencing data is fr o m miRNA-155 study pu blished b y Xu et al. (2010). B Results B.1 T ranscript expression in ference In the main text (Figure 4) w e illustrate the correlation presen t in the expr essio n p osterior distribu tio n for tran sc ripts that share a large pr o p ortion of transcrib ed sequence. Here w e pr o vide all thr e e pairwise plots for the transcripts u c 010oho.1 , uc010ohp.1 and u c0 01bwm.3, whic h are the only transcripts of gene Q6ZMZ0 in the UCSC known Gene annotation. T he expression samples of uc001b wm . 3 and uc010ohp.1 (Figure 7(c)) are also negativ ely correlated. This means that the mo del is not able to d ec ide from w hic h transcript some of the reads originated and the p osterior d i stribution captur e s all viable assignmen ts. The transcript sequence pr o file in Figure 7(d) clearly d e monstrates the similarit y of the transcripts that causes higher uncertain t y when inferrin g the transcript expression leve ls. B.2 Read di stribution bias correction W e compared four differen t metho ds for expression estimation w hic h include bias co rrection options fo r non-uniform read distr i bution. The e xtended results are presen ted in T able 2, where w e rep o rt the R 2 correlation of 893 tr a n script expression estimates w it h the T aqMan qR T-PCR results. W e used ev ery metho d to analyse eac h of the three tec hn ic al replicates separately and th e n used the a v erage expression lev el for the comparison. As was already stated in the main pap er, the newest stable v ers i on of Cufflinks do es provi de the lo west correlation. W e resorted to using the version 0.9.3 w hic h wa s used in the pap er present ing the bias correction metho d adopted by BitSeq (Rob erts et al. , 2011). F or BitSeq, the ma jor ben e fit of the bias correction alg orithm comes f rom the effec tiv e transcrip t length normalisation. Relati v e expression of fragments used by BitSeq can b e con verted into r el ativ e exp ressio n of trans c ripts or into RP KM measure b y adjusting the expression b y effectiv e length (see Su pplemen tary Section 1). In T able 2 w e compare three differen t approac hes for length normalisatio n. In the first appr o ac h ( ∗ ), the expression is adju ste d by the length of a transcrip t. The second app roa ch ( † ) uses effectiv e length taking in to account th e paired-end read fragmen t length distrib utio n and the num b er of all p ositions fr o m 17 Metho d ver. Read distribu ti on Av erage Rep. 1 Rep. 2 Rep. 3 BitSeq 0.4 uniform ∗ 0.7585 0.7575 0.7580 0 .7594 BitSeq 0.4 uniform † 0.7677 0.7672 0.7669 0 .7675 BitSeq 0.4 bias corrected ∗ 0.7565 0.7554 0.7561 0 .7573 BitSeq 0.4 bias corrected † 0.7652 0.76495 0.7647 0 .7652 BitSeq 0.4 bias corrected ‡ 0.8011 0.8018 0 .7959 0.8041 Cufflinks 0.9.3 uniform 0.7503 0.7470 0.7513 0 .7519 Cufflinks 0.9.3 bias corrected 0.8056 0.8018 0 .8050 0.8083 Cufflinks 1.3.0 uniform 0.5331 0.5130 0.5336 0 .5477 Cufflinks 1.3.0 bias corrected 0.684 2 0.6858 0 .6917 0.6446 RSEM 1.1.14 uniform 0.7632 0.7623 0.7628 0 .7640 RSEM 1.1.14 bias corrected 0.7633 0.7623 0 .7628 0.76409 MMSEQ 0.9.18 uniform 0.7614 0.76099 0.7606 0.7 620 T able 2: Ev aluation of tran sc ript expression inference algorithms u sing the SRA012427 RNA-seq d a ta and T aqMan qR T -PCR expression measures for 893 matc hin g transcripts. Reported v alues a re P earson R 2 correlation co effici en t of the 893 tr a n scripts’ exp ressio n estimates and qR T-PC R results, b est correlation of a metho d using av eraged expression is highlighte d. F or eac h metho d we presen t v alues for a verage expression tak en from thr ee rep l icates as w ell as for eac h tec h nica l replicate separately . BitSeq was used with three d iffe ren t ve r sions of expression length n o rmalisation: ∗ – using actual transcript length, † – using effectiv e length accoun ting for fragment length distribu t ion, ‡ – using effectiv e length accounti ng for fragmen t length and read distr i bution bias. whic h a f rag m e n t could originate. The last approac h ( ‡ ), which p ro vides b est results on this dataset, uses effectiv e length computed usin g the fr ag m e n t length distribu tio n as well as read distr i bution bias w eigh ts (see Equatio n 12). More careful in v estigatio n of t his p rocess is required, ho we v er it is limited by small n u m b er of RNA-seq d a tasets with known un derlying exp ression, esp eciall y w hen using paired-end reads. B.3 Assessing transcript expression inference using simula ted data W e used s i m u l ated d at aset of 10M paired-end r ea d s to examine th e expression estimation accuracy of Bit- Seq and compared it against other three p opular metho ds. The reads were generated based on expression estimates fr o m the Xu et al. d a taset with a fr a gment size distribu t ion l f ∼ LogNorm(5 . 32 , 0 . 12), in ferred from the S RA0 12427 d a taset. W e used the UCSC NCBI37/ h g1 9 kno wn Ge ne a nnotation transcripts to generate the read fragmen ts. First w e compared th e o verall expression accuracy against th e generativ e read coun t v alues (Figure 8). W e used read count in order to facilitate the second p a r t of our comparison, the assessment of the within gene relativ e expression estimation (T ab l e 3), for wh ic h the us e RPKM would not b e feasible. F or comparison of ov erall e xpression accuracy , w e rep o r t the Pearson R 2 correlation co efficien t with the groun d tru t h. Th e co efficien t wa s calculated for transcripts with at least one read generated (46841 transcripts). In t his c omparison RSEM ( R 2 = 0 . 998) has the highest correlation with M MSeq ( R 2 = 0 . 997) and BitSeq ( R 2 = 0 . 995) b eing closely b ehind. Unfortunately we again hav e to rep ort p o or resu lt s for the latest version of Cu fflinks ( R 2 = 0 . 307) with the version 0.9.3 s t ill p erforming wo rse than the other thr ee metho ds ( R 2 = 0 . 784) . In the withing gene exp ression comparison (T able 3), we u sed t wo cu t offs for relev an t transcrip t s. The first taking into account transcripts for whic h their gene has at least 10 r e ads in the ground truth (45662 transcripts) and the second considering on l y tr a n scripts f o r which th e gene has at least 100 reads (33757 transcripts). BitSeq p erforms the b e st for th e n a rro w range of trans c ripts with RSEM and MMSEQ ha ving comparable r esults. F or th e less stringent criteria, BitSeq still r e tains ve ry go od correlation with 18 (a) (b) (c) (d) Figure 8: Comparison of expression estimates using 10M simulated pair-end reads with kn o wn exp ression. The expr essio n estimates w ere con verted into estimated read count s for eac h transcript an d compared against ground truth using Log-Log plot. W e calculated Pe arson R 2 correlation co efficie n t for transcrip t s with at least one generated p a ired-end read.The fi gures show (a) BitSeq, (b) Cuffl inks v0.9.3, (c) RS EM, and (d) MMSEQ. the groun d truth w hile th e p erformance of th e other tw o m e tho ds deteriorates. As we are using the same dataset, b oth versions of C ufflinks provide p o o r correlation when compared to other th ree metho ds. BitSeq Cufflinks Cufflin ks 0.9.3 RSEM MMSEQ ab o v e 10 reads 0.951 0.205 0.739 0.876 0.888 ab o v e 100 reads 0.964 0.17 6 0.787 0.945 0.948 T able 3: The R 2 correlation coefficient of estimated within-gene relativ e expression and ground truth . Th e correlation was calculated for t wo group s, first one con taining transcripts of genes with at least 10 r ea d s and the second one contai ning transcripts of genes w it h at least 100 r e ads according to the ground tru t h. 19 6 4 2 0 2 4 6 8 10 Log RPKM expression 0.0 0.2 0.4 0.6 0.8 1.0 1.2 1.4 Averaged standard deviation within experiment technical replicate biological replicate Figure 9: Comparison of standard deviation of p osterior samples within single d a taset and com bined datasets of tec hnical replicates and biologic al replicates, with log RPKM expression on the x-axis and standard deviation of log RPKM expression on y-axis. The standard deviation is a sliding a verage o ver groups of transcrip t s with similar expression in ord er to highlight its dep endents on th e expression. B.4 Biological v ariance of RN A-se q d ata W e used RNA-seq data from the microRNA target id e n tifi c ation study (Xu e t al. , 2010 ) to test and com- pare the d iffe ren tial expression analysis metho d used in BitSeq S t age 2. This dataset conta ins tec h nical as wel l as biolog ical r e plicates for eac h studied cond i tion allo wing assessmen t of the effec ts of biolog ical v ariation. Similarly to previous resu lt s (And ers and Hub er, 2010; Osh la c k e t al. , 201 0 ), we observe signifi- can t biological v ariation w it hin conditions. Figure 9 sh o ws the standard deviation of transcript expression lev el p osterior MCMC samples as a fu nctio n of the mean expression lev el of the tr a nscript. W e compare the standard d e viation f o r samples from with i n one exp erimen t, b et w een t wo tec hn i cal replicates and b e- t wee n tw o biological r eplic ates. In order to calculate the stand a rd deviation b et wee n replicate s w e took the squ a red ro ot of v ariance whic h wa s estimated b y computin g mean s quare distance b et w een samples. Plotted v alues are a v eraged for a sliding window of similarly expr e ssed tr a nscripts. The MCMC sample v ariation captures the intrinsic estimation v ariance in th e “within-exp eriment ” case. The tec hnical v ari- ance includes a contribution due to re-sequencing the same biological sample while the b i ologic al v ariance includes a con tribution du e to rep eating the exp erimen t. W e see that with h i gher expression the v ariation of the expr e ssion lev el estimation decreases as exp ected. A t high expr e ssion lev els the v ariance asso ciate d w it h tec h nica l replicates approac h es the lev el o f t he within- exp erimen t v ariance. On the ot her hand, the biologica l v ariance b ecome s rela tiv ely more significant in this regime. Without consideration of biolo gical differences, high c onfidence of expression estimation of these tr a n scripts will lead to f a lse d i fferen tial expression calls. It can also b e observ ed that the within- exp erimen t v ariance is a significant con tribution to replicate v ariance (tec h nica l and biological) at lo wer expression lev els. Therefore th e intrinsic v ariance d ue to mappin g am b ig uit y and limited read depth, as 20 estimated b y our MCMC expression estimatio n pro cedure, will pro vide useful information for assessing replicate v ariance in this low expr e ssion regime. B.5 Assessing DE p erformance with sim ulated data 0.0 0.2 0.4 0.6 0.8 1.0 FPR 0.0 0.2 0.4 0.6 0.8 1.0 TPR BitSeq DESeq edgeR BaySeq Cuffdiff Figure 10: R O C curves av eraged o ver 5 ru ns w it h standard deviation depicted by error bars . T he curv e w as calculated for trans c ripts with a verage of at least one r e ad in the ground truth. The fold change wa s uniformly distrib uted in the int erv al (1 . 5 , 3 . 5). W e carried out extensive assessment of DE analysis accuracy of BitSeq with comparison to other metho ds. The Cuffd i ff metho d from Cufflinks pac k age (T rapn e ll et al. , 2010) is the only other method designed for t ranscript lev el DE analysis that uses replicates and accounts for biological v ariation. W e also included th ree p opular m e tho ds whic h are primarily designed for gene level DE analysis (DESeq (Anders and Hub er, 2010), e dgeR (Robinson e t al. , 2010), ba yS e q (Hardcastle and Kelly, 2 010)), but give n the lac k of other options and their inpu t b eing on l y th e read coun t v ectors, they could b e considered for the tr a nscript level analysis use case as w ell. Using expression estimates obtained by BitSeq Stage 1, w e conv erted the relativ e expression of fragmen ts i n to read counts by simply m u lt iplying it by the total n u m b er of aligned reads and used th is as an in put for the gene-lev el m e tho ds. F or eac h of these metho ds w e used default parameter settings according to the p a ck ages’ vignettes. The Figure 10 sho w s th e same R OCs as Fig ure 6( a) in the main p a p er w i thout the 0. 2 cutoff. The ev aluatio n is only for transcripts with at least one generated read on a ve rage with fold c h a nge b eing uniformly generated from the in terv al (1 . 5 , 3 . 5). In this figure, the error bars depict the standard deviation 21 0.00 0.05 0.10 0.15 0.20 FPR 0.0 0.1 0.2 0.3 0.4 0.5 0.6 TPR BitSeq DESeq edgeR BaySeq Cuffdiff (a) 0.00 0.05 0.10 0.15 0.20 FPR 0.0 0.1 0.2 0.3 0.4 0.5 0.6 TPR BitSeq DESeq edgeR BaySeq Cuffdiff (b) 0.00 0.05 0.10 0.15 0.20 FPR 0.0 0.1 0.2 0.3 0.4 0.5 0.6 TPR BitSeq DESeq edgeR BaySeq Cuffdiff (c) 0.00 0.05 0.10 0.15 0.20 FPR 0.0 0.1 0.2 0.3 0.4 0.5 0.6 TPR BitSeq DESeq edgeR BaySeq Cuffdiff (d) 0.00 0.05 0.10 0.15 0.20 FPR 0.0 0.1 0.2 0.3 0.4 0.5 0.6 TPR BitSeq DESeq edgeR BaySeq Cuffdiff (e) Figure 11: Differen tial expression analysis of simulated data with v arious levels of fold change. The figures fo cus on the most relev an t regio n with false p ositiv e rate ab o v e 0. 2, and sho wing the y-axis up to true p ositiv e rate 0.65. Th e su b fi g ures show data with fold change: 1.5 (a), 2.0 (b), 2.5 (c), 3.0 (d) and 5.0 (e). for the a verag ed curves s ho wing consistent results trough the exp eriment s. W e can see that BitSeq p erforms sligh tly b etter than the other metho ds with b a ySeq having higher tru e p ositiv e range in area with ab o v e 0.4 false p ositiv e r a n ge , ho wev er this area is not inte resting fr o m the application p ersp ectiv e. In the v ery last figu re (11), we compare the accuracy of these metho ds with resp ect to the fold c hange of differen tially expressed transcripts. W e again restrict the fi g ures to the area with false positiv e rate b elo w 0.2 which in our op i nion is the most imp ortan t in terms of app li cabilit y . Instead of usin g randomly selected fold c hange, all different ially expr e ssed transcripts are either u p-regulat ed or do wn -reg ulated by constan t fold c hange. The increa se of fold c hange clearly impro v es the p e rformance of the metho ds as w e exp ected. BitSeq and ba ySeq hav e consistently b etter results than the other m e tho ds except for the 22 lo we st fold c hange 1 . 5 , in whic h ba ySeq has the lo we st true p ositiv e rate and edgeR with DESeq outp erform BitSeq in h a lf of the sp ectrum. In all o f our DE e xp erimen ts, C uffdiff, despite being designed for trans c ript lev el analysis p erforms w orse out of the 5 compared algorithm. This could b e largely attributed to the expression estimation problem, ho w ever for DE analysis r et urn to the older version (0.9.3) did not imp ro v e th e results, p ossibly b ecause of different DE mo del. Our data also s ho ws that for most parts, the DESeq and edgeR metho ds pro duce v ery similar resu l ts in terms of accuracy . W e hav e to n o te, that ev en though w e tried to s i m u la te the data in wa y to resem ble real RNA-seq exp erimen ts, the data pr o v ed to b e r a ther hard for all m e tho ds b eing compared. References Anders, S . and Hub er, W. (2010). Differen tial expr e ssion analysis f o r sequence coun t data. Genome Biol , 11 (10), R106. Hardcastle, T. J. a n d Kelly , K. A. (2010). baySeq: Empir ic al Bay esian Metho ds F or Iden tifying Diffe ren tial Expression In Sequence C o u n t Data. BM C Bioinformatics , 11 (1), 422. Oshlac k, A., Robinson, M. D., and Y oung, M. D. (2010). F rom RNA-seq reads to differen tial expression results. Genome Bi o l , 11 (12), 220. Rob erts, A., T rapn ell , C., Donaghey , J., Rinn, J. L., and Pac h ter, L. (2011). Impro ving RNA-Seq expression estimates by correcting for fragment bias. Genome Biol , 12 (3), R22. Robinson, M. D., McCarth y , D. J . , and Sm yth, G. K. (20 10). edgeR: a Biocond ucto r pac k age for different ial expression analysis of d ig ital gene expression data. Bioinformatics , 26 (1), 139–4 0. T rapnell, C. et al. (2010). T r a nscript assembly and quantifica tion b y R N A-Seq r e v eals un annotat ed tran- scripts and isoform s wit c hing during cell different iation. Nat Biote chnol , 28 (5), 516–520 . Xu, G. et al . (2010). T ranscrip t ome and targetome analysis in MIR155 expr e ssing cells usin g RNA-seq. RNA , pages 1610–16 22. 23
Original Paper
Loading high-quality paper...
Comments & Academic Discussion
Loading comments...
Leave a Comment