Tellipsoid: Exploiting inter-gene correlation for improved detection of differential gene expression
Motivation: Algorithms for differential analysis of microarray data are vital to modern biomedical research. Their accuracy strongly depends on effective treatment of inter-gene correlation. Correlation is ordinarily accounted for in terms of its eff…
Authors: Keyur Desai, J.R. Deller, Jr.
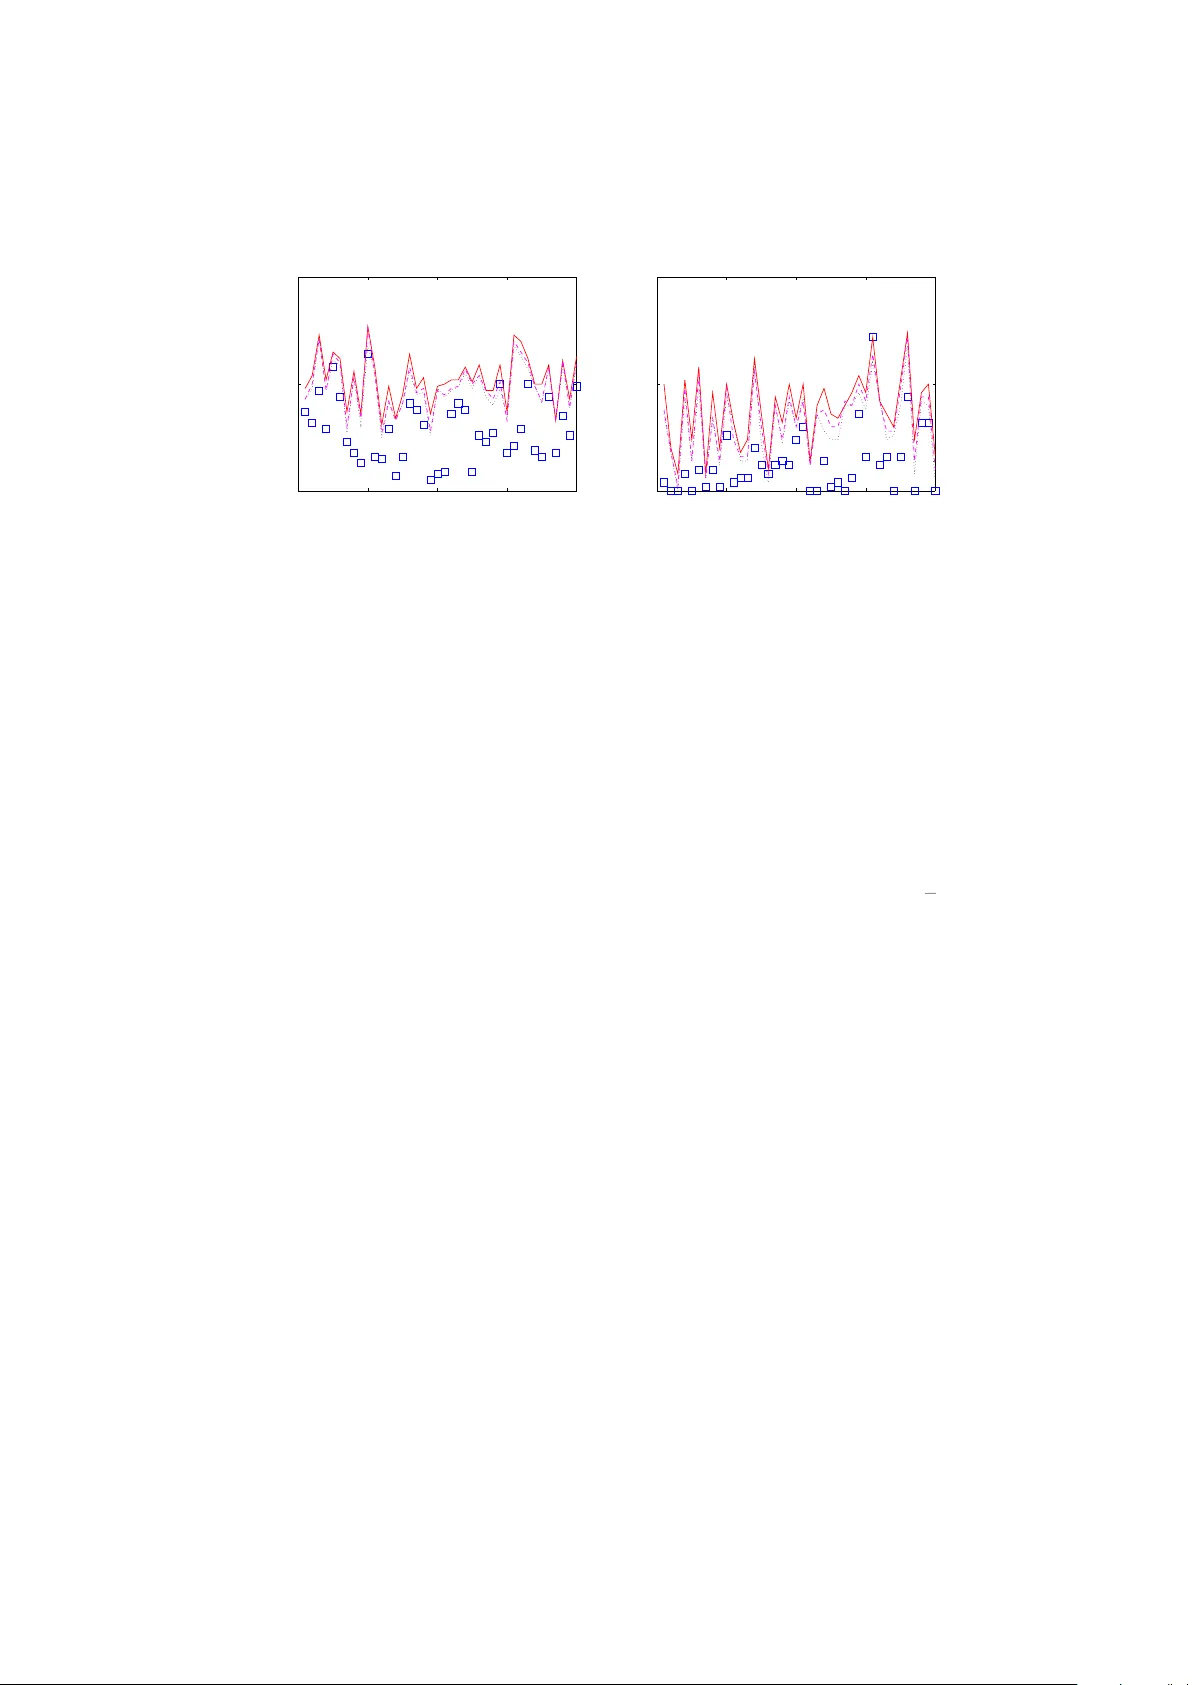
T ellipsoid: Exploiting in ter-gene correlation for impro v ed detection of differen tial gene expression Keyur Desai 1 ∗ , J.R. Deller, Jr. 1 and J. Justin McCormic k 2 1 Dept. of Electrical and Computer Engineering 2 Dept. of Bio c hemistry and Molecular Biology Mic higan State Universit y , E. Lansing, MI 48824, USA F ebruary 11, 2008 Abstract Motiv ation: Algorithms for differen tial analysis of microarra y data are vital to mo d- ern biomedical researc h. Their accuracy strongly dep ends on effectiv e treatmen t of in ter-gene correlation. Correlation is ordinarily accoun ted for in terms of its effect on significance cut-offs. In this pap er it is shown that correlation can, in fact, b e exploited to share information across tests, whic h, in turn, can increase statistical p o w er. Results: V astly and demonstrably impro ved differen tial analysis approaches are the result of com bining identifiabilit y (the fact that in most microarra y data sets, a large prop ortion of genes can b e identified a priori as non- differen tial) with optimization criteria that incorporate correlation. As a sp ecial case, w e develop a metho d whic h builds up on the widely used tw o-sample t -statistic based approach and uses the Mahalanobis distance as an optimalit y criterion. Results on the prostate cancer data of Singh et al. (2002) suggest that the prop osed metho d outp erforms all published approac hes in terms of statistical p o w er. Av ailabilit y: The prop osed algorithm is implemented in MA TLAB and in R. The soft ware, called T el lipsoid , and relev an t data sets are av ailable at www. egr.msu.edu/ ~ desaikey . ∗ to whom corresp ondence should be addressed; contact: desaikey@egr.msu.edu 1 Submitted to Bioinformatics Desai et al. 2 1 In tro duction Detecting differentially expressed genes in the presence of substan tial in ter- gene correlation is a challenging problem. Researc h has fo cused largely on understanding the harmful effects of correlation on the threshold settings demarcating null and non-null genes. In fact, ho wev er, the nominally con- founding correlation can b e exploited to increase statistical p o wer of microar- ra y studies. This observ ation has engendered a fruitful research direction in tro duced in this pap er. The literature is not devoid of attempts to develop more p o w erful sum- mary statistics whic h exploit correlation, but suc h efforts hav e not pro duced comp elling results. W e p osit that the limitations of suc h developmen ts are due, at least in part, to neglecting identifiability – the fact that in most microarra y data sets, a large prop ortion of genes requires no tec hnical effort to b e identifie d as explicitly non-differential. In this pap er, we present a new differen tial analysis metho d which ex- ploits identifiabilit y through an optimization criterion whic h incorp orates in ter-gene correlation. The metho d builds upon the widely-used t wo-sample t -statistic approac h with a minimization of the Mahalanobis distance as the optimalit y criterion. Although this pap er fo cuses primarily on t wo-sample microarra y studies, the framew ork is readily generalizable for use in studies with m ultiple or con tinuous cov ariates, as well as to other multiple compar- ison applications. Let us assume that m genes are measured on n microarra ys, under t wo differen t exp erimen tal conditions, such as con trol and treatment. Based on the gene expression matrix X , we are in terested in identifying a small n umber of genes that are resp onsible for class distinction. One widely used strategy [e.g., T usher et al. (2001) and Efron (2004)] is to represent each gene b y its null hypothesis and tw o-sample t -statistic, 1 sa y Null h yp otheses: H 1 , H 2 , . . . , H m T est statistics: t 1 , t 2 , . . . , t m . The magnitudes of the t -statistics establish a gene-ranking and the R (presumably m ) genes with the largest t -scores are reported as statisti- cally significan t discov eries. The in vestigator can either explicitly supply a R or rely on the false disc overy r ate (FDR) calculations to find a maximal R with the allow able FDR. The issue of correctly estimating the FDR in the presence of correlation has received m uch recen t atten tion b ecause highly correlated tests increase the v ariance of the FDR leading to unreliable results (Owen, 2005). As discussed in Efron (2007) and Desai et al. (2007), for “ov er p o w ered” X ’s, there may b e significan tly few er tail-area null coun ts than exp ected, while for 1 n ull = non-differen tial; non-null = differential Submitted to Bioinformatics Desai et al. 3 “under pow ered” X ’s, the situation can worsen with man y more tail-area n ull coun ts than exp ected. Imp ortan tly though, tec hniques for correctly estimating the FDR do not c hange the gene-ranking, but only the size of the rep orted list. The presen t researc h was motiv ated by the notion that, for “under p o w- ered” X ’s, it might b e p ossible to exploit correlation across t i ’s to establish a gene ranking that has b etter statistical p o w er than the raw t i based rank- ing. The metho d that resulted from an exploration of this question indeed seems to impro ve the statistical pow er of al l X ’s. The prop osed method uses, (i) a vector of t -statistics ( t = [ t 1 , t 2 , . . . , t m ] T ) and (ii) an estimate of the cov ariance matrix of the vector t , to output a substantially revised v er- sion of t , denoted u | t , whose corresp onding entries can b e used to establish an impro ved gene-ranking. The metho d is summarized as follows. Let 2 t ∼ ( u , Σ). Now based on the measured v alue of t , w e can estimate u | t , but while doing so we inv ok e the zer o assumption (ZA) (Efron, 2006) that the smal lest P (%) of t i ’s are asso ciated with null genes. Based on the ZA, w e can set corresp onding en tries of u to zero. F or the remaining en tries of u we obtain minimum Mahalanobis distanc e (Mahalanobis, 1936) estimates. In ter-gene correlation causes t to distribute around its center of mass in an hyperellipsoidal manner, and the Mahalanobis distance is a natural w ay to measure v ector distances in such a distribution. In fact, the name T ellipsoid is adopted to emphasize the geometric in tuition of trac king the cen ter of an ellipsoid. W e hav e done extensive exp erimen tation with b oth real and simulated data and found that for a truly n ull t i whic h happ ens to b e in tail-area, the corresp onding u i | t consistently tends to zero (its theoretical v alue). Tw o prior research efforts were particularly useful in formulating the presen t approach. Storey et al. (2007), present a more general approach to the notion of sharing information across t i ’s, which they describ e as “b orro wing strength across the tests,” for a p oten tial increase in statistical p o w er. Tibshirani and W asserman (2006), discuss a new statistic called the “correlation-shared” t -statistic, and derive theoretical b ounds on its p erfor- mance; how ever, their approac h requires strong assumptions regarding the nature of correlation b et ween n ull and non-n ull genes whic h may not hold in man y real data sets. The prop osed metho d requires no such assumptions and y et provides considerable increase in p o w er as demonstrated by results rep orted in Section 4. The outline of this paper is as follows. Section 2 defines, and obtains closed form expressions for, the minim um Mahalanobis distance estimates in the t -statistic space. Section 3 builds on the theory of Section 2 to develop the T ellipsoid gene-ranking metho d. In Section 4 w e apply T ellipsoid to 2 No distributional information nor higher order statistics of t are assumed. Submitted to Bioinformatics Desai et al. 4 real cancer data of Singh et al. (2002) and compare its accuracy with the state-of-the-art differen tial analysis to ols EDGE (Storey et al., 2007) and SAM (T usher et al., 2001). Section 4 also discusses the implications of these results. W e conclude with Section 5 summarizing the main ideas. 2 Approac h 2.1 P er gene summary statistic Let X b e the m × n matrix of gene expressions, for m genes and n samples. W e assume that the samples fall into tw o groups k = 1 and k = 2 and there are n k samples in group k with n 1 + n 2 = n . W e start with the standard (unpaired) t -statistic: t i = ¯ x i ;2 − ¯ x i ;1 s i , (1) where ¯ x i ; k is the mean of gene i in group k and s i is the p ooled within-group standard deviation of gene i . If the i th gene is indeed n ull, then we exp ect t i ∼ (0 , ν / ( ν − 2)), where ν is the num b er of degrees of freedom, obtained from either the unpaired t -test theory or the p erm utation null calculations as in Efron (2007). If gene i is non-null, then w e exp ect t i ∼ ( u i , σ 2 i ). F or non-n ull genes, the v alues of u i and σ i dep end on the amount of up / do wn regulation, the n umber of samples in each group, and ν . 2.2 The zero assumption Without loss of generalit y , w e may assume that the genes are indexed so that | t 1 | ≤ | t 2 | ≤ · · · ≤ | t m | . (2) Then, a reasonable wa y to impose identifiabilit y on n ull genes is through the ZA, namely , that P (%) of the genes – those with the smallest t statis- tics – are null. Efron (2006) discusses the use of the ZA in a v ariety of differen tial analysis approaches. It pla ys a central role in the literature on estimating the prop ortion of null genes, as in Pa witan et al. (2005) and Langaas et al. (2005). The ZA is equally crucial for the tw o-group mo del approac h developed in the Ba y esian microarray literature, as in Lee et al. (2000), Newton et al. (2001), and Efron et al. (2001). F urthermore, the claim that the metho d in Storey (2002) improv es up on the well-kno wn Ben- jamini and Ho c h b erg (1995) FDR pro cedure (in terms of statistical p o wer) also crucially relies on an adaptiv e v ersion of the ZA. The use of the ZA is justified in the presen t situation as long as P is sufficien tly small so that the b ottom P (%) genes w ould almost certainly b e declared null for reasonable FDR’s. Submitted to Bioinformatics Desai et al. 5 F ormally , the ZA is stated as follows: Let c b e the largest integer (gene index) suc h that c/m ≤ P / 100, denoted c = d 0 . 01 mP e , (3) then genes with indices 1 , 2 , . . . , c are assumed n ull. Let us partition the set of t statistics in to those corresp onding to genes declared null under the ZA, { t 1 , t 2 , . . . , t c } , and those for the remaining m − c genes which contin ue to c omp ete for the non-null designation, { t c +1 , t c +2 , . . . , t m } . F or conv enience, w e introduce the following vector notation, t = t T 1: c t T c +1: m T = h t T (0) t T (1) i T . Then the random v ector t is distributed in the follo wing wa y: t ∼ ( u , Σ ) , (4) where u is the underlying mean vector and Σ the co v ariance matrix. The corresp onding partitions of ( u , Σ ) are denoted u = u (0) u (1) and Σ = Σ (00) Σ (01) Σ (10) Σ (11) . The central hypothesis of this pap er is that there is a vector, say u | t , whose elemen ts represen t a reordering of the elements of the t , suc h that gene- ranking represen ted b y u | t has better statistical p o w er for detecting non-n ull genes than that based on t itself. (In the presen t pap er, we fo cus on mainly the second-moment distri- butional characteristics of t . How ev er, in fact, if the gene expressions are normally distributed, then, p erhaps, t is describ ed more accurately by the m ultiv ariate Student distribution. Exploitation of this additional structure will b e considered in future work.) 2.3 Estimating u | t W e are interested in obtaining an estimate of the vector mean u based on the observ ation t . This requires an appropriate metric in the space of t vectors, with which to quan tify the distance of the observ ed t from the center of mass u , say dist ( t , u ). The ` 2 norm induces a useful metric b et w een t and u pro vided that w e first decorrelate the v ector elements as Σ − 1 / 2 ( t − u ), th us yielding dist ( t , u ) = q || Σ − 1 / 2 ( t − u ) || 2 = q ( t − u ) T Σ − 1 ( t − u ) . (5) Submitted to Bioinformatics Desai et al. 6 This weigh ted Euclidean distance is sometimes called the Mahalanobis dis- tanc e in the pattern classification literature as in Deller Jr et al. (1993), Devijv er and Kittler (1982), etc. W e can relate t to u through the Mahalanobis distance but while doing so we inv oke the ZA, which, in turn, implies that the first c entries of u are zero. This yields the estimate u ∗ = 0 u ∗ (1) , where u ∗ (1) = argmin u (1) ∈ R m − c (6) t (0) − 0 t (1) − u (1) T Σ (00) Σ (01) Σ (10) Σ (11) − 1 t (0) − 0 t (1) − u (1) . In effect, u ∗ (1) com bines the identifiabilit y information based on the ZA with the information ab out the co v ariance structure of t which to o can be ob- tained from the measured X itself. Notably the optimization in Eqn. (6) enjo ys closed form solution: u ∗ (1) = t (1) − Σ (10) Σ − 1 (00) t (0) . (7) The deriv ation leading from Eqn. (6) to Eqn. (7) is provided in the App endix. 2.4 Estimating Co v ( t i , t i 0 ) T o estimate the required en tries of Σ , w e mak e sev eral observ ations. The v a- lidit y of these observ ations can be established through computer simulations using the MA TLAB script testtcov.m av ailable with the T ellipsoid soft ware. (Equation (7) do es not require the cov ariance b et w een tw o non-n ull t i ’s.) Observ ation 1. If genes i and i 0 b oth are null, then Co v ( t i , t i 0 ) ≈ Cor( x i , x i 0 ) ν ν − 2 (8) Efron (2007) and Owen (2005) use this observ ation for their conditional FDR calculations. This observ ation ma yb e intuitiv e to the reader from Eqn. (1) itself, or it is easily verified through a computer simulation. Observ ation 2. Similarly , if the gene i is null and i 0 non-n ull (or con- v ersely), then Co v ( t i , t i 0 ) ≈ n 2 Cor( x i ;1 , x i 0 ;1 ) + n 1 Cor( x i ;2 , x i 0 ;2 ) n 1 + n 2 ν ν − 2 , (9) where Cor( x i ; k , x i 0 ; k ) denotes the correlation betw een gene i and i 0 within group k . Equation (9) accommo dates the p ossibilit y that the correlation b et w een a n ull and a non-null gene ma y change across groups. If this do es not o ccur, then Eqn. (9) reduces to Eqn. (8). Submitted to Bioinformatics Desai et al. 7 Observ ation 3. F urthermore, if n 1 ≈ n 2 (whic h is the case for most mi- croarra y studies), then Eqn. (9) simplifies to: Co v ( t i , t i 0 ) ≈ Cor( x i ;1 , x i 0 ;1 ) + Cor( x i ;2 , x i 0 ;2 ) 2 ν ν − 2 . (10) Equations (8) and (10) suggest that w e may use sample correlation to estimate Co v ( t i , t i 0 ): d Co v ( t i , t i 0 ) ∝ P j ˜ x ij ˜ x i 0 j r P j ˜ x 2 ij P j ˜ x 2 i 0 j , (11) where ˜ x ij denotes the expression lev el of the i th gene measured on the j th microarra y after subtracting the av erage resp onse within eac h treatment group. The scale factors cancel in the terms Σ (10) and Σ − 1 (00) , so that esti- mating ν /( ν -2) [see Eqn. (8)] is not required. 2.5 T ellipsoid equation In ligh t of Eqn. (11), Eqn. (7) tak es the practical form b u ∗ (1) = t (1) − b C (10) b C − 1 (00) t (0) , (12) where b C is the sample correlation matrix of the gene expression matrix ˜ X (after remo ving the treatmen t effects). In most cases computing the full matrix in verse ( b C − 1 (00) ) is not necessary and solving the term b C − 1 (00) t (0) through some efficien t linear solv er reduces the computation considerably . (See Subsection 3.3 for detail). 3 Algorithm 3.1 T ellipsoid This section outlines a self-con tained differen tial analysis algorithm based on the ideas discussed in Section 2. Its name T ellipsoid w as coined to emphasize the geometric in tuition of tracking the center of an ellipsoid. T ellipsoid tak es gene expression matrix X and provides a sp ecified num- b er, R , of the most differen tially expressed genes. In principle, the ranking is based on the set { u ∗ i } from Eqn. (6). In practice, we rely on the estimates { ˆ u ∗ i } from Eqn. (12). The algorithm b egins b y reindexing the genes based on their tw o-sample t -statistics [Eqn. (2)]. Then, based on the ZA, the first c genes are identified as null, as sp ecified in Eqn. (3). By default, P is set to 50(%). Although the c hoice 50% is somewhat arbitrary , this fraction has w orked well empirically Submitted to Bioinformatics Desai et al. 8 in the data sets tested. F uture researc h may yield more rigorous metho ds for c ho osing P . In order to n ullify any genuine treatment differences, X is conv erted to e X b y subtracting eac h genes av erage resp onse within each treatment group. The sample correlation matrix b C of e X is computed subsequently . The crucial step is to compute b u ∗ (1) based on Eqn. (12). The elemen ts of b u ∗ = [ 0 T c × 1 ( b u ∗ (1) ) T ] T determine the gene-ranking: A gene with bigger | b u ∗ i | is assigned a higher rank. The first R genes are rep orted as top R statistical disco veries. 3.2 Numerical stabilit y Because the num b er of samples n is often less than the num b er of genes m , the sample correlation matrix turns out to b e singular and hence non- in vertible. Therefore, we add a v ery small correction term (= 10 − 10 ) to its diagonal entries to mak e it nonsingular, and in effect, inv ertible. After this correction, T ellipsoid shows excellent numerical stability . 3.3 Computational complexit y Equation (12) inv olv es matrix inv ersion, whic h, if p erformed in a naive wa y , could b e a prohibitive op eration, since microarra y data sets may hav e sev eral tens of thousand genes. Indeed, solving the term b C − 1 (00) t (0) as a system of sim ultaneous linear equations ( b C (00) x = t (0) ) is muc h faster than explicitly computing b C − 1 (00) . In particular, we can employ the Cholesky decomp osi- tion to exploit the fact that the matrix b C (00) is symmetric and p ositiv e definite. MA TLAB implementation of T ellipsoid uses the in-built linslove with appropriate settings, which, in turn, uses highly optimized routines of LAP ACK (Linear Algebra P ACKage— http://www.netlib.org/lapack/ ). F or the Prostate data (used in Section 4) with 12625 genes and 102 samples, T ellipsoid, running on a computer with a 2.2 GHz dual-core AMD Opteron pro cessor with 8 GB of RAM and MA TLAB v ersion R2006b, re- quires just under 40 seconds to rep ort the final gene list. F or the same settings, the implemen tation with explicit matrix in v ersions takes ∼ 10 min- utes. 3.4 Summary of T ellipsoid T ellipsoid: An improv ed differential analysis algorithm Input: X = Lab eled m × n gene expression matrix; R = Size of gene list Output: The gene list containing top R differentially expressed genes 1. Calculate tw o-sample (unpaired) t -statistics: t i = ( ¯ x i ;2 − ¯ x i ;1 ) /s i Submitted to Bioinformatics Desai et al. 9 2. Reindex genes such that | t 1 | ≤ | t 2 | ≤ · · · ≤ | t m | 3. Gather first c = d 0 . 01 mP e t i ’s in a v ector t (0) ; By default P =50(%) 4. Con v ert X to e X by subtracting each genes av erage resp onse within eac h treatment group 5. Compute b C = the sample correlation matrix of e X 6. Find b u ∗ = [ 0 T c × 1 b u ∗ (1) T ] T , where b u ∗ (1) = t (1) − b C (10) b C − 1 (00) t (0) 7. Determine gene-ranking: Assign a gene with bigger | b u ∗ i | a higher rank 8. Report top R genes as statistical discov eries 4 Results and Discussion W e compare T ellipsoid with tw o of the leading tec hniques, SAM [Significance Analysis of Microarrays (T usher et al., 2001)] and EDGE [Extraction and analysis of Differential Gene Expression (Leek et al., 2006)]. SAM adds a small exc hangeability factor s 0 to the p ooled sample v ariance when comput- ing the tw o-sample t -statistic: d i = ( ¯ x i ;2 − ¯ x i ;1 ) / ( s i + s 0 ); whereas EDGE is based on a general framework for sharing information across tests (see Storey et al. (2007)). EDGE is rep orted to show substan tial improv ement (in terms of statistical p o w er) ov er five of the leading techniques including SAM (Storey et al., 2007). The other four are: (i) t / F –test of Kerr et al. (2000) and Dudoit et al. (2002); (ii) Shrunken t / F –test of Cui et al. (2005); (iii) The empirical Ba yes lo cal FDR of Efron et al. (2001); (iv) The a p oste- riori probabilit y approach of Lonnstedt and Sp eed (2002). It is noteworth y that T ellipsoid shows a ma jor improv ement ov er EDGE itself. T o determine the p erformance qualit y of v arious techniques, w e fo cus primarily on the empirical FDR in the rep orted gene list: Empirical FDR = NoFP /R , where NoFP = the n umber of false p ositiv es. Broadly sp eaking, smaller the FDR b etter the technique. 4.1 Prostate data (Singh et al., 2002) studied m = 12625 genes on n = 102 oligon ucleotide microarra ys, comparing n 1 = 50 health y males with n 2 = 52 prostate cancer patien ts. The purp ose of their study w as to identify genes that migh t an- ticipate the clinical b eha vior of Prostate cancer. W e do wnloaded the .CEL files from http://www- genome.wi.mit.edu/MPR/prostate . The soft ware RMAExpress (Irizarry et al., 2003) was used to obtain high qualit y gene expressions from these .CEL files. W e let RMAExpress apply its in-built Submitted to Bioinformatics Desai et al. 10 bac kground adjustment, how ev er, the quan tile normalization was skipp ed. Eac h gene w as represen ted in the final expression matrix X by the loga- rithm (base 10) of its expression level. T aking the log is thought to increase normalit y and stabilize across group standard deviations (Tsai et al., 2003). 4.1.1 Data with kno wn results Algorithm testing required an expression matrix X with the knowledge of truly non-differential genes. A t the same time, we w an ted the inter-gene correlation in X to resem ble that in the real microarray data. These t w o seemingly conflicting requiremen ts w ere satisfied concurrently by ro w stan- dardizing a real X . The prostate cancer matrix X was transformed to e X b y subtracting eac h gene’s a verage resp onse within eac h treatment group, and by normalizing within group sample mean squares. That is, for eac h group k ∈ { 1 , 2 } , (1 /n k ) P j e X ij = 0 and (1 /n k ) P j e X 2 ij = 1. Here, the sum runs o ver corresp onding n k samples only . With this transformation, all genes hav e equal energy and yet the same within group inter-gene correlation structure as the original X . 3 T o generate a test data set from e X , its 102 columns were randomly di- vided into groups of 50 (= n 1 ) and 52 (= n 2 ). Next m u ( m d ) genes were randomly c hosen for up (down) regulation b y adding a p ositiv e (negativ e) offset x u ( x d ) to the corresp onding entries in group 2. V arious c hoices of ( m u , m d , x u , x d ) w ere tested to represent a range of differen tial analysis sce- narios encoun tered in practice. 4.1.2 Results for prostate data Tw o cases were studied. In the first, the prop ortion of truly differential genes, sa y p 1 , w as taken to b e relativ ely small: p 1 ∼ 0.01–0.05. The second case employ ed a larger p 1 ∼ 0.1. The former sim ulates microarray studies seeking genes that distinguish subtypes of cancer, diab etes, etc., whereas the latter resembles studies comparing healthy v ersus diseased cell activity . Results w ere obtained using the subroutines samr.r from the pac k age “samr” and statex.r from the pack age “edge.” Both routines compute their nativ e gene summary statistics given the matrix X and corresp onding col- umn lab els. These statistics, in turn, can b e used to determine top R genes. Case 1 [ p 1 ≈ 0 . 025, m u =200, m d =100, x u =0.1, and x d =-0.1]. Figure 1(a) sho ws plots of the FDRs for 40 different data sets with the size of the re- p orted list, R =300. A large v alue of R coincides with an attempt to extract as man y differential expressions as p ossible, a desired goal esp ecially in mi- croarra y studies p erformed to iden tify genes that are to b e explored further 3 Note. Normalizing within group sample mean squares to unity is not implemented in the T ellipsoid algorithm. Submitted to Bioinformatics Desai et al. 11 – exp erimen tally or computationally – to gain b etter understanding of un- derlying gene net works. Since the differen tial signal x u =0.1 and x d =-0.1 is rather weak, recov ering a go o d list is not easy as eviden t from the results – among all metho ds only T ellipsoid ac hieved sufficien tly lo w FDRs to rescue a few X ’s. 0 10 20 30 40 0 0.5 1 FDR Data index (a) 0 10 20 30 40 0 0.5 1 FDR Data index (b) Figure 1: FDRs for Case 1. The num b er of truly differen tial gene is 300. P anel (a) R =300; P anel (b) R =100. T ellipsoid offers b etter detection. Square ( ) marker = T ellipsoid. Lines: solid = raw t -statistic; dotted = SAM; dashed = EDGE. Figure 1(b) presents results for R =100. A smaller R w ould b e c ho- sen to iden tify high-quality class distinguishing features for gene-expression- profiling-based clinical diagnosis and prognosis, where the goal is to build accurate classifiers and predictors. Whereas Singh et al. (2002) build a clas- sifier around only 16 of 12625 features, they do discuss the need to include as man y reliable features as p ossible. Remark ably , for 37 out of 40 X matrices, T ellipsoid rep orts gene lists with no false disco veries at all, while the other tec hniques fail to obtain a single gene list with an FDR < 0.5. Case 2a [ p 1 ≈ 0 . 1, m u =600, m d =600, x u =0.02, and x d =-0.02]. In this set of exp erimen ts, p 1 is increased, but the differential signal is reduced. This situation also pro ves to b e challenging for the existing techniques. Ho w ever, T ellipsoid pro vides the FDR of ∼ 0 . 5 for R =1200, and, again for R =300, while it rep orts most gene lists with no false discov eries at all. Case 2b [ p 1 ≈ 0.1, m u =600, m d =600, x u =0.1, and x d =-0.1]. This sub case is designed to assess the effects of small sample sizes on performance. n 1 and n 2 are b oth reduced to 20. W e randomly chose 20 columns p er group from the original prostate cancer X , and then applied the data generation pro cess (including row standardization) detailed in Subsection 4.1.1. Reduction in the num b er of samples is comp ensated by increase in the differen tial signal. The FDRs for T ellipsoid, Fig. 3, are excellen t suggesting that T ellipsoid Submitted to Bioinformatics Desai et al. 12 0 10 20 30 40 0 0.5 1 FDR Data index (a) 0 10 20 30 40 0 0.5 1 FDR Data index (b) Figure 2: FDRs for Case 2a. The n umber of truly differential gene is 1200. P anel (a) R =1200; P anel (b) R =300. T ellipsoid performs m uch b etter. Square ( ) marker = T ellipsoid. Lines: solid = raw t -statistic; dotted = SAM; dashed = EDGE. increases p o w er of small sample data sets to o. 4.2 Sim ulated data Before devising the test data setup of Subsection 4.1.1, T ellipsoid w as tested on sev eral simulated data sets. Below w e discuss some simulation results that shed further ligh t on the small sample b eha vior. Let us denote by X ( i ) the i th column of a simulated expression matrix X . W e assume that the random vector X ( i ) is multiv ariate Gaussian with mean 0 and co v ariance matrix W . Each suc h column represents m =3226 genes with a co v ariance matrix W that in tro duces roughly the same amoun t of correlation as found in the BRCA data of Hedenfalk et al. (2001). W e c ho ose m u = 50 , m d = 50 , x u = 1 , x d = − 1 , n 1 = 10, and n 2 = 10. Figure 4 sho ws plots of the FDRs for R =50 and R =100. T able 1 shows results for some X realization from Fig. 4(b). Sho wn are the top 100 v alues of ˆ u ∗ i and each corresp onding original t i with concomitant rank. With smaller n , preeminence of T ellipsoid with resp ect to existing tec hniques scales do wn a bit. Nevertheless, for R =50 case, for 25 out of 40 simulated X realizations, T ellipsoid achiev es a lo w FDR of ∼ 0.1 or less. In terestingly , with a smaller n , SAM outp erforms the other t w o tech- niques. This is not entirely surprising as a smaller n can make the noise in the p er gene p ooled v ariance s i (and p ossibly the equiv alent quan tity in the EDGE algorithm) more prominent. Nev ertheless, SAM do es mitigate this issue in some measure b y using the exchangeabilit y factor s 0 to adjust the effectiv e p o oled v ariance (T usher et al., 2001). Submitted to Bioinformatics Desai et al. 13 1–50 51–100 ˆ u ∗ i rank ˆ u ∗ i t i t i rank ˆ u ∗ i rank ˆ u ∗ i t i t i rank 1 4.22 5.87 1 51 2.18 3.45 23 2 -4.17 -5.55 2 52 2.17 3.05 42 3 -3.93 -4.26 5 53 2.16 2.80 82 4 -3.74 -4.12 7 54 -2.15 -2.57 122 5 -3.58 -4.49 4 55 2.15 1.96 357 6 -3.49 -3.34 28 56 -2.14 -1.47 751 7 -3.45 -4.25 6 57 2.13 2.25 229 8 3.35 3.87 10 58 2.13 1.77 486 9 -3.33 -3.20 35 59 2.13 1.44 785 10 3.33 3.77 13 60 2.12 2.14 273 11 3.25 3.42 25 61 -2.11 -1.48 744 12 -3.16 -2.18 260 62 2.10 1.80 453 13 3.14 4.54 3 63 2.09 2.60 114 14 3.10 2.87 65 64 -2.09 -2.05 312 15 -3.08 -3.54 17 65 2.09 2.70 96 16 -3.07 -2.80 80 66 2.09 2.23 237 17 3.06 3.49 20 67 2.08 2.34 188 18 3.02 2.29 213 68 -2.08 -2.24 232 19 -2.99 -3.34 27 69 -2.06 -2.53 130 20 -2.93 -3.13 38 70 -2.04 -2.11 283 21 -2.92 -2.92 57 71 -2.04 -2.95 54 22 2.86 3.26 31 72 -2.03 -3.08 40 23 -2.83 -2.82 74 73 -2.02 -2.30 210 24 2.82 2.37 180 74 -2.01 -3.67 15 25 -2.81 -2.13 276 75 2.00 2.62 109 26 2.81 3.48 21 76 -1.98 -2.38 171 27 -2.79 -3.01 47 77 1.98 1.43 795 28 2.70 2.87 64 78 1.96 1.69 549 29 -2.66 -3.15 37 79 -1.95 -1.47 746 30 -2.58 -3.85 11 80 1.95 1.95 361 31 -2.56 -2.84 71 81 1.95 2.81 77 32 -2.55 -1.72 524 82 -1.94 -1.41 813 33 -2.54 -2.63 106 83 1.94 3.40 26 34 -2.54 -2.69 98 84 1.94 1.30 948 35 2.53 2.30 209 85 -1.94 -3.27 30 36 2.48 2.45 148 86 -1.93 -1.11 1190 37 -2.47 -2.29 212 87 -1.93 -1.37 872 38 -2.46 -3.21 33 88 -1.93 -3.44 24 39 -2.43 -2.44 154 89 -1.92 -3.07 41 40 2.43 2.71 94 90 -1.92 -1.50 726 41 2.40 2.86 66 91 1.90 3.62 16 42 -2.34 -2.60 115 92 -1.90 -2.82 75 43 -2.34 -2.98 50 93 1.89 1.25 1007 44 -2.33 -3.80 12 94 1.87 3.89 8 45 -2.32 -2.06 306 95 -1.86 -3.49 19 46 2.29 1.81 444 96 -1.86 -2.08 300 47 -2.27 -1.17 1110 97 1.85 1.20 1074 48 2.26 1.97 347 98 -1.83 -2.90 60 49 2.24 3.75 14 99 1.83 1.39 833 50 2.20 3.88 9 100 -1.82 -1.95 367 T able 1: T ellipsoid in action with T op 100 ˆ u ∗ i ’s. Corresponding t i ’s and their rank are also sho wn. The results are for some X realization from Fig. 4(b). T ellipsoid = 22 NoFPs; raw t -statistics = 68 NoFPs. T ruly null genes are prin ted in b old-sans t yp eface. Submitted to Bioinformatics Desai et al. 14 0 10 20 30 40 0 0.5 1 FDR Data index (a) 0 10 20 30 40 0 0.5 1 FDR Data index (b) Figure 3: FDRs for Case 2b. Panel (a) R =1200; Panel (b) R =300. The sample size is smaller than that in Cases 1 & 2a and yet T ellipsoid p erforms w ell. Square ( ) marker = T ellipsoid. Lines: solid = raw t -statistic; dotted = SAM; dashed = EDGE. 4.3 Discussion By allo wing researchers to examine the sim ultaneous expressions of enor- mous n um b ers of genes, microarrays promised to revolutionize the under- standing of complex diseases and usher in an era of p ersonalized medicine. Ho wev er, the shift in p erception of that promise is palpable in the literature. A 1999 Natur e Genetics article (Lander, 1999) is entitled “Array of hop e,” but a 2005 Natur e R eviews article (F rantz, 2005) is entitled “An arra y of problems.” It is not unusual for impacts of new technologies to b e o veres- timated when first deploy ed, then to ha ve the exp ectations moderated as the technologies reveal new complexities in the problems they are designed to solv e. In the study of microarray data, the need for exceeding care in the design and regularization of exp erimen ts and data collection are un- dersto od to b e critical, but the biggest hindrance to progress has b een the data interpretation. In particular, as Efron (2007) and Owen (2005) p oin t out, the biggest challenge seems to b e the treatment of intrinsic in ter-gene correlation. In most microarra y data there are at least three vital resources: (i) iden tifiability (ii) immense parallel structure, and (iii) inter-gene correlation itself. Thoughtful analyses in the pap ers by Efron (Efron, 2005, 2000) hav e suggested this view of the rich information structure inheren t in the data. In this ligh t, T ellipsoid can b e view ed as exploiting more than correlation as a means of sharing information across tests, as it also in v olves iden tifiabilit y . A crucial step in formulating T ellipsoid w as the comprehension of the effects of inter-gene correlation on Co v ( t i , t i 0 ). In light of Observ ations 1–3, the choice of the Mahalanobis distance was intuitiv e, as it is already kno wn Submitted to Bioinformatics Desai et al. 15 0 10 20 30 40 0 0.5 1 FDR Data index (a) 0 10 20 30 40 0 0.5 1 FDR Data index (b) Figure 4: FDRs for simulated data. P anel (a) R =100; P anel (b) R =50. (Small) sample sizes: n 1 =10, n 2 =10. Y et, T ellipsoid p erforms b etter than the rest. Square ( ) mark er = T ellipsoid. Lines: solid = ra w t -statistic; dotted = SAM; dashed = EDGE. to give computationally attractiv e solutions through the matrix in version lemma. Limited time and resources – and p erhaps also the necessit y for scien tific fo cus – often require biomedical researchers to work on only a small num b er of “hot (gene) prosp ects.” Even under such highly conserv ative conditions, ho wev er, misleading results can o ccur, as evident in the results of Figs. 1 – 4. F or all their careful developmen t and statistical p o w er, even state-of-the- art to ols lik e EDGE and SAM can rep ort spurious gene lists. The extra statistical p o wer of T ellipsoid promises to further guard against anomalous results that can hav e serious consequences for the tra jectory of a study of gene function, causation, and interaction. 5 Conclusion This pap er has rep orted the dev elopment and testing of a no vel framework for the detection of differential gene expression. The framew ork combines the exploitation of inter-gene correlation to share information across tests, with identifiabilit y – the fact that in most microarray data sets, a large pro- p ortion of genes can b e iden tified a priori as non-differential. When applied to the widely used tw o-sample t -statistic approach, this viewpoint yielded an elegant differential analysis tec hnique, T ellipsoid, which requires as in- puts only a gene expression matrix, related t wo-sample lab els, and the size of desired gene-list R . T ellipsoid was tested on the prostate cancer data of Singh et al. (2002) and some simulated data. Compared to SAM (T usher et al., 2001), EDGE (Storey et al., 2007), and the ra w t -statistic approac h it- Submitted to Bioinformatics Desai et al. 16 self, T ellipsoid shows substan tial improv emen t in statistical p o wer. Usually , with increase in microarray samples, p o wer tends to increase considerably , but, even for small sample sizes, T ellipsoid’s p erformance improv emen t is noticeable. The softw are (co ded in MA TLAB and in R) and test data sets are a v ailable at www.egr.msu.edu/ ~ desaikey . F unding KD is supp orted b y a graduate researc h fello wship from the Quantitativ e Biology Initiativ e at Michigan State Universit y . Ac kno wledgemen t W e are grateful to the anonymous reviewers of an earlier publication (Desai et al., 2007) for their insightful remarks that seeded this work. W e also appreciate the supp ort of the Mic higan State Universit y High Performance Computing Cen ter. APPENDIX Supp ose that Σ − 1 = A B C D and ˜ u (1) = t (1) − u (1) . (A-1) W e also hav e C = B T . Substituting these in Eqn. 6 yields: ˜ u ∗ (1) = argmin ˜ u (1) ∈ R m − c t T (0) A t (0) + 2 ˜ u T (1) Ct (0) + ˜ u T (1) D ˜ u (1) . (A-2) In Eqn. A-2, b y setting the gradient w.r.t ˜ u (1) to 0, w e obtain: ˜ u ∗ (1) = − C T D − 1 t (0) . (A-3) No w for Σ − 1 , we can app eal to the matrix inv ersion lemma (Golub and V an Loan, 1996): Σ − 1 = Σ − 1 (00) 1 + Σ (01) Q − 1 Σ (10) Σ − 1 (00) − Σ − 1 (00) Σ (01) Q − 1 − Q − 1 Σ (10) Σ − 1 (00) Q − 1 ! , where Q = Σ (11) − Σ (10) Σ − 1 (00) Σ (01) . Plugging this in Eqn. A-3 yields: ˜ u ∗ (1) = Σ (10) Σ − 1 (00) t (0) . (A-4) Com bining Eqn. A-4 with Eqn. A-1 provides the desired expression: u ∗ (1) = t (1) − Σ (10) Σ − 1 (00) t (0) . Submitted to Bioinformatics Desai et al. 17 References Y. Benjamini and Y. Ho c hberg. Controlling the false discov ery rate: a practical and p o werful approach to multiple testing. Journal of the R oyal Statistic al So ciety. Series B. Metho dolo gic al , 57(1):289–300, 1995. X. Cui, J.T.G. Hwang, J. Qiu, N.J. Blades, and G.A. Churc hill. Improv ed statistical tests for differential gene expression b y shrinking v ariance com- p onen ts estimates. Biostatistics , 6(1):59–75, 2005. J.R. Deller Jr, J.G. Proakis, and J.H. Hansen. Discr ete Time Pr o c essing of Sp e e ch Signals . Prentice Hall PTR Upp er Saddle Riv er, NJ, USA, 1993. K. Desai, J.R. Deller, Jr., and J.J. McCormick. The distribution of the n umber of false disco veries in highly correlated dna microarra y data. Sub- mitte d to the A nnals of Applie d Statstics, pr eprint at http: // www. egr. msu. edu/ ~ desaikey , 2007. P .A. Devijv er and J. Kittler. Pattern R e c o gnition: A Statistic al Appr o ach . Englew o o d Cliffs, New Jersey etc, 1982. S. Dudoit, Y.H. Y ang, M.J. Callow, and T.P . Sp eed. Statistical metho ds for iden tifying differentially expressed genes in replicated cDNA microarray exp erimen ts. Statistic a Sinic a , 12(1):111–139, 2002. B. Efron. RA Fisher in the 21st Century. Statistics for the 21st Century: Metho dolo gies for Applic ations of the F utur e , 1:09, 2000. B. Efron. Large-Scale Simultaneous Hyp othesis T esting: The Choice of a Null Hyp othesis. Journal of the Americ an Statistic al Asso ciation , 99(465): 96–105, 2004. B. Efron. Bay esians, F requen tists, and Scientists. Journal of the Americ an Statistic al Asso ciation , 100(469):1–6, 2005. B. Efron. Microarra ys, Empirical Ba yes, and the Two-Groups Model. Pr eprint, Dept. of Statistics, Stanfor d University , 2006. B. Efron. Correlation and Large-Scale Simultaneous Significance T esting. Journal of the A meric an Statistic al Asso ciation , 102(477):93–103, 2007. B. Efron, R. Tibshirani, J.D. Storey , and V. T usher. Empirical Bay es Anal- ysis of a Microarra y Experiment. Journal of the Americ an Statistic al Asso ciation , 96(456):1151–1161, 2001. S. F rantz. An arra y of problems. Nat R ev Drug Disc ov , 4(5):362–3, 2005. G.H. Golub and C.F. V an Loan. Matrix Computations . Johns Hopkins Univ ersity Press, 1996. Submitted to Bioinformatics Desai et al. 18 I. Hedenfalk, D. Duggan, Y. Chen, et al. Gene-Expression Profiles in Hered- itary Breast Cancer. New England Journal of Me dicine , 344(8):539–548, 2001. R.A. Irizarry , B.M. Bolstad, F. Collin, L.M. Cope, B. Hobbs, and T.P . Sp eed. Summaries of Affymetrix GeneChip prob e level data. Nucleic A cids R ese ar ch , 31(4):e15, 2003. M.K. Kerr, M. Martin, and G.A. Churc hill. Analysis of V ariance for Gene Expression Microarra y Data. Journal of Computational Biolo gy , 7(6): 819–837, 2000. E.S. Lander. Array of hop e. Natur e Genetics , 21(1):3–4, 1999. M. Langaas, E. F erkingstad, and B.H. Lindqvist. Estimating the prop ortion of true null hypotheses, with application to DNA microarray data. J R oy Stat So c, Series B , 67:555–72, 2005. M.L.T. Lee, F.C. Kuo, GA Whitmore, and J. Sklar. Imp ortance of replica- tion in microarray gene expression studies: Statistical metho ds and evi- dence from rep etitiv e cDNA hybridizations. Pr o c e e dings of the National A c ademy of Scienc es of the Unite d States of Americ a , 97(18):9834, 2000. J.T. Leek, E. Monsen, A.R. Dabney , and J.D. Storey . EDGE: extraction and analysis of differen tial gene expression, 2006. I. Lonnstedt and T. Sp eed. Replicated microarray data. Statistic a Sinic a , 12(1):31–46, 2002. P .C. Mahalanobis. On the generalized distance in statistics. Pr o c Natl Inst Sci India , 2(1):49–55, 1936. MA Newton, CM Kendziorski, CS Ric hmond, F.R. Blattner, and KW Tsui. On Differential V ariabilit y of Expression Ratios: Improving Statistical Inference about Gene Expression Changes from Microarra y Data. Journal of Computational Biolo gy , 8(1):37–52, 2001. A.B. Ow en. V ariance of the n umber of false discov eries. Journal of the R oyal Statistic al So ciety Series B , 67(3):411–426, 2005. Y. Pa witan, K.R.K. Murth y , S. Michiels, A. Ploner, and O. Journals. Bias in the estimation of false disco very rate in microarra y studies. Bioinfor- matics , 21(20):3865–3872, 2005. D. Singh, P .G. F ebb o, K. Ross, et al. Gene expression correlates of clinical prostate cancer b eha vior. Canc er Cel l , 1(2):203–209, 2002. J.D. Storey . A direct approac h to false discov ery rates. Journal of the R oyal Statistic al So ciety Series B(Statistic al Metho dolo gy) , 64(3):479–498, 2002. Submitted to Bioinformatics Desai et al. 19 J.D. Storey , J.Y. Dai, and J.T. Leek. The optimal discov ery pro cedure for large-scale significance testing, with applications to comparative microar- ra y exp erimen ts. Biostatistics , 8(2):414, 2007. R. Tibshirani and L. W asserman. Correlation-sharing for detection of dif- feren tial gene expression. Arxiv pr eprint math.ST/0608061 , 2006. C.A. Tsai, Y.J. Chen, J.J. Chen, and O. Journals. T esting for differen tially expressed genes with microarra y data. Nucleic A cids R ese ar ch , 31(9):e52, 2003. V. T usher, R. Tibshirani, and C Ch u. Significance analysis of microar- ra ys applied to ionizing radiation response. Pr o c e e dings of the National A c ademy of Scienc es , 98:5116–5121, 2001.
Original Paper
Loading high-quality paper...
Comments & Academic Discussion
Loading comments...
Leave a Comment