A unifying view for performance measures in multi-class prediction
In the last few years, many different performance measures have been introduced to overcome the weakness of the most natural metric, the Accuracy. Among them, Matthews Correlation Coefficient has recently gained popularity among researchers not only …
Authors: Giuseppe Jurman, Cesare Furlanello
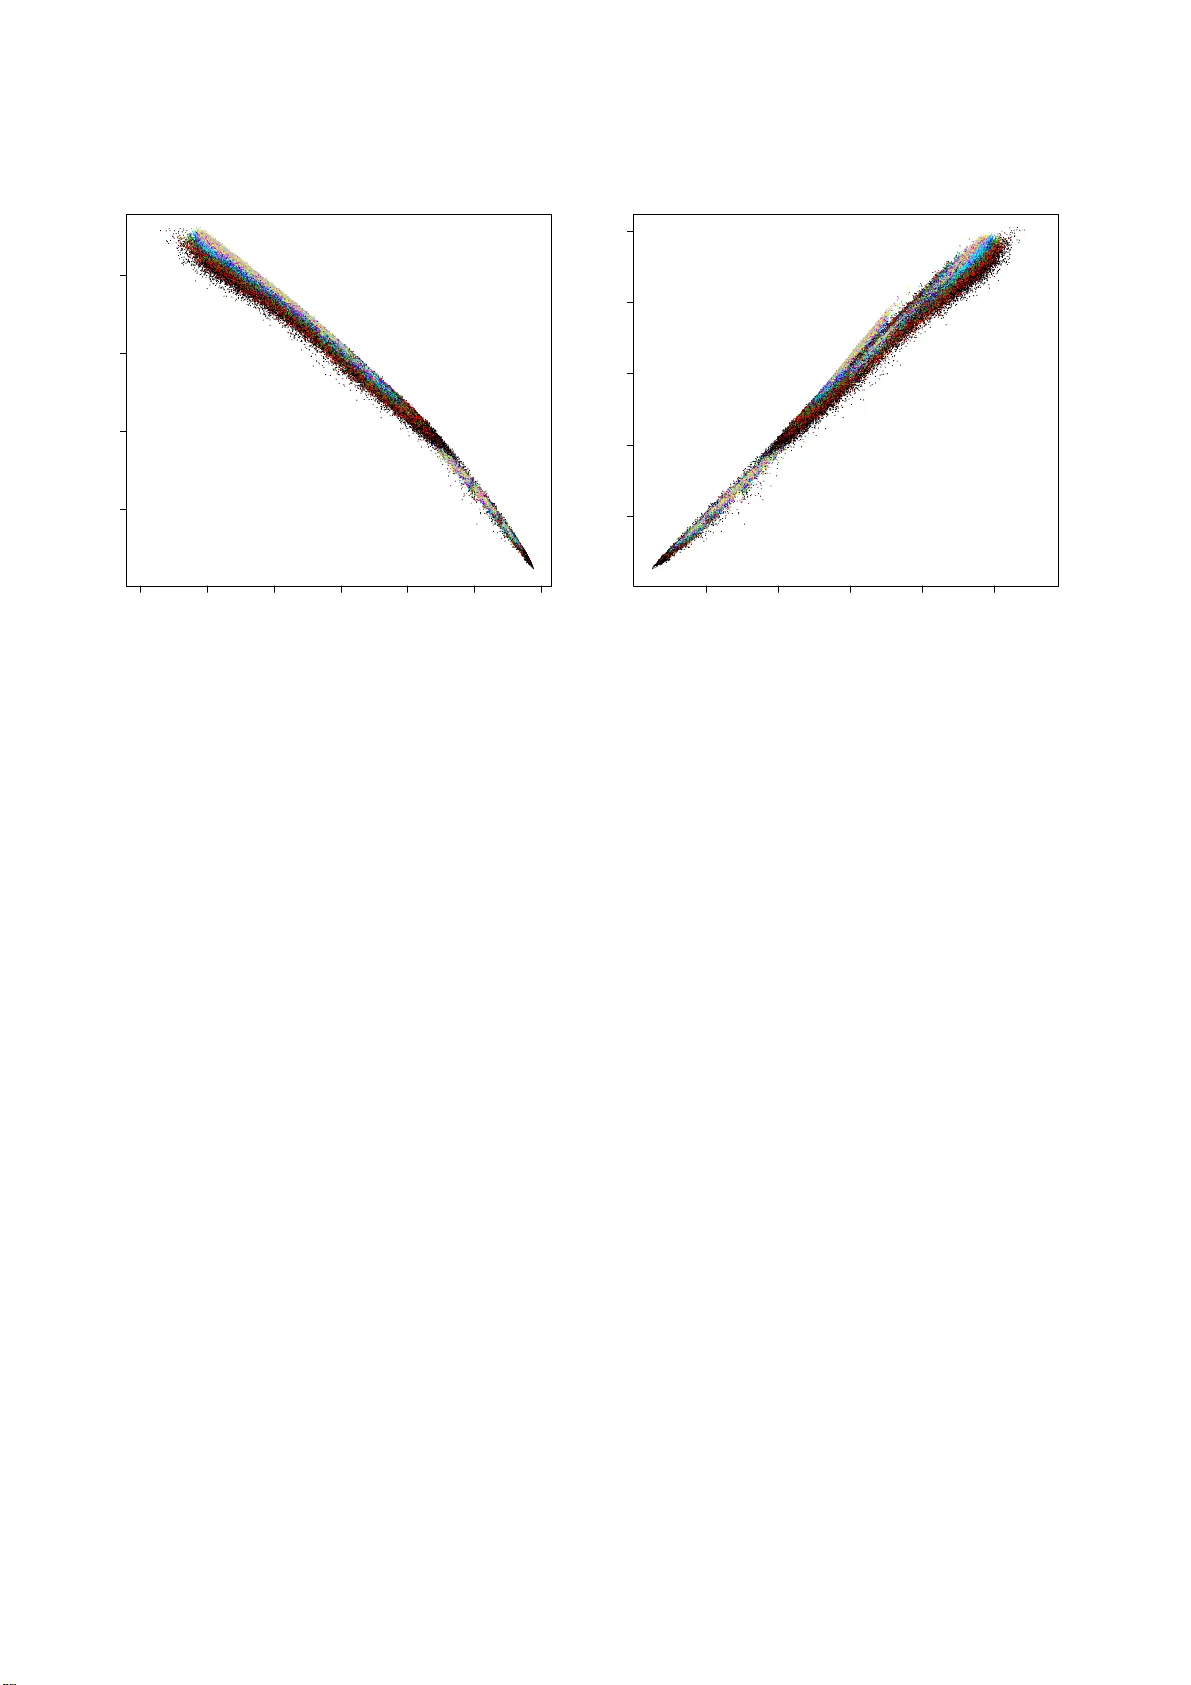
A unifying vie w for performance measures in multi-class prediction Giuseppe Jurman , Cesare Furlanello ∗ F ondazione Bruno K essler , T r ento, Italy Abstract In the last fe w years, many di ff erent perfor mance measures hav e b een in troduced to overcom e the weakne ss of the most natural metric, the Accuracy . Among them, Matthews Correlation Coe ffi cient has recently gained p opular ity amo ng re searchers not only in machin e learnin g but also in several application fields such as bioinfor matics. Nonetheless, fu rther novel functions ar e being propo sed in liter ature. W e show that Confusion Entr opy , a recently intro duced classifier performan ce m easure fo r multi-c lass problem s, has a stro ng (mon otone) relation with the multi-cla ss generalizatio n of a classical metric, the Matthews Correlation Coe ffi cient. Computationa l evidence in suppo rt of the claim is provided, together with an outline of the theore tical e xplan ation. K eyw ords: Matthews Correlation Coe ffi cient, Conf usion Entropy , classifier performan ce maeasure. 1. Introduction One of the majo r task in machine learning is the com- parison of classifiers’ p erform ance. This comp arison can be carried out eith er by means of statistical tests ( Dem ˇ sar, 20 06; Garc´ ıa & Herrera, 2 008) o r u sing a perfor mance measure as an indicator to der i ve similarities and d i ff erences. For binary problem s, a numb er of mean ingful metric s are available an d their properties are well understood . On the other hand, the definition of perfo rmance measures in th e context of multi- class class ification is still an op en r esearch topic, alth ough se veral functio ns ha ve been proposed in the last few years: see (Sokolova & Lapalm e, 2009; Ferri et al., 2009) fo r two comparin g revie ws, (Felkin, 2007) for a d iscussion of the di ff erences between the use of the same classifier on a binary and a multi-class task and (Diri & Albayrak, 2 008) fo r a n alternative grap hical co mparison approach. As an e xamp le, one of the mo st impo rtant m easures for binary classifier , the Area Under the Curve ( A UC) ( Hanley & McNeil, 1 982; Bradley, 1 997) associated to the Receiver Operating Charac- teristic curve has no automatic extension to the multi-class case. Although an agreed re asonably average-based build extension exists (presented in (Han d & T ill, 200 1)), se veral alternative form ulations are being presented, e ither based on a multi-class R OC approx imation (Everson & Fieldsend, 2 006; Landgr ebe & Duin, 200 5, 20 06, 2008)) or by v iewing the R OC as a surface wh ose volume (V olume Un der the Su rface, VUS) has to be computed (by exact integration or p olynom ial approx imation) as in (Ferri et al., 20 03; V an Calster et al., 2008; Li, 20 09). Other m easures are mo re n aturally defined, starting f rom the accura cy ( A CC, i.e. the fraction of correctly predicted samples) and th e similar Global Perf ormance In dex ∗ Correspondi ng author Email addr esses: jurman@f bk.eu (Giuseppe Jurman), furlan @fbk.eu (Cesare Furlanell o) (Freitas et al., 2007 a,b)), to the Matthews correlation coe ffi - cient (MCC). This latt er function w as introduced in (Matthe ws, 1975) and it is also known as th e φ -coe ffi cient, co rrespon ding for a 2 × 2 contingen cy table to the sq uare roo t o f the average χ 2 statistic p χ 2 / n . MCC has rec ently attracted the attention of the machine learnin g community (Baldi et al., 2000) as on e of the best method to summarize into a single value the confusion matrix of a binary classification task. Its use as o ne of the pre- ferred classifier p erform ance measure as in creased since the n, and fo r instance it has been chosen (tog ether with A UC) as the electiv e metric in the US FDA-led initiative MA QC-II aimed at reach ing consensus o n the best practices fo r development and validation of p redictive models based on microa rray gene expression a nd genotyp ing data for personalized m edicine (The MicroArr ay Quality C on trol (MA QC) Conso rtium, 2010). A gen eralization to the m ulti-class case was de fined in (Gorodkin, 2 004), later u sed also fo r co mparing network topolog ies (Supper et al., 2007; Stokic et al., 2009). Finally , another interesting set of measures that ha ve a natural definition for multi-class confusion matrices consists of th e functions derived from the conce pt of (in formatio n) entropy , first intro- duced by Shannon in his famous paper (Shannon, 1948). Many measure hav e been de fined in the classification framework based on the entr opy function, from simple r ones such as th e confusion ma trix entro py (v an Son, 1994), to more complex expressions as th e transmitter information (Abramson, 19 63) or th e relati ve classifier information (RCI) (Sindhwani et al., 2001). A n ovel multi-class measu re belo nging to this set has been recently in troduced un der the n ame o f Confusion Entropy (CEN) b y W ei a nd colleag ues in (W ei et al., 2010a,b): in this work, the authors c ompare their measur e to R CI and accuracy , and they prove CEN to be superior in discriminative power and p recision to both alterna ti ves in terms of two statistical ind icator called degree of co nsistency a nd degree of discriminacy , defined in (Huang & Ling, 2005). Nove mber 26, 2024 In the present work we in vestigate the similar ity be tween Confusion Entropy and Matthews correlation coe ffi c ient. In particular, we experimentally show that the two measu res are strongly correlated , and their relation is globally mono tone and locally almost linear . Moreover , we provide a brie f ou tline of the mathem atical links between C EN an d MCC. 2. Conf usion Entropy and Matthews Correlatio n Coe ffi - cient Giv en a classification p roblem on S samples S = { s i : 1 ≤ i ≤ S } an d N classes { 1 , . . . , N } , define the two functions tc , pc : S → { 1 , . . . , N } indicating for each sample s its tr ue class tc( s ) and its predicted class p c( s ), re spectiv ely . The c or- respond ing co nfusion matrix is the sq uare matrix C ∈ M ( N × N , N ) who se i j -th entry C i j is the number of eleme nts of true class i that have been assigned to class j by the classifier: C i j = |{ s ∈ S : tc( s ) = i and pc( s ) = j } | . The most natural perform ance measure is the accuracy , defined as the r atio of the co rrectly classified samples over all the sam- ples: A CC = N X k = 1 C kk S = N X k = 1 C kk N X i , j = 1 C i j . In in formatio n theory , the e ntropy H associated to a rando m variable X is the expected value of the self-inform ation I of X : H ( X ) = E ( I ( X )) = X x ∈ X h b ( x ) = − X x ∈ X p ( x ) log b ( p ( x )) , where p ( x ) is the p robability mass function of X , with the position h b ( x ) = 0 for p ( x ) = 0, motivated by the limit lim x → 0 x log( x ) = 0. The C on fusion Entropy measure CEN for a confusion matrix C is defin ed in (W ei et al. , 2010a) as: CEN = N X j = 1 P j N X k = 1 k , j h 2( N − 1) ( P j jk ) + h 2( N − 1) ( P j k j ) , (1) where the misclassification pr obabilites P are defined as the fol- lowing ratios: P j i j = C i j N X k = 1 C jk + C k j P i ii = 0 P i i j = C i j N X k = 1 C ik + C ki P j = N X k = 1 C jk + C k j 2 N X k , l = 1 C kl . This measure ranges between 0 (perfect classification) and 1 for the extreme m isclassification case C i j = (1 − δ i j ) F , for F ∈ N (this ho lds for N > 2, while it is n ot tru e anymore for N = 2, see Subsec.2.1). Let X , Y ∈ M ( S × N , F 2 ) be two m atrices where X sn = 1 if the sample s is predicted to o f cla ss n ( pc( s ) = n ) a nd X sn = 0 otherwise, and Y sn = 1 if s amp le s belongs to class n (tc( s ) = n ) and 0 otherwise. Using Kronecker’ s delta fun ction, the defini- tion becomes: X = δ pc( s ) , n sn Y = δ tc( s ) , n sn . Then the Matthews Correlation Coe ffi cient MCC can be defined as the ratio: MCC = cov( X , Y ) √ cov( X , X ) · cov( Y , Y ) , where cov( · , · ) is the covariance function . In term s of the con- fusion matrix, the above equation can be written as: MCC = N X k , l , m = 1 C kk C ml − C lk C km v u u u u u u u t N X k = 1 N X l = 1 C lk N X f , g = 1 f , k C g f v u u u u u u u t N X k = 1 N X l = 1 C kl N X f , g = 1 f , k C f g (2) MCC li ves in the range [ − 1 , 1], where 1 is perf ect classifi cation , − 1 is reac hed in the alter native extreme misclassification case of a con fusion matrix with all zero s but in two symmetric en- tries C ¯ i , ¯ j , C ¯ j , ¯ i , and 0 wh en th e co nfusion matrix is all zeros but for one single column (all samples have been classified to be of a c lass k ), or wh en all en tries ar e equal C i j = K ∈ N . In this last case, the Conf usion En tropy value is 1 − 1 N log 2 N − 2 2 N ; when only a single column is not zero, the Confusion Entropy can a ssume many di ff erent values, depend ing on th is co lumn’ s entries. Note that both measures are inv arian t for scalar multi- plication of the whole confusion matrix. CEN is indeed more discrimin ant than MCC in some sit- uations, for instance when MCC = 0 as m entioned above, or wh en th e nu mber of samples is r elativ ely small and th us it more likely to ha ve di ff erent confusion m atrices with the same MCC an d di ff eren t CEN. This can be quantitatively as- sessed by using the degree of discriminatio n introduced in (Huang & Ling, 2005): fo r two measures f and g on a dom ain Ψ , let P = { ( a , b ) ∈ Ψ × Ψ : f ( a ) > f ( b ) , g ( a ) = g ( b ) } and Q = { ( a , b ) ∈ Ψ × Ψ : f ( a ) = f ( b ) , g ( a ) > g ( b ) } ; then the degree of d iscriminancy for f over g is | P | / | Q | . For instance, in the 3-classes case with 2 , 4 , 3 samp les respectively , th e de- gree of discriminancy of CEN over MCC is a bout 6 . A sim ilar behaviour ha ppens f or all the 12 small sample size cases on three c lasses listed in (W ei et al., 2010 a , T ab. 6), rang ing fro m 9 to 19 samples. In th e same paper (Huang & Ling, 2 005), another indicator for comparing d istances is defined, th e de- gree of consistency: for two measures f and g on a d omain Ψ , let R = { ( a , b ) ∈ Ψ × Ψ : f ( a ) > f ( b ) , g ( a ) > g ( b ) } and 2 S = { ( a , b ) ∈ Ψ × Ψ : f ( a ) > f ( b ) , g ( a ) < g ( b ) } ; then the degree of consistency of f and g is | R | / ( | R | + | S | ). A quite di ff erent behaviour between the two measures can be highligh ted in th e following situation : con sider the matrix Z A with all entries are equal but a non-d iagonal o ne; because of the multiplicative in variance, we can set all entries to one b ut for the one in the leftm ost lo wer cor ner: ( Z A ) i j = 1 + δ ( i , j ) , ( N , 1) ( A − 1) for A ≥ 1 a po siti ve integer . When A grows bigger, more and more samples are misclassified: f or instance, the correspond ing accuracy reads ACC( Z A ) = N / ( N 2 + A − 1) , th us decreasing tow ards zero for increasing A . The MCC measure of this conf usion matrix is MCC( Z A ) = − A − 1 ( N − 1)( N 2 − 2 A − 2) , which is a function monotonically decre asing for increasing values of A , with limit − 1 / ( N − 1) for A → ∞ . On the other hand, the Confusion Entropy for the s ame family of matrices is CEN( Z A ) = 1 N 2 + A − 1 ( N − 2)( N − 1) log 2 N − 2 (2 N ) + (2 N + A − 3) log 2 N − 2 (2 N + A − 1) − A log 2 N − 2 ( A ) , which is a decreasing function of increasing A , asymptotically moving to wards zero , i.e., the min imal entropy ca se. Thu s in this case, the be haviour of the Con fusion Entropy is the o ppo- site than th e one of mor e classical measur es such as MCC and accuracy . Analogou sly for the case of (perfectly) random classification on a unbalan ced problem : because o f the multiplicative in vari- ance of the m easures, we can assum e that the con fusion matrix for this case has all entries equ al to one but for the last r ow , whose entries are all A , for A ≥ 1 . In this case, the Confusion Entropy is CEN = N − 1 2 N ( N + A − 1) (2 N + A − 3) log 2 N − 2 (2 N + A − 1) − 2 A log 2 N − 2 A + ( A + 1) log 2 N − 2 ( N + N A + A − 1) , which is a decreasing fun ction f or growing A wh ose limit for A → ∞ is N − 1 2 N log 2 N − 2 N + 1 (as a function of N , this limit is an increasing function asympto tically growing to wards 1 / 2). One of the main features of th e MCC measure is the fact that MCC = 0 iden tifies all those case where rand om classifica- tion ( i.e., n o learn ing) happe ns: this is lost in the case of CEN, due to its gr eater discriminant power - ther e is no uniqu e v alue associated to the wide spectrum of rando m classification. Consider now the confusion matrix B of dimension N wher e B ji = F + ( T − F ) δ i j , i.e. all entries h av e value F but in th e diagona l who se values are all T , fo r T , F two integers. In this case, MCC = T 2 + ( N − 2) T F − ( N − 1) F 2 [ T + ( N − 1 ) F ] 2 CEN = ( N − 1) F T + ( N − 1) F log 2 N − 2 2[ T + ( N − 1) F ] F , and thus CEN = (1 − MCC) 1 + log 2 N − 2 T + ( N − 1) F ( N − 1) F ! 1 − 1 N ! . This identity can be relaxed to the f ollowing gen eralization, which is a slight under estimate of the true CEN value: CEN ≃ 1 k · (1 − MCC) 1 + lo g 2 N − 2 N X i , j = 1 C i j N X i , j = 1 i , j C i j 1 − 1 N ! ≃ 1 k · (1 − MCC) 1 − log 2 N − 2 (1 − A CC) 1 − 1 N ! (3) where both sides are zero when MCC = A CC = 1, and k = 1 . 012 · 1 + 0 . 18924 log( N ) − 0 . 06694 log 2 ( N ) . For simplicity sake, we call th e right member of Eq. 3 tran sformed MMC, tMCC for short. T o show that th e relation in Eq. 3 is valid in a wide r ange of situations, an experim ent h as been p erform ed, whose result is graphically r eported in Fig. 1, In details, 2 00.00 0 con fusion matrices in dimensions ranging fro m 3 to 3 0 have b een gen - erated with the f ollowing setu p: th e num ber correctly classi- fied elements ( i.e., th e d iagonal elements) fo r each class has been (uniformly ) random ly chosen between 1 and 1000, while each non-diago nal entry has been chosen as a rand om inte- ger between 1 and ⌊ 1000 ρ i ⌋ , where the ratio ρ i for the i -th matrix M i was extracted from the unif orm distribution in the range [0 . 01 , 1 ]. The correlation between tMCC and k · CEN is 0.99 4147 7 and the degree of consistency is 1 − 1 0 − 7 (the degree o f discrimin ancy is u ndefined since n o ties occu rred). In particula r , the average ratio between tMMC and k · CEN is 1.0005 08, with 95% bootstrap Student co nfidence interval (1 . 000 328 , 1 . 000711). 2.1. The bina ry case In the binary case of two classes positiv e ( P ) and negative ( N ), the confusion matrix becomes TP FN FP TN , where T and F stands for true and false respectiv ely . In this setup, the Matthews co rrelation coe ffi cient has the fol- lowing shape: MCC = TP · TN − FP · FN √ ( TP + FP ) ( TP + FN ) ( TN + FP ) ( TN + FN ) . Similarly , the Confusion Entro py can be written as: CEN = (FN + FP) lo g 2 ((TP + TN + FP + FN) 2 − (TP − TN) 2 ) 2(TP + TN + FP + FN) − FN log 2 FN + FP log 2 FP TP + TN + FP + FN . Note th at in th e case TP = TN = T a nd FP = FN = F , the Confusion Entropy reads CEN = F T + F log 2 2( T + F ) F , 3 −0.2 0.0 0.2 0.4 0.6 0.8 1.0 0.2 0.4 0.6 0.8 MCC CEN 0.2 0.4 0.6 0.8 1.0 0.2 0.4 0.6 0.8 1.0 tMCC kCEN Figure 1: Plot of CEN versus MCC (left) and k · CE N versus tMCC (right) for 200.000 random confusion matrices. Each dot repre sents a confusion matrix, and the color indicate s the matrix dimensio n. which is bigger than 1 when the ratio T / F is smaller than 1. This me ans that a ll the confusion matrices T F F T with 0 < T < F ha ve a c onfusion entropy larger than 1, attained for the totally misclassified case T = 0. Such behaviour m akes CEN unusable as a classifier perfo rmance measure in the binary case. 3. Conclusions Accuracy , Matthews Correlation Coe ffi c ient and Confusion Entropy are th ree cr ucial perform ance measures for e valuating the outcom e of a classification task, both on b inary and multi- class pro blems (the fourth on e is Area Under the Cur ve, when- ev er a R OC curve can be drawn). Althou gh the y sho w a mutual consistent behaviour, each of them is b etter tailored to deal with di ff erent situations. Accuracy is by far th e simplest one , and its role is to con- vey a first ro ugh estimate o f the classifier goo dness. I ts use is widespread among the scien tific liter ature, but it su ff er s from se veral ca veats, the most rele vant being the inab ility to cope with unbala nced classes and thus the impossibility of distin- guish among di ff eren t kinds of misclassifications. Confusion Entropy , on the o ther h and, is probably th e finest measure and it sh ows an extremely high level of discriminancy ev en b etween very similar confusion matr ices. Howe ver , th is feature is not alw ays w elcomed, b ecause it m akes the interpre- tation of its value quite harder, expecially when considering sit- uations that are natur ally very similar (e .g, all th e cases with MCC = 0). Mor eover , CEN may show erratic beh aviour in th e binary case. In th is spirit, the Matthews Correlatio n Coe ffi cient is a g ood compro mise between reachin g a reaso nable discriminancy de- gree amo ng di ff eren t cases, and th e need f or the p ractitioner of a easily interpr etable value expressing th e type of m isclassifi- cation associated to the cho sen classifier o n the g iv en task. W e showed here that there is a strong linear relation between CEN and a logarithmic fu nction of MCC regardless of the dim en- sion of the consid ered problem. Furthermor e, MCC behaviour is totally consistent also for the binary case. This given, we can suggest MCC as the best o ff -th e-shelf ev aluating tool fo r gener al purpo se tasks, while mor e subtle measures such as CEN sh ould be reserved for specific topic where more refined discrimination is crucial. References Abramson, N. (1963). Information theory and coding . McGra w-Hill. Baldi, P ., Brunak, S., Ch auvin, Y ., Andersen, C., & Nielsen , H. (2000). Assess- ing the accurac y of prediction algori thms for classificatio n: an overvi ew. Bioinformati cs , 16 , 412–424. Bradle y , A. (1997). The use of the area under the R OC curve in the ev aluati on of machine learning algorit hms. P attern Rec ognition , 30 , 1145–1159. Demˇ sar , J. (2006). Statisti cal Comparisons of Classifiers ov er Multiple Data Sets. J ournal of Machine Learning Resear ch , 7 , 1–30. Diri, B., & Albayrak, S. (2008). V isuali zation and analy sis of classifiers per- formance in multi -class medical data . Expert Systems wi th Applicat ions , 34 , 628–634. Everson, R., & Fieldsend, J. (2006). Multi-cl ass R OC analysis from a multi- object iv e optimisati on perspec tiv e. P attern Recogniti on Letters , 27 , 918– 927. Felkin, M. (2007). Comparing Classific ation Results betwe en N-ary and Bi- nary Problems. In Studies in Computational Intellig ence (pp. 277–301). Springer -V erlag volume 43. Ferri, C., Hern ´ andez-Orallo, J., & Modroiu, R. (2009). An experimenta l com- parison of perfor mance measures for classific ation. P attern Recogn ition Let- ters , 30 , 27–38. Ferri, C., Hern ´ andez-Oral lo, J. , & Salido, M. (2003). V olume under the ROC surfac e for multi-class problems. In In P r oc. of 14th Eur opean Confere nce on Mach ine Learning (pp. 108–120). Springer-V erlag. Freitas, C., De Carv alho, J., Oli ve ira Jr ., J., Aires, S., & Sabourin, R. (2007a). Confusion mat rix disagre ement for multip le classifiers. In L. Rueda, 4 D. Mery , & J. Kittler (Eds.), Pr oceedings of 12th Ibero american Congress on P attern R eco gnition, CIAR P 2007, LNCS 4756 (pp. 387–396). Springer - V erlag . Freitas, C., De Carva lho, J., Oliv eira Jr ., J. , Aires, S., & Sabourin, R. (2007b). Distance -based Disagree ment Classifiers Combinati on. In Pr oceeding s of the International J oint Confe rence on Neur al Network s, IJCNN 2007 (pp. 2729–2733). IEEE. Garc ´ ıa, S., & Herrera, F . (2008). An E xtension on ”Statistic al Comparisons of Classifiers over Multiple D ata Sets” for all Pairwise Comparisons. J ournal of Machin e Learning Researc h , 9 , 2677–2694. Gorodkin, J. (2004). Comparing two K -cate gory assignment s by a K-category correla tion coe ffi cient . Computational Biolo gy and Che mistry , 28 , 36 7–374. Hand, D., & Till , R. (2001). A Simple Genera lisation of the Area Under the R OC Curve for Multiple Class Classificatio n Problems. Machine Learning , 45 , 171–186. Hanle y , J., & McNeil, B. (1982). T he meanin g and use of the area under a recei ve r operat ing chara cteristic (ROC) curv e. R adiolo gy , 143 , 29–36. Huang, J., & L ing, C. (2005). Using A UC and Accura cy in E va luating Learn ing Algorith ms. IEEE T ransacti ons on Knowledg e and Data Engineering , 17 , 299–310. Landgrebe, T ., & Duin, R. (2005). On Ne yman-Pearson opti misation for multi- class c lassifiers. In Pr oc. 16th Annual Sympo sium of the P attern Rec ogniti on Assoc. of South Africa . PRASA. Landgrebe, T ., & Duin, R. (2006). A simplified extensio n of the Area under the R OC to the multiclass domain . In Proc . 17th Annual Symposium of the P attern R eco gnition Assoc. of South Africa (pp. 241–245). PRASA. Landgrebe, T ., & Duin, R. (2008). E ffi cient multicla ss R OC approximation by decomposit ion via confusion m atrix perturbat ion analysis. IEEE T ransac- tions P att ern A nalysis Mac hine Intellig ence , 30 , 810–822. Li, Y . (2009). A gene ralization of AUC to an or dered multi-class dia gnosis and applicati on to longitud inal data analysis on intellect ual outcome in pe- diatric brain-tumor patient s . Ph.D. thesis Colle ge of A rts and Sciences, Georgi a State Univ ersity . Matthe ws, B. (1975). Co mparison of the predict ed and observed secondary structure of T4 phage lysozyme. Biochimica et Biophy sica Acta - Pr otein Structur e , 405 , 442–451. Shannon, C. (1948). A Mathema tical Theory of Communicat ion. The Bell System T echnical J ournal , 27 , 379–423, 623–656. Sindhwa ni, V ., Bhatta charge, P ., & Rakshit, S. (2001). Information theoretic feature creditin g in multiclass Support V ector Machine s. In R. Grossman, & V . Kumar (Eds.), Proc. Fir st SIAM Internati onal Confer ence on Data Mining , ICDM01 (pp. 1–18). SIAM. Sokolo v a, M., & Lapalme, G. (2009). A systemati c analysis of performanc e measures for c lassification tasks. Information Proc essing and Mana gement , 45 , 427–437. v an Son, R. (1994). A me thod to quantify the error di stributio n in confusi on ma- trices . T echni cal Report IF A Proceed ings 18 Institute of Phonetic Sciences, Uni versity of Amsterdam. Stokic, D. , Hanel, R. , & Thurner , S. (2009). A fast and e ffi cient gene-netw ork reconstru ction method from multipl e over -expression experiment s. B MC Bioinformati cs , 10 , 253. Supper , J. , Spieth, C., & Z ell, A. (2007). Reconst ructing Linear Gene Regula - tory Networks. In E. Marchiori, J. Moore, & J. Rajapa kse (Eds.), P r oceed- ings of the 5th Eur opean Confere nce on Evolutio nary Computation, Ma- chi ne Learning and Data Mining in Bioinformatic s, EvoBIO2007, LNCS 4447 (pp. 270–279). Springer-V erlag. The MicroArray Q ualit y Control (MA QC) Consortium (2010). The MA QC-II Project : A comprehensi ve study of common practices for the de vel opment and vali dation of microarray -based predicti ve models. Natur e Biotechnol - ogy , 28 , 827–838. V an Calster , B., V an Belle , V ., Condous, G., Bourne, T ., Ti mmerman, D., & V an Hu ff el, S. (2008). Multi-c lass A UC metrics and weighted alt ernati ves. In Pr oc. 2008 Interna tional J oint Co nfere nce on Neura l Net works, IJCNN08 (pp. 1390–1396). IEEE. W ei, J.-M., Y uan, X. -J., Hu, Q.-H. , & W ang, S.-Q. (2010a ). A nov el measure for e v aluating classifiers. Expert Systems wit h Applicati ons , 37 , 3799–3809. W ei, J.-M. , Y uan, X.-J., Y ang, T ., & W ang, S.-Q. (2010b). Ev aluating Cla ssi- fiers by Confusion Entrop y . Information Proce ssing & Manag ement , Sub- mitted . 5
Original Paper
Loading high-quality paper...
Comments & Academic Discussion
Loading comments...
Leave a Comment